Bring your Jupyter widgets to Shiny.
Bring the Python libraries you already know (plotly, altair, etc) into a reactive web app with one decorator. Build rich and delightful experiences with user interaction and performant updates.
Dozens of integrations, grouped by what you're building.
Each group opens a set of guides. Every guide shows the widget rendering, the user's gestures flowing back to Python, and the widget updating in place.
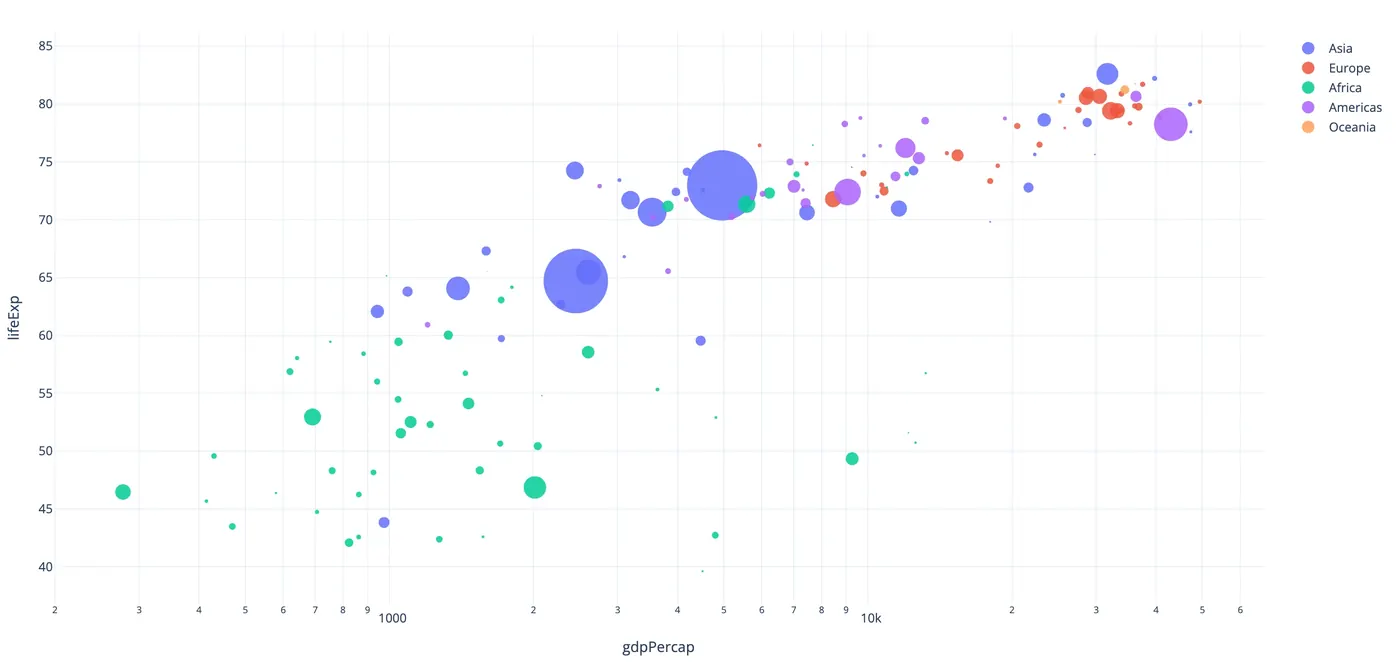 11
Charts
plotly · altair · bokeh · matplotlib …
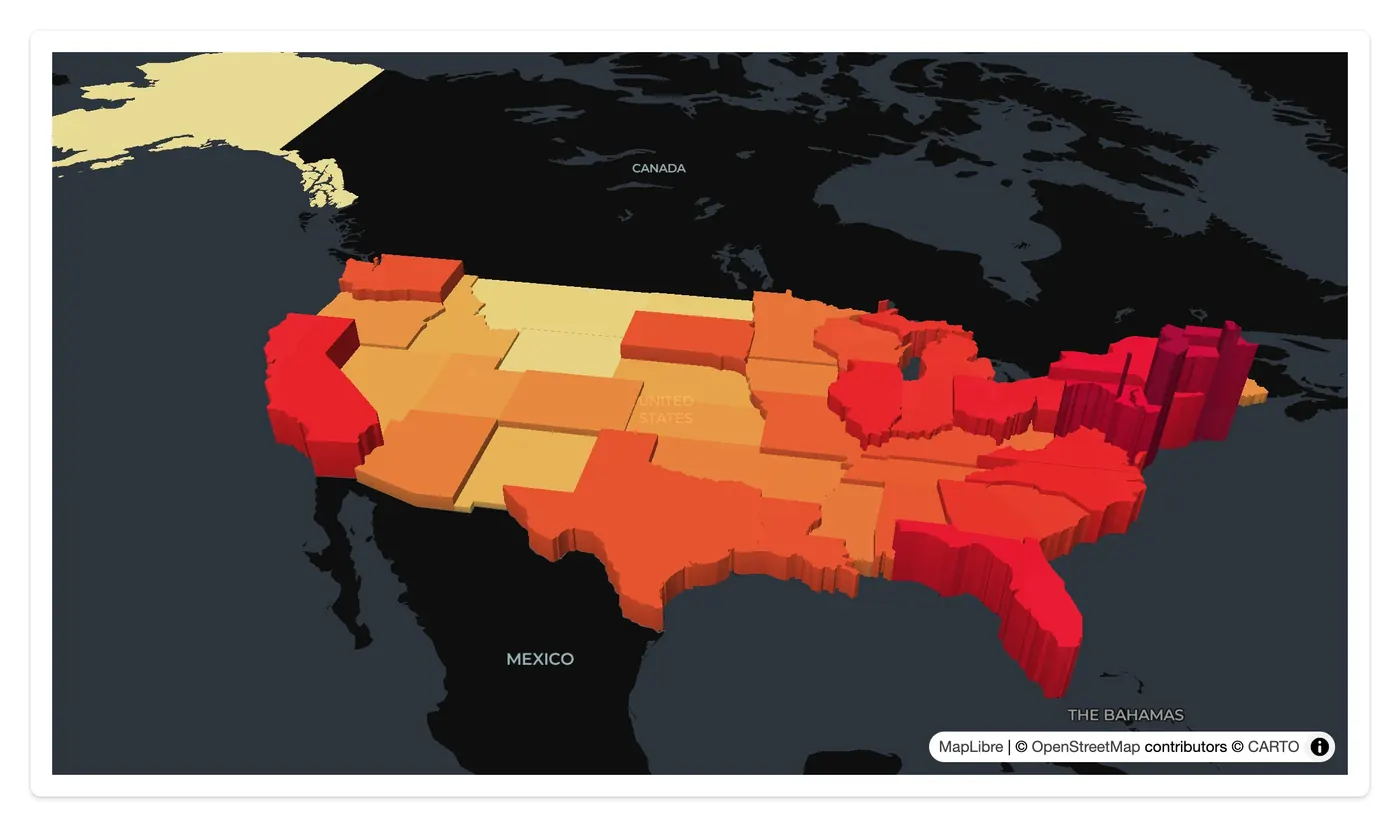 09
Maps & geospatial
lonboard · maplibre · ipyleaflet · kepler.gl …
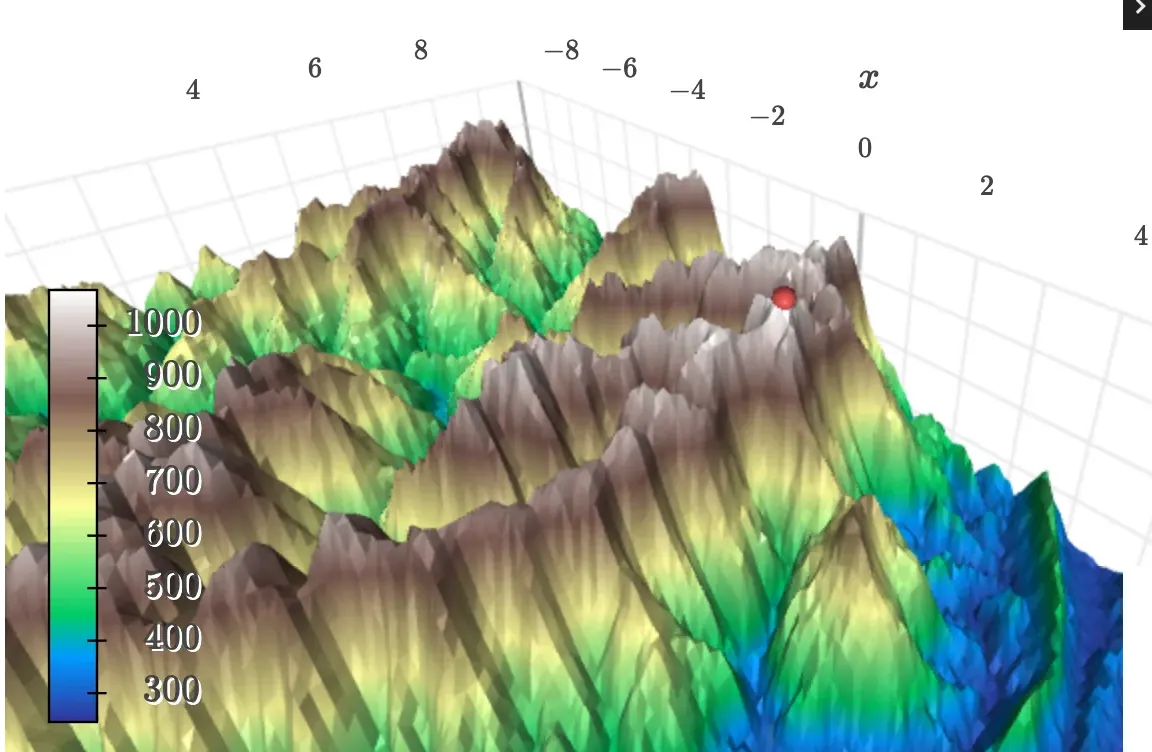 04
3D
k3d · pythreejs · pyvista · ipyvolume
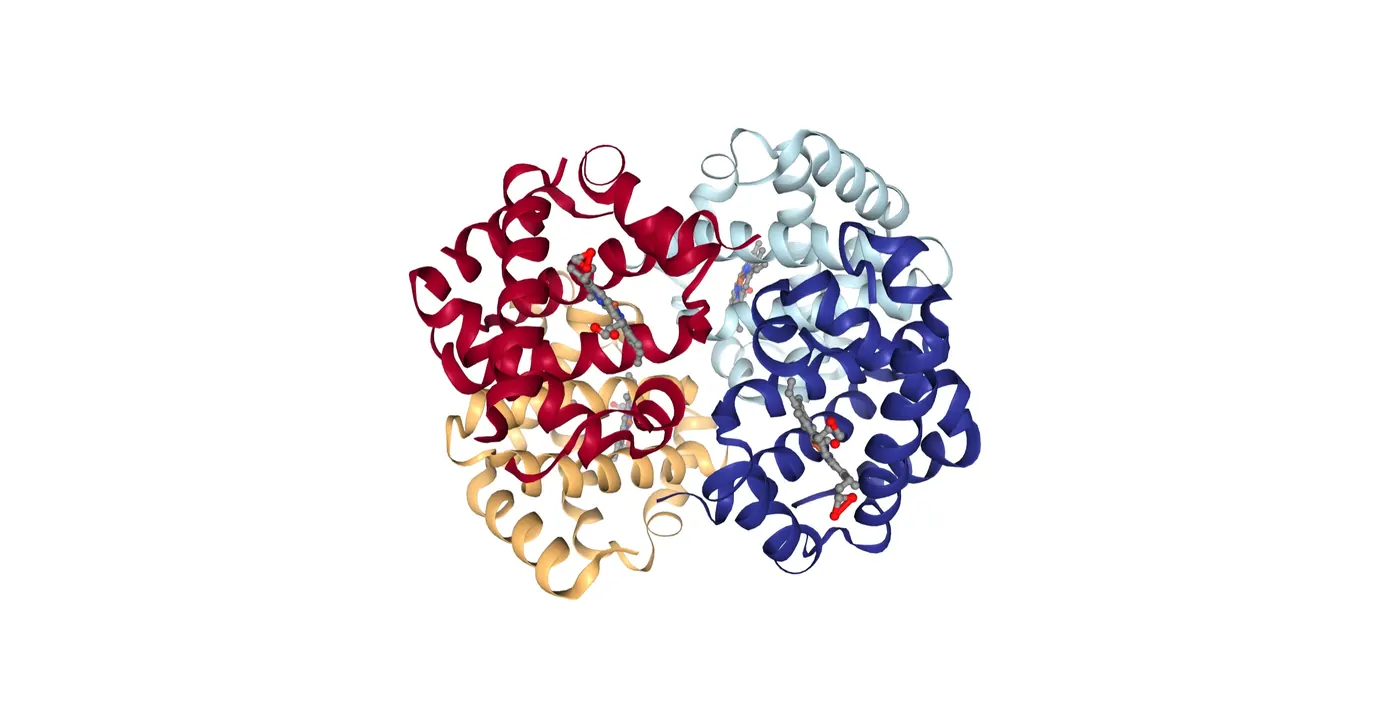 06
Scientific
nglview · niivue · vizarr · mols2grid …
 04
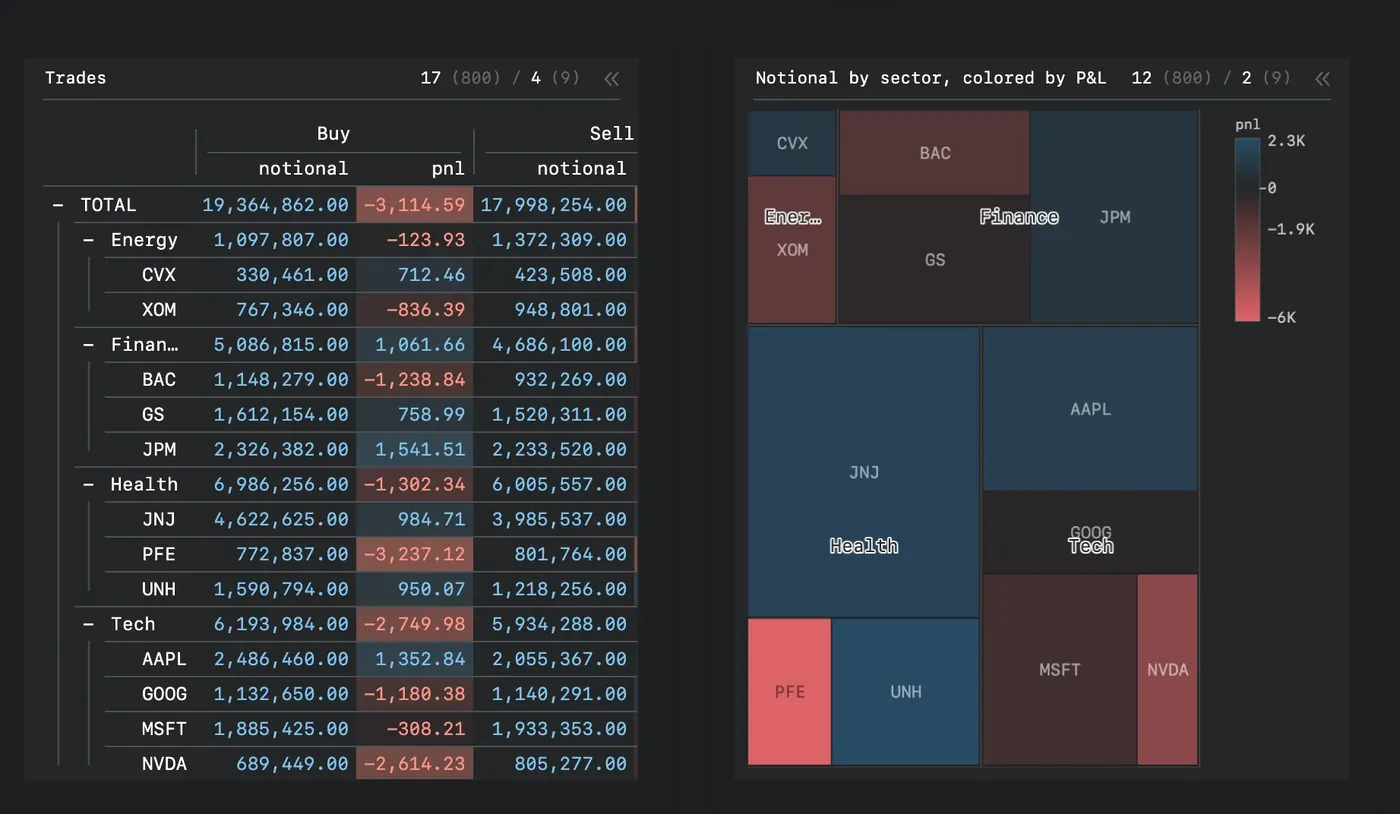
Tables & grids
itables · reactable · perspective · ipydatagrid
 04
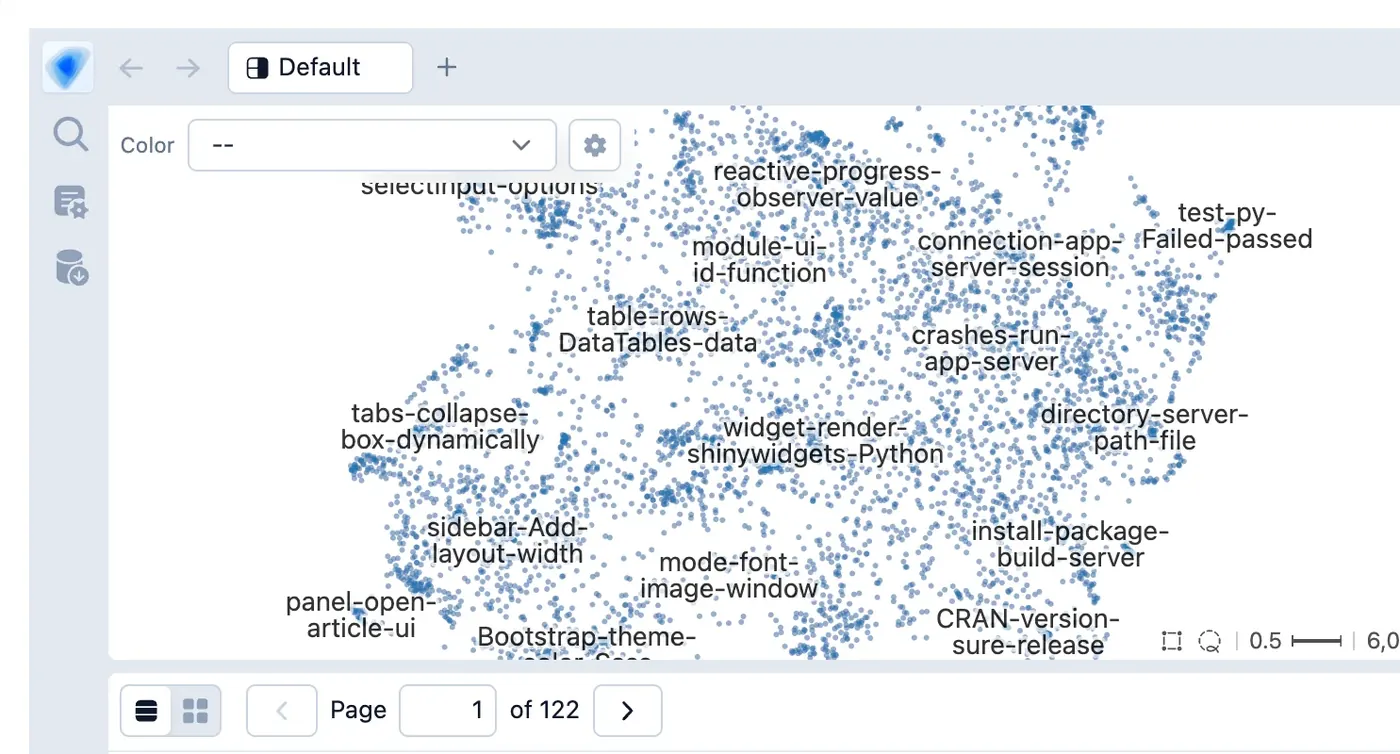
Data exploration
embedding-atlas · mosaic · quak · pygwalker
 02
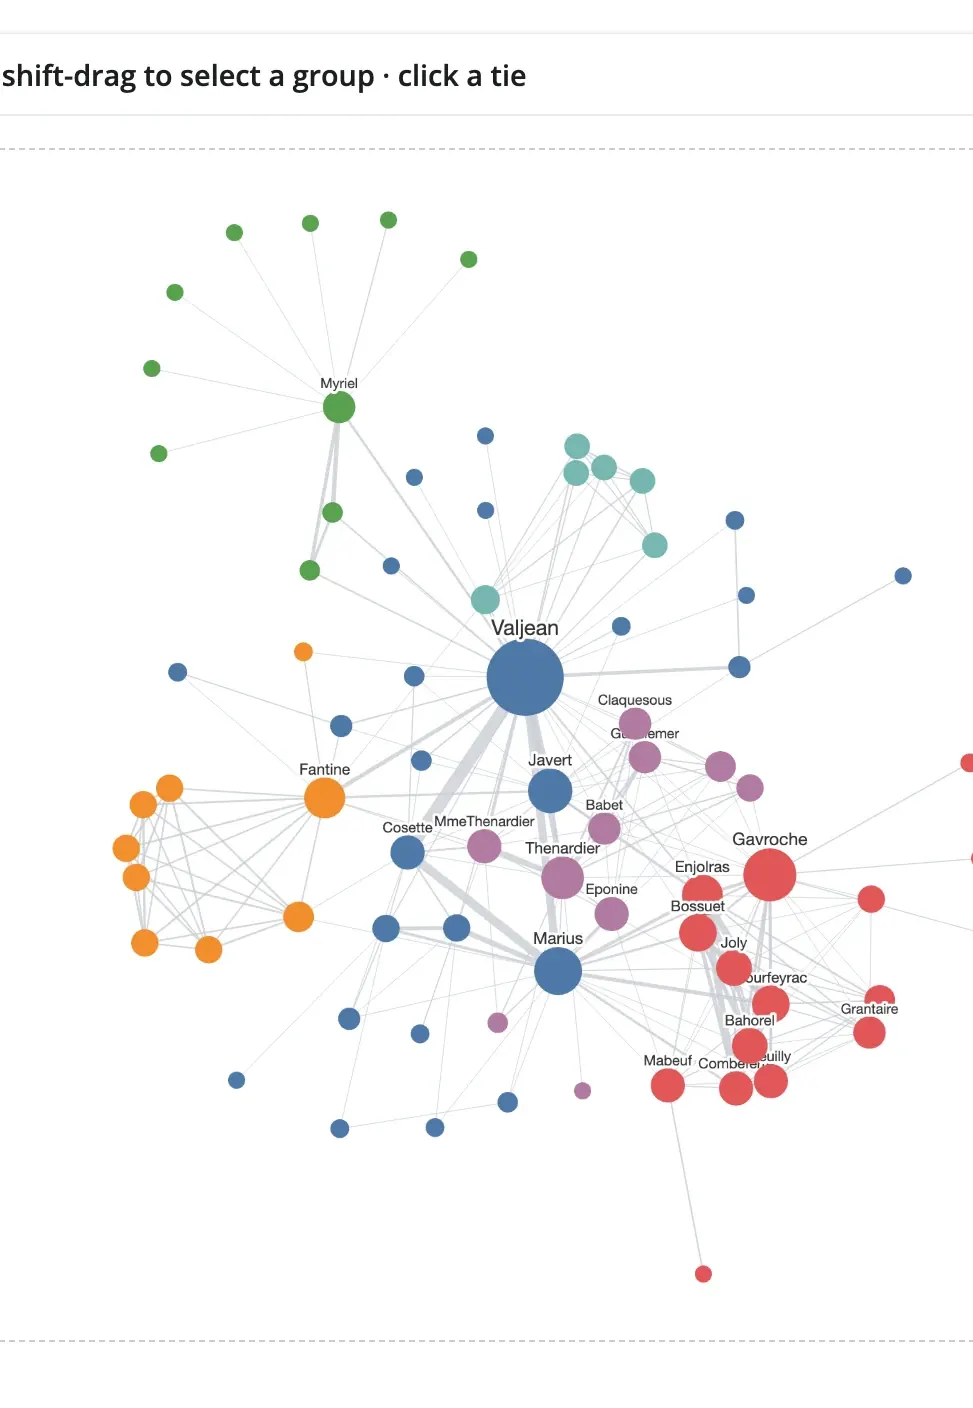
Networks
ipycytoscape · ipysigma
 03
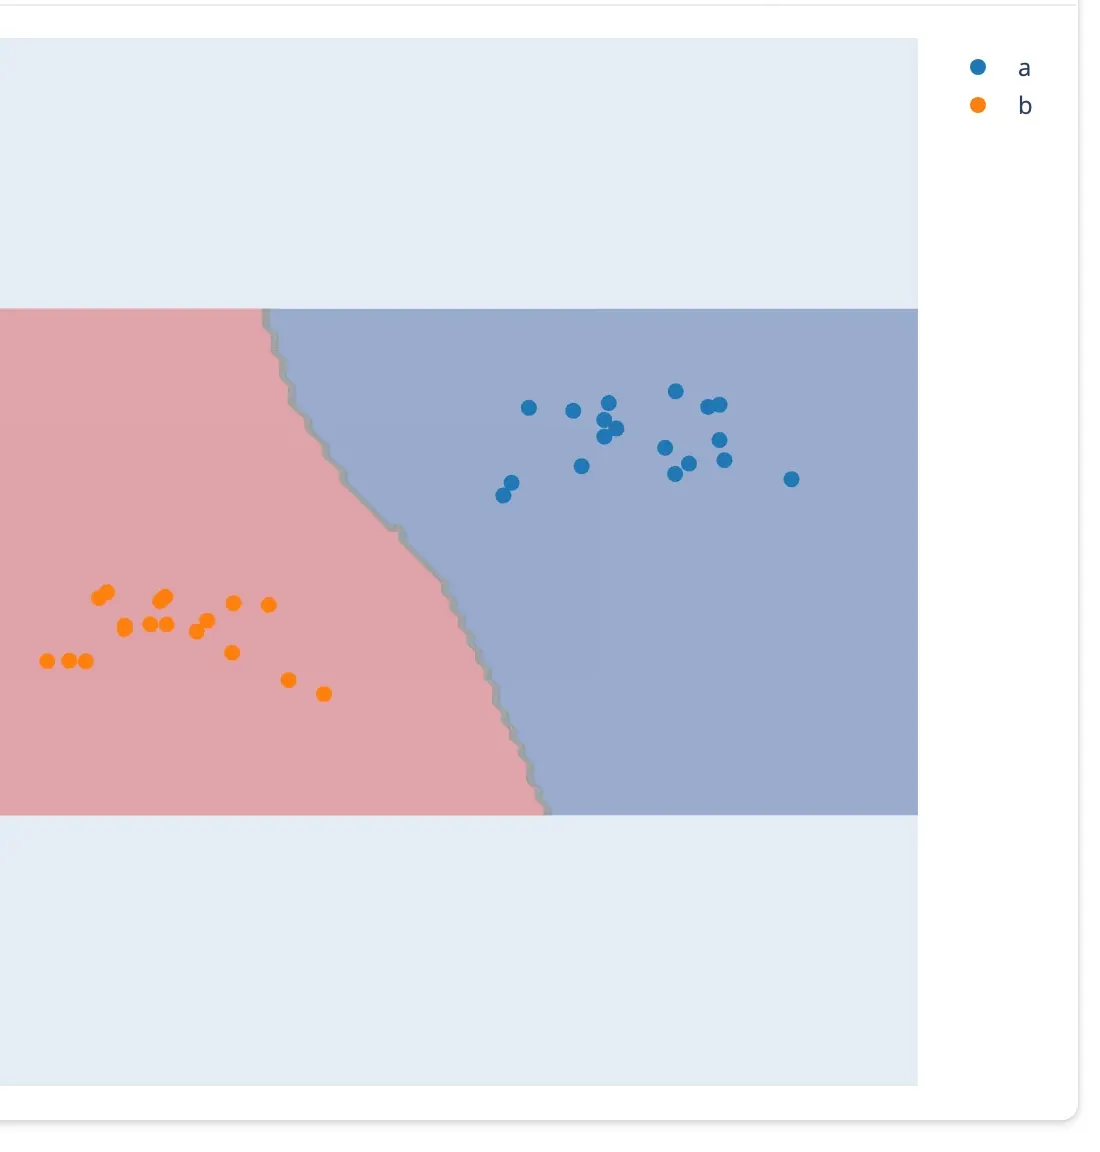
Input & drawing
drawdata · ipycanvas · ipyfilechooser
A few lines of Python, from widget to input.
Pick a widget. The highlighted call is how your app reads what the user did; flip between before and after the gesture.
Every example runs as-is: shiny run app.py. See all the guides →
Three ideas, every widget.
Learn them once with one widget and they carry over to all the others. Each one is a page in the guide.
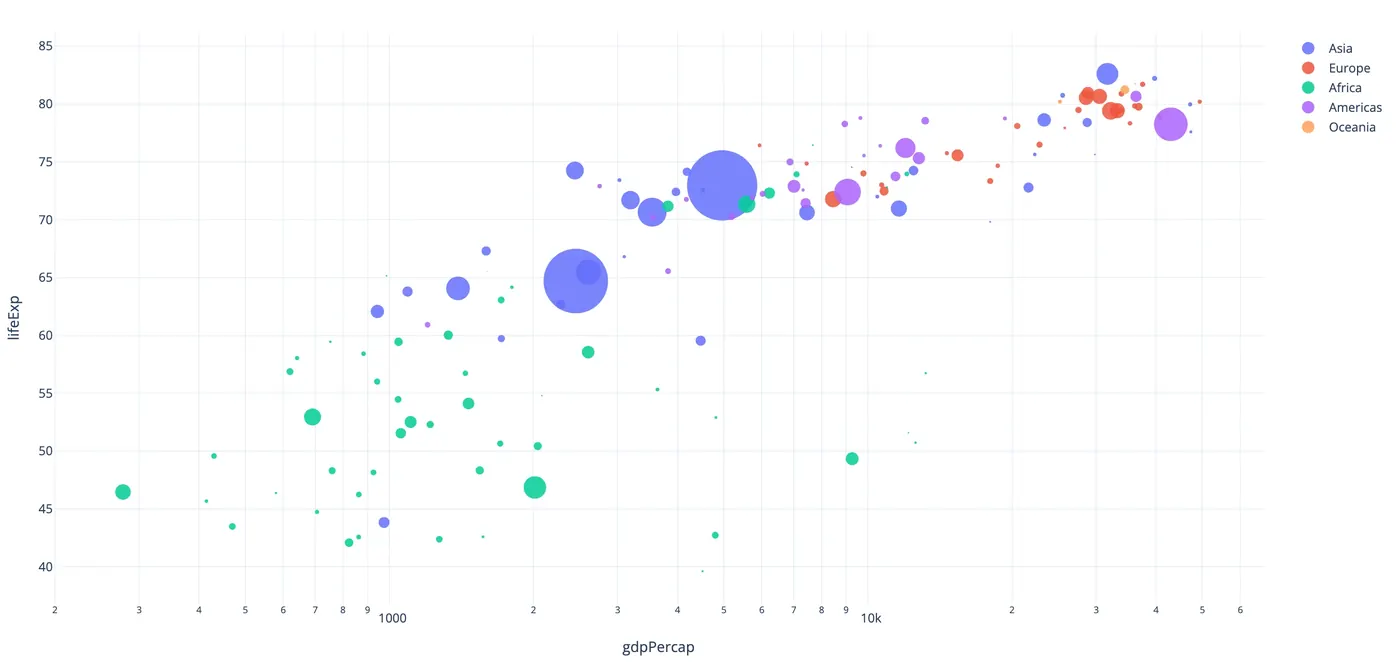
Render
Return a figure, map, or scene from a decorated function. It fills its card like any Shiny output.
@render_plotly
def plot():
    return px.scatter(df, ...)
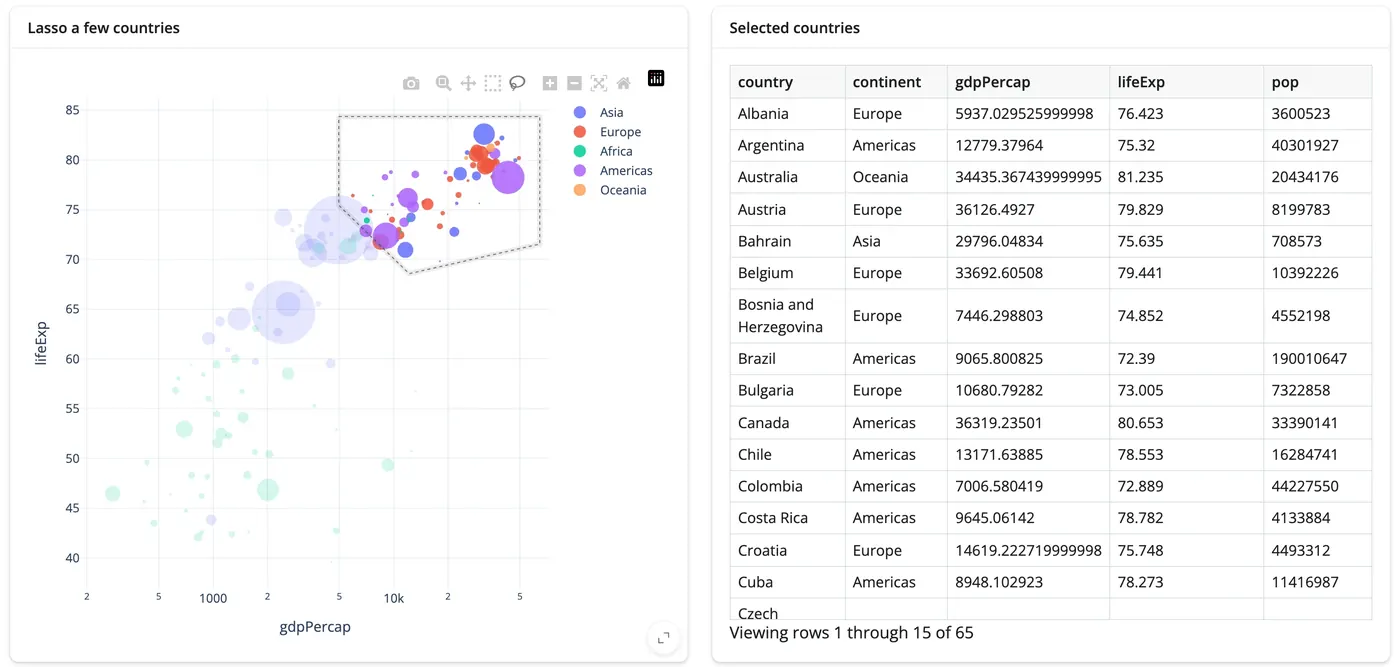
React
Every gesture is an accessor. Call it from any reactive context, the way you'd call input.x().
@render.data_frame
def picked():
    return plot.selected_rows(df)
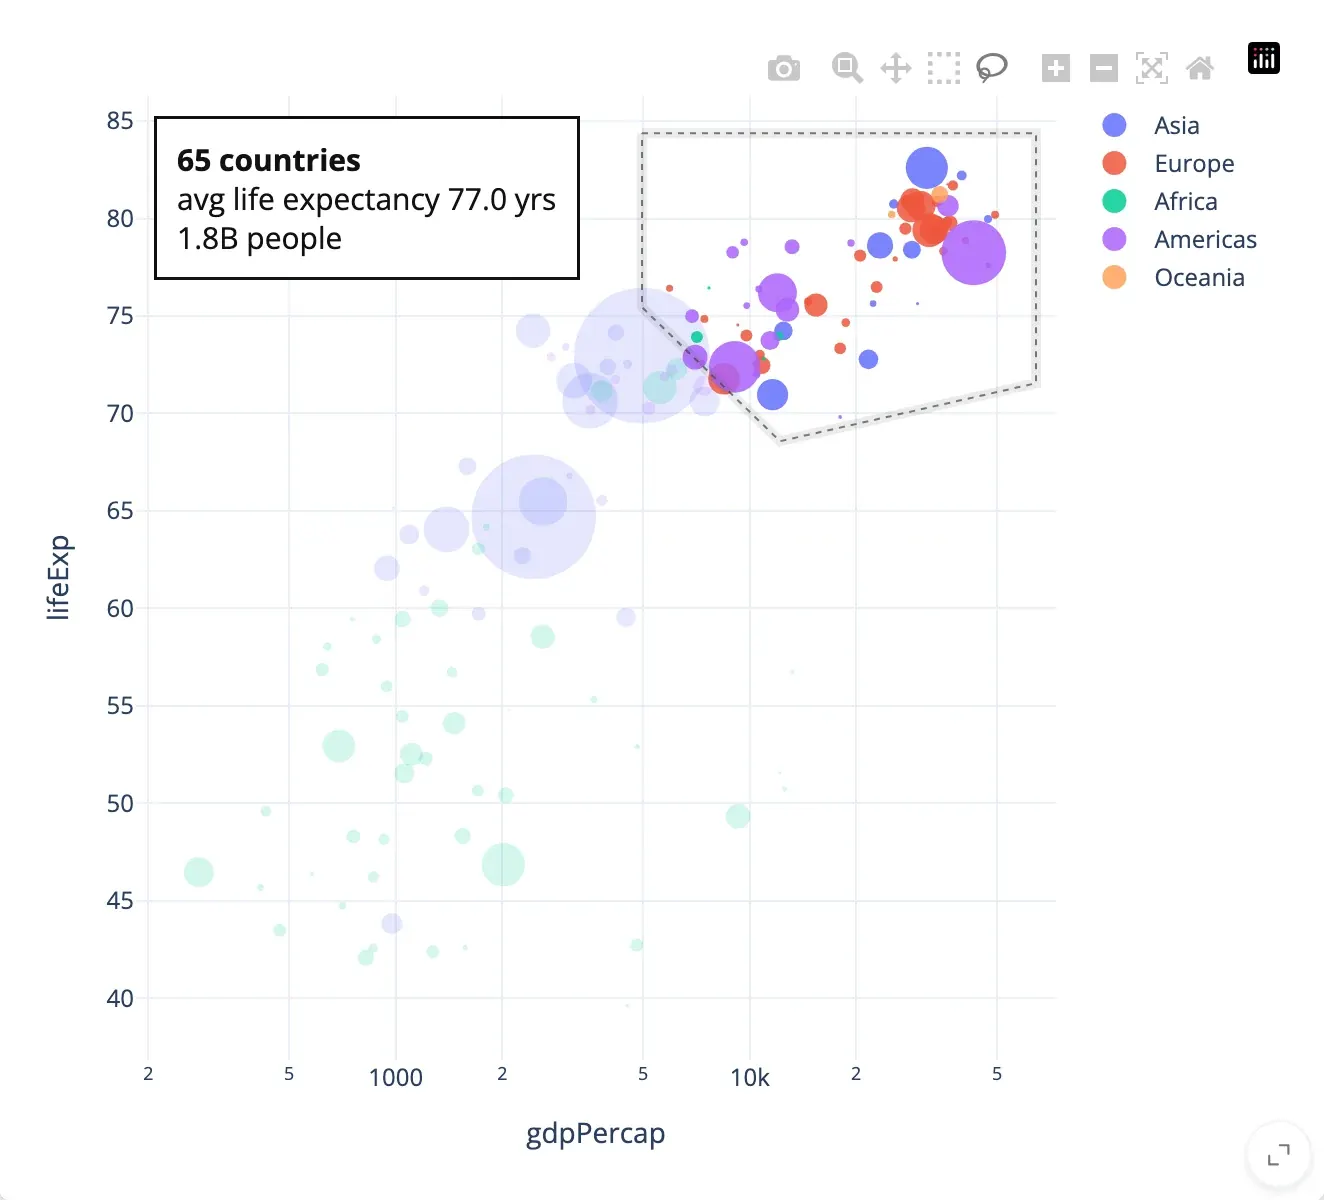
Update in place
Change the live widget from Python. Here a summary of the selection is written onto the chart, and the lasso and zoom stay put.
@reactive.effect
def _summarize():
    rows = plot.selected_rows(df)
    plot.widget.layout.annotations = [
        dict(text=f"{len(rows)} countries…", ...)
    ]
Whole apps, not just widgets.
All showcases & templates →Real data, several views driving each other, a hundred or two lines of Python. Every one is open source and runs with shiny run app.py.
When your app outgrows the basics.
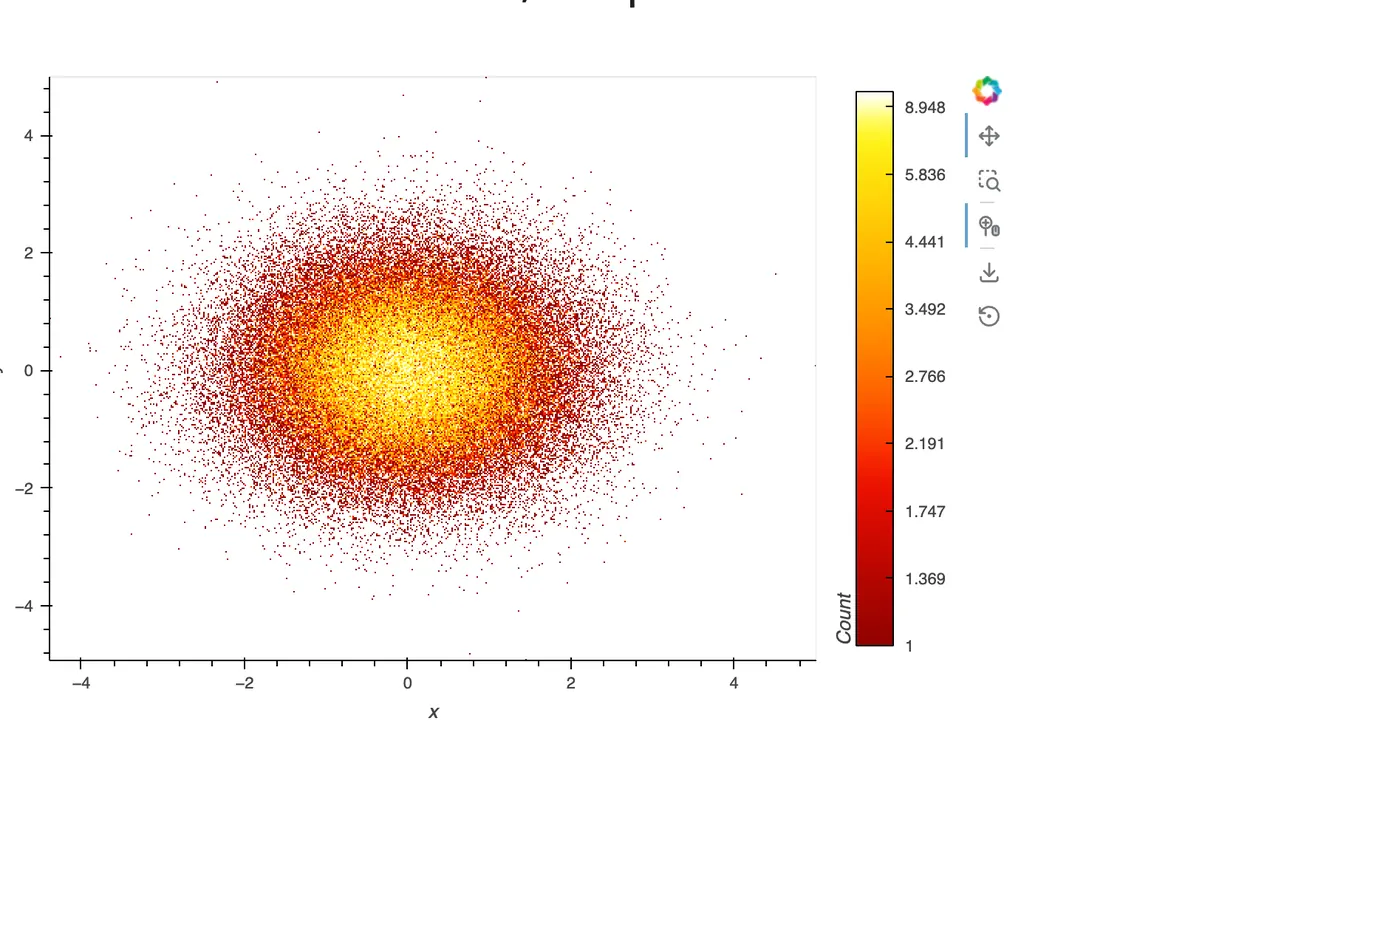
Millions of rows
Draw on the GPU, aggregate on the server, or query only what's visible. Three approaches, measured.
Large data & performance →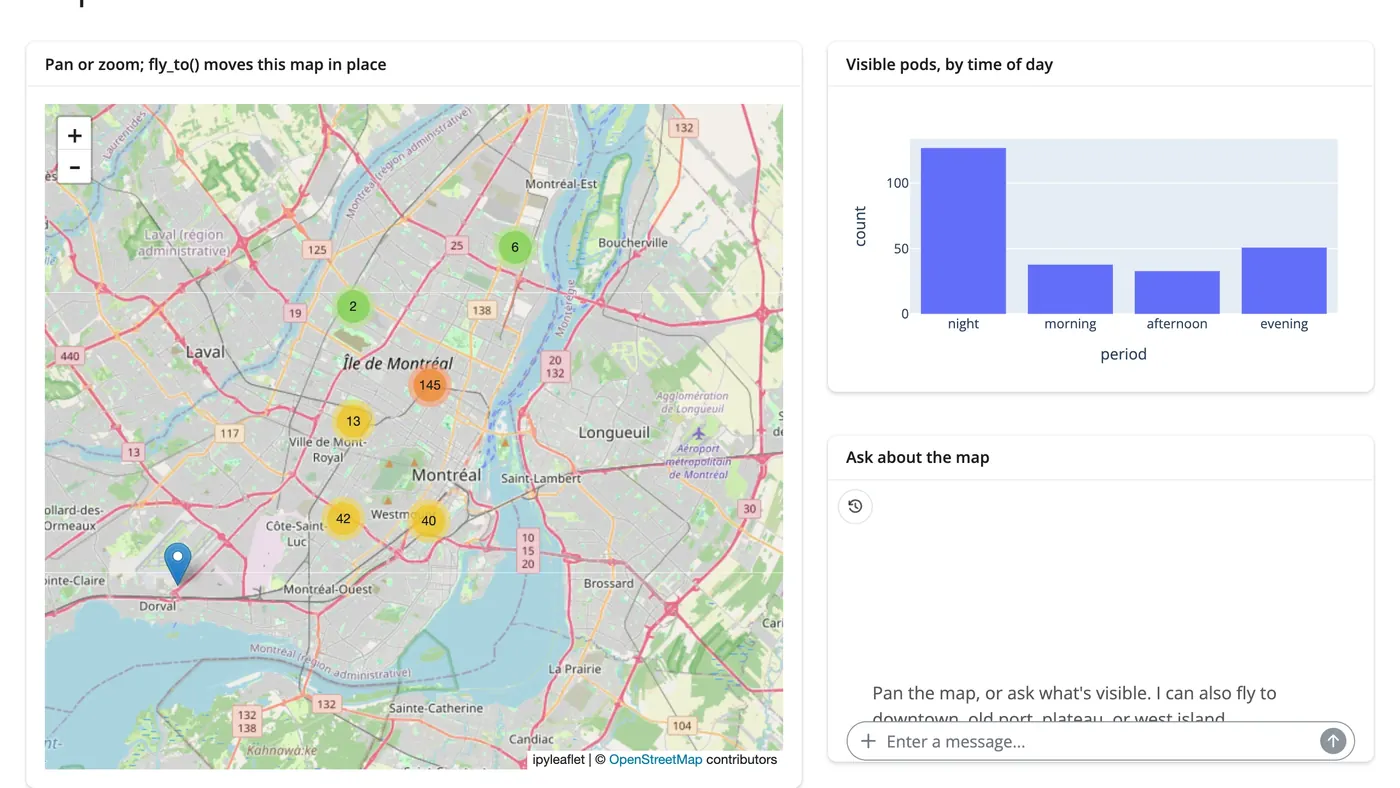
AI exploration
Let a chat filter your data, read a selection, or steer a map. The LLM sees the same accessors you do.
AI exploration →import anywidget, traitlets class Counter(anywidget.AnyWidget): _esm = "…" count = traitlets.Int(0).tag(sync=True) @render_widget def counter(): return Counter() counter.read("count")
Your widget isn't listed?
Any ipywidget or anywidget renders with @render_widget, including one you write yourself.