Chemical explorer
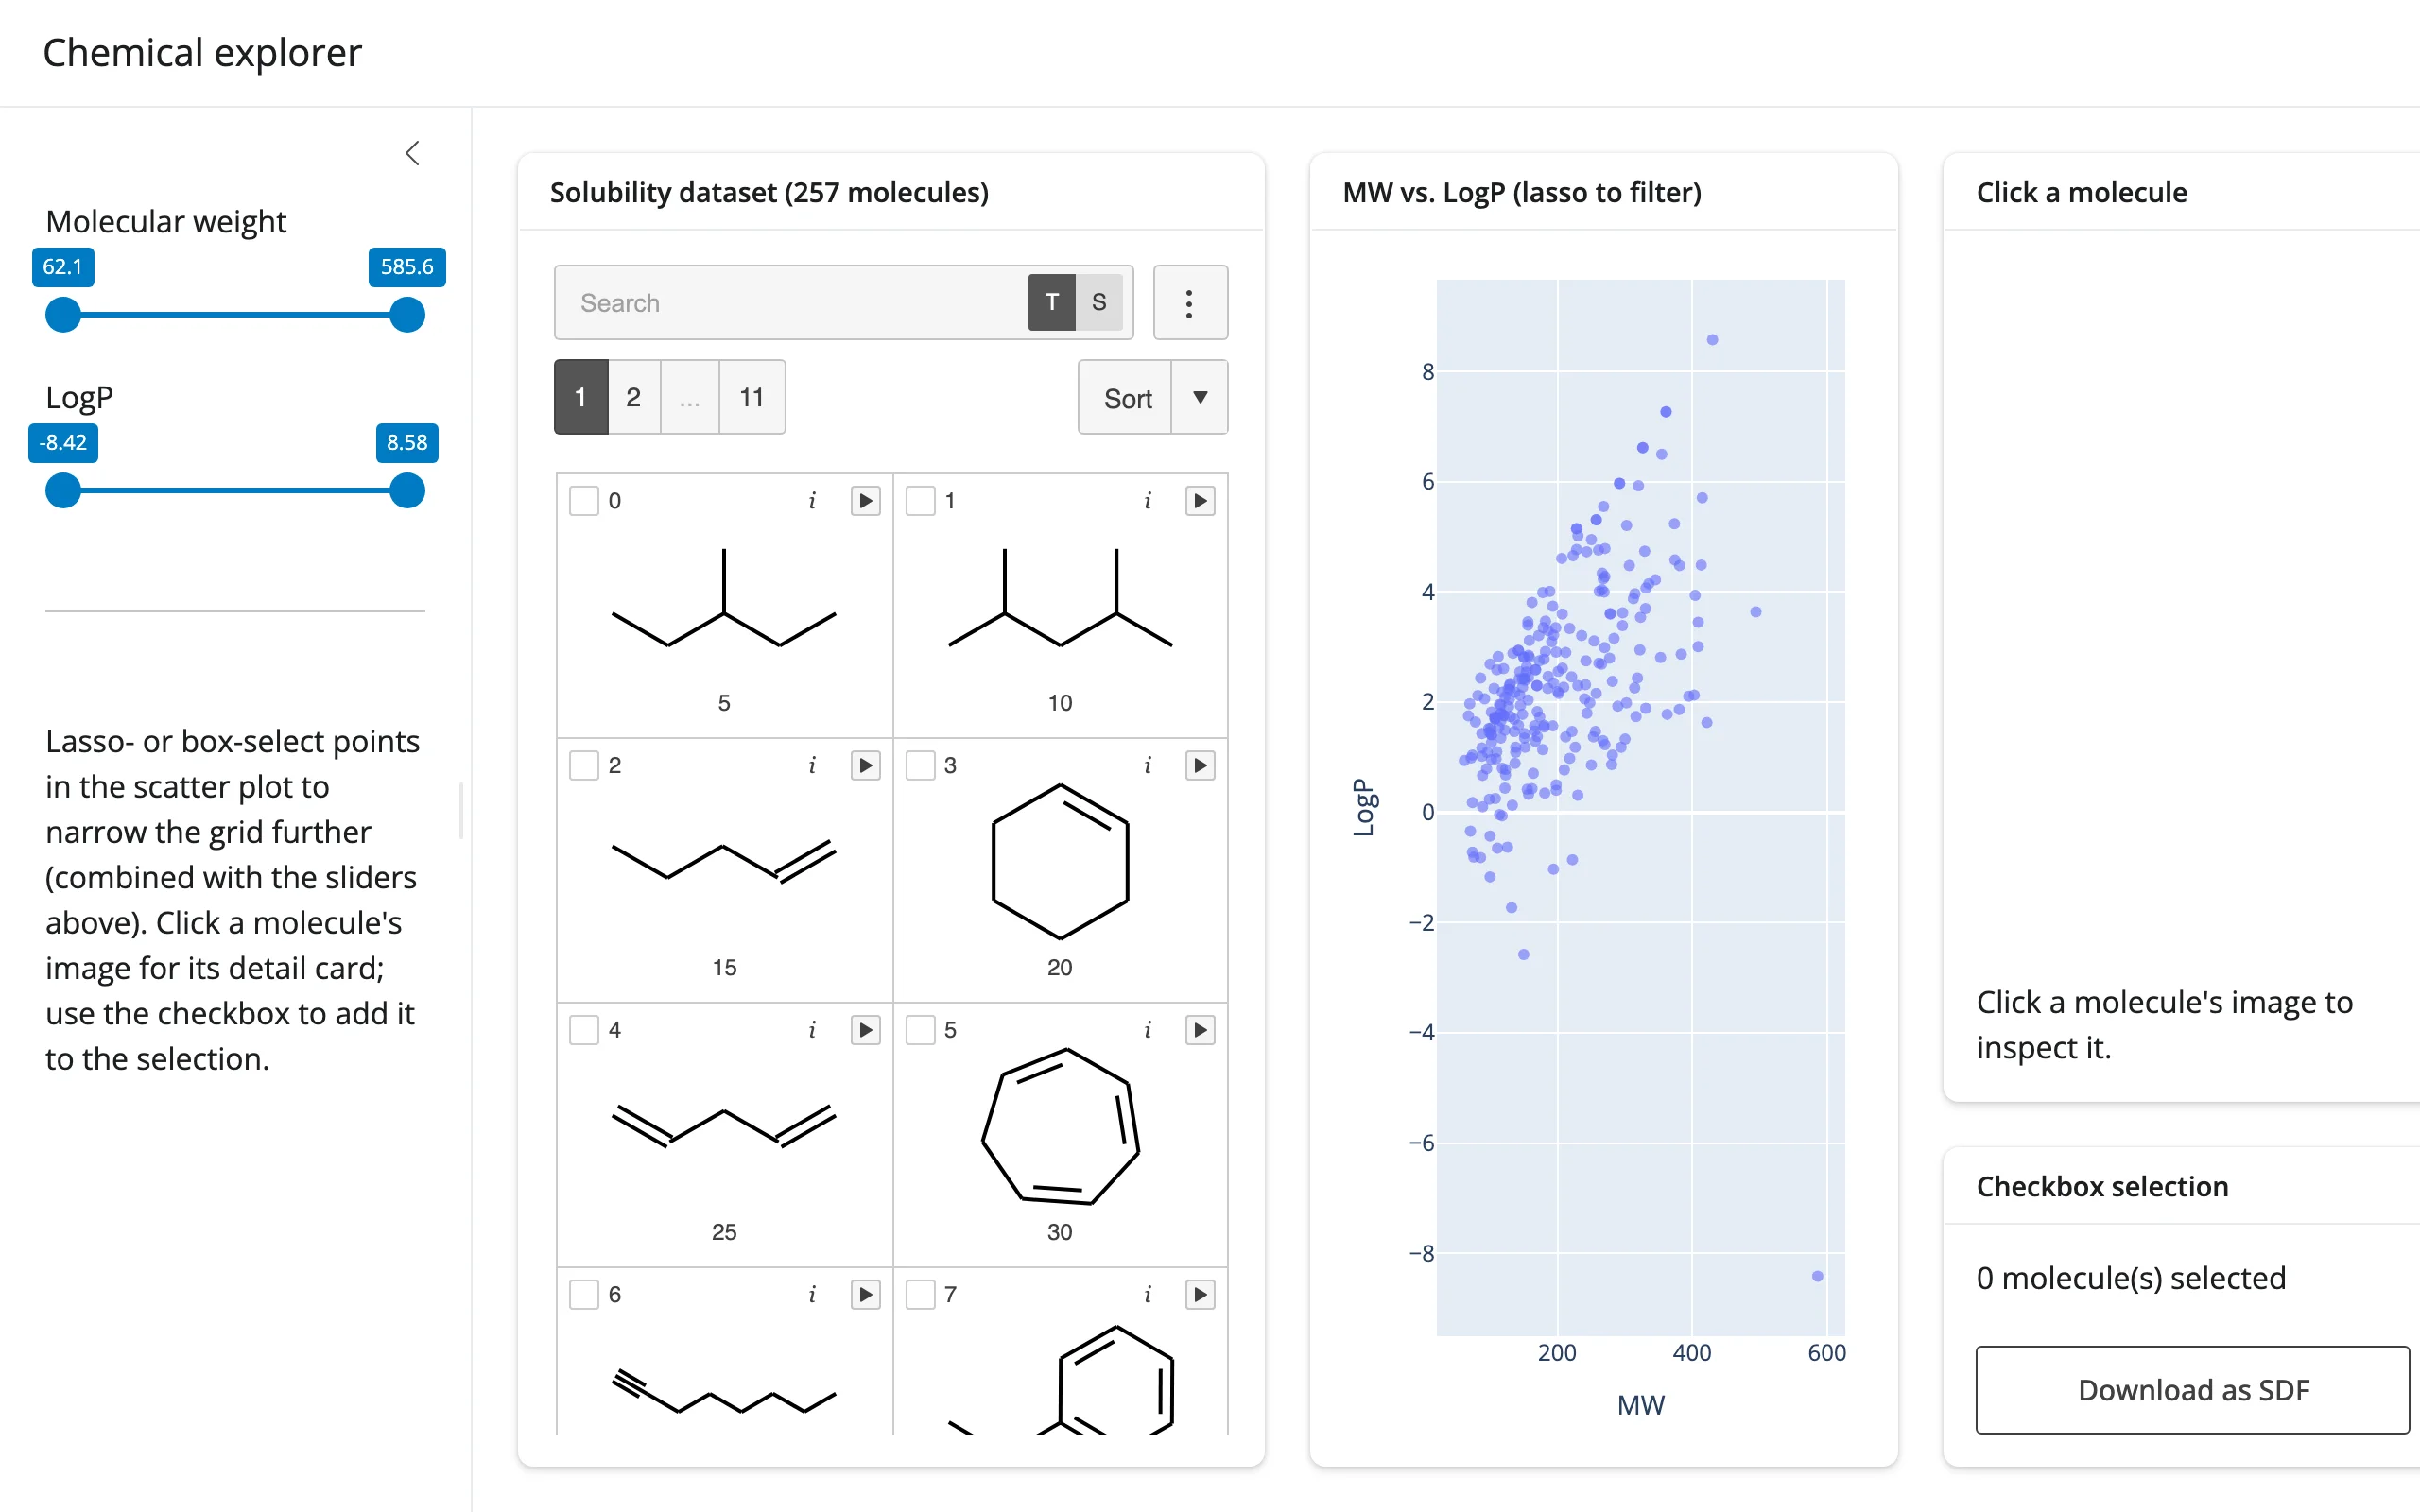
257 molecules from mols2grid’s bundled solubility dataset, with molecular weight and LogP computed via RDKit. Two molecular-weight/LogP sliders and a lasso-able plotly scatter plot both narrow the same mols2grid grid – combined with AND – entirely through grid.grid.filter(), so the grid is never rebuilt and the checkbox selection and scroll position survive every adjustment.
Run it
git clone --depth 1 https://github.com/posit-dev/py-shinywidgets
cd py-shinywidgets/website/gallery/showcases/chemical-explorer
uv run shiny run app.py
Source: app.py · Open in Shinylive
Try this
- Drag either slider: the grid’s visible molecules narrow immediately.
- Lasso- or box-select points on the MW-vs-LogP scatter plot: the grid narrows to just those molecules, intersected with whatever the sliders already allow.
- Click a molecule’s image in the grid: a detail card on the right redraws it with RDKit and shows its MW/LogP/LogS.
- Check a few molecules’ boxes, then Download as SDF: downloads exactly the checked molecules as a standard SDF file.
Accessors demonstrated
grid.clicked()– the full row (as a dict) of the most recently clicked molecule, used to drive both the RDKit depiction and the descriptor text.Noneuntil a first click.grid.selected()– the dict of currently checkbox-selected molecules (by mols2grid’s own index), read both for the live count and for the SDF export.scatter.selected()/scatter.selected_rows()– the plotly lasso’s selection, converted to a boolean mask over the same dataframe and combined with the slider mask before callinggrid.grid.filter().
Verification
Server boots clean, no extra packages needed beyond the base shinywidgets[mols2grid] + shinywidgets[plotly] install (RDKit ships with mols2grid). A real Playwright click on a grid cell’s .m2g-callback element (the per-cell click target mols2grid adds under clicks=True) moved the “Click a molecule” card from a placeholder to a real RDKit depiction and descriptor line (MW 86.2 LogP 2.44 LogS -3.68), confirmed against the rendered text – see img/hero.webp and img/after_click.webp.
Source: promoted from docs/widget-guides/mols2grid/gallery/showcase_chem_explorer.py (see NOTES.md).