Weather brush
Charts
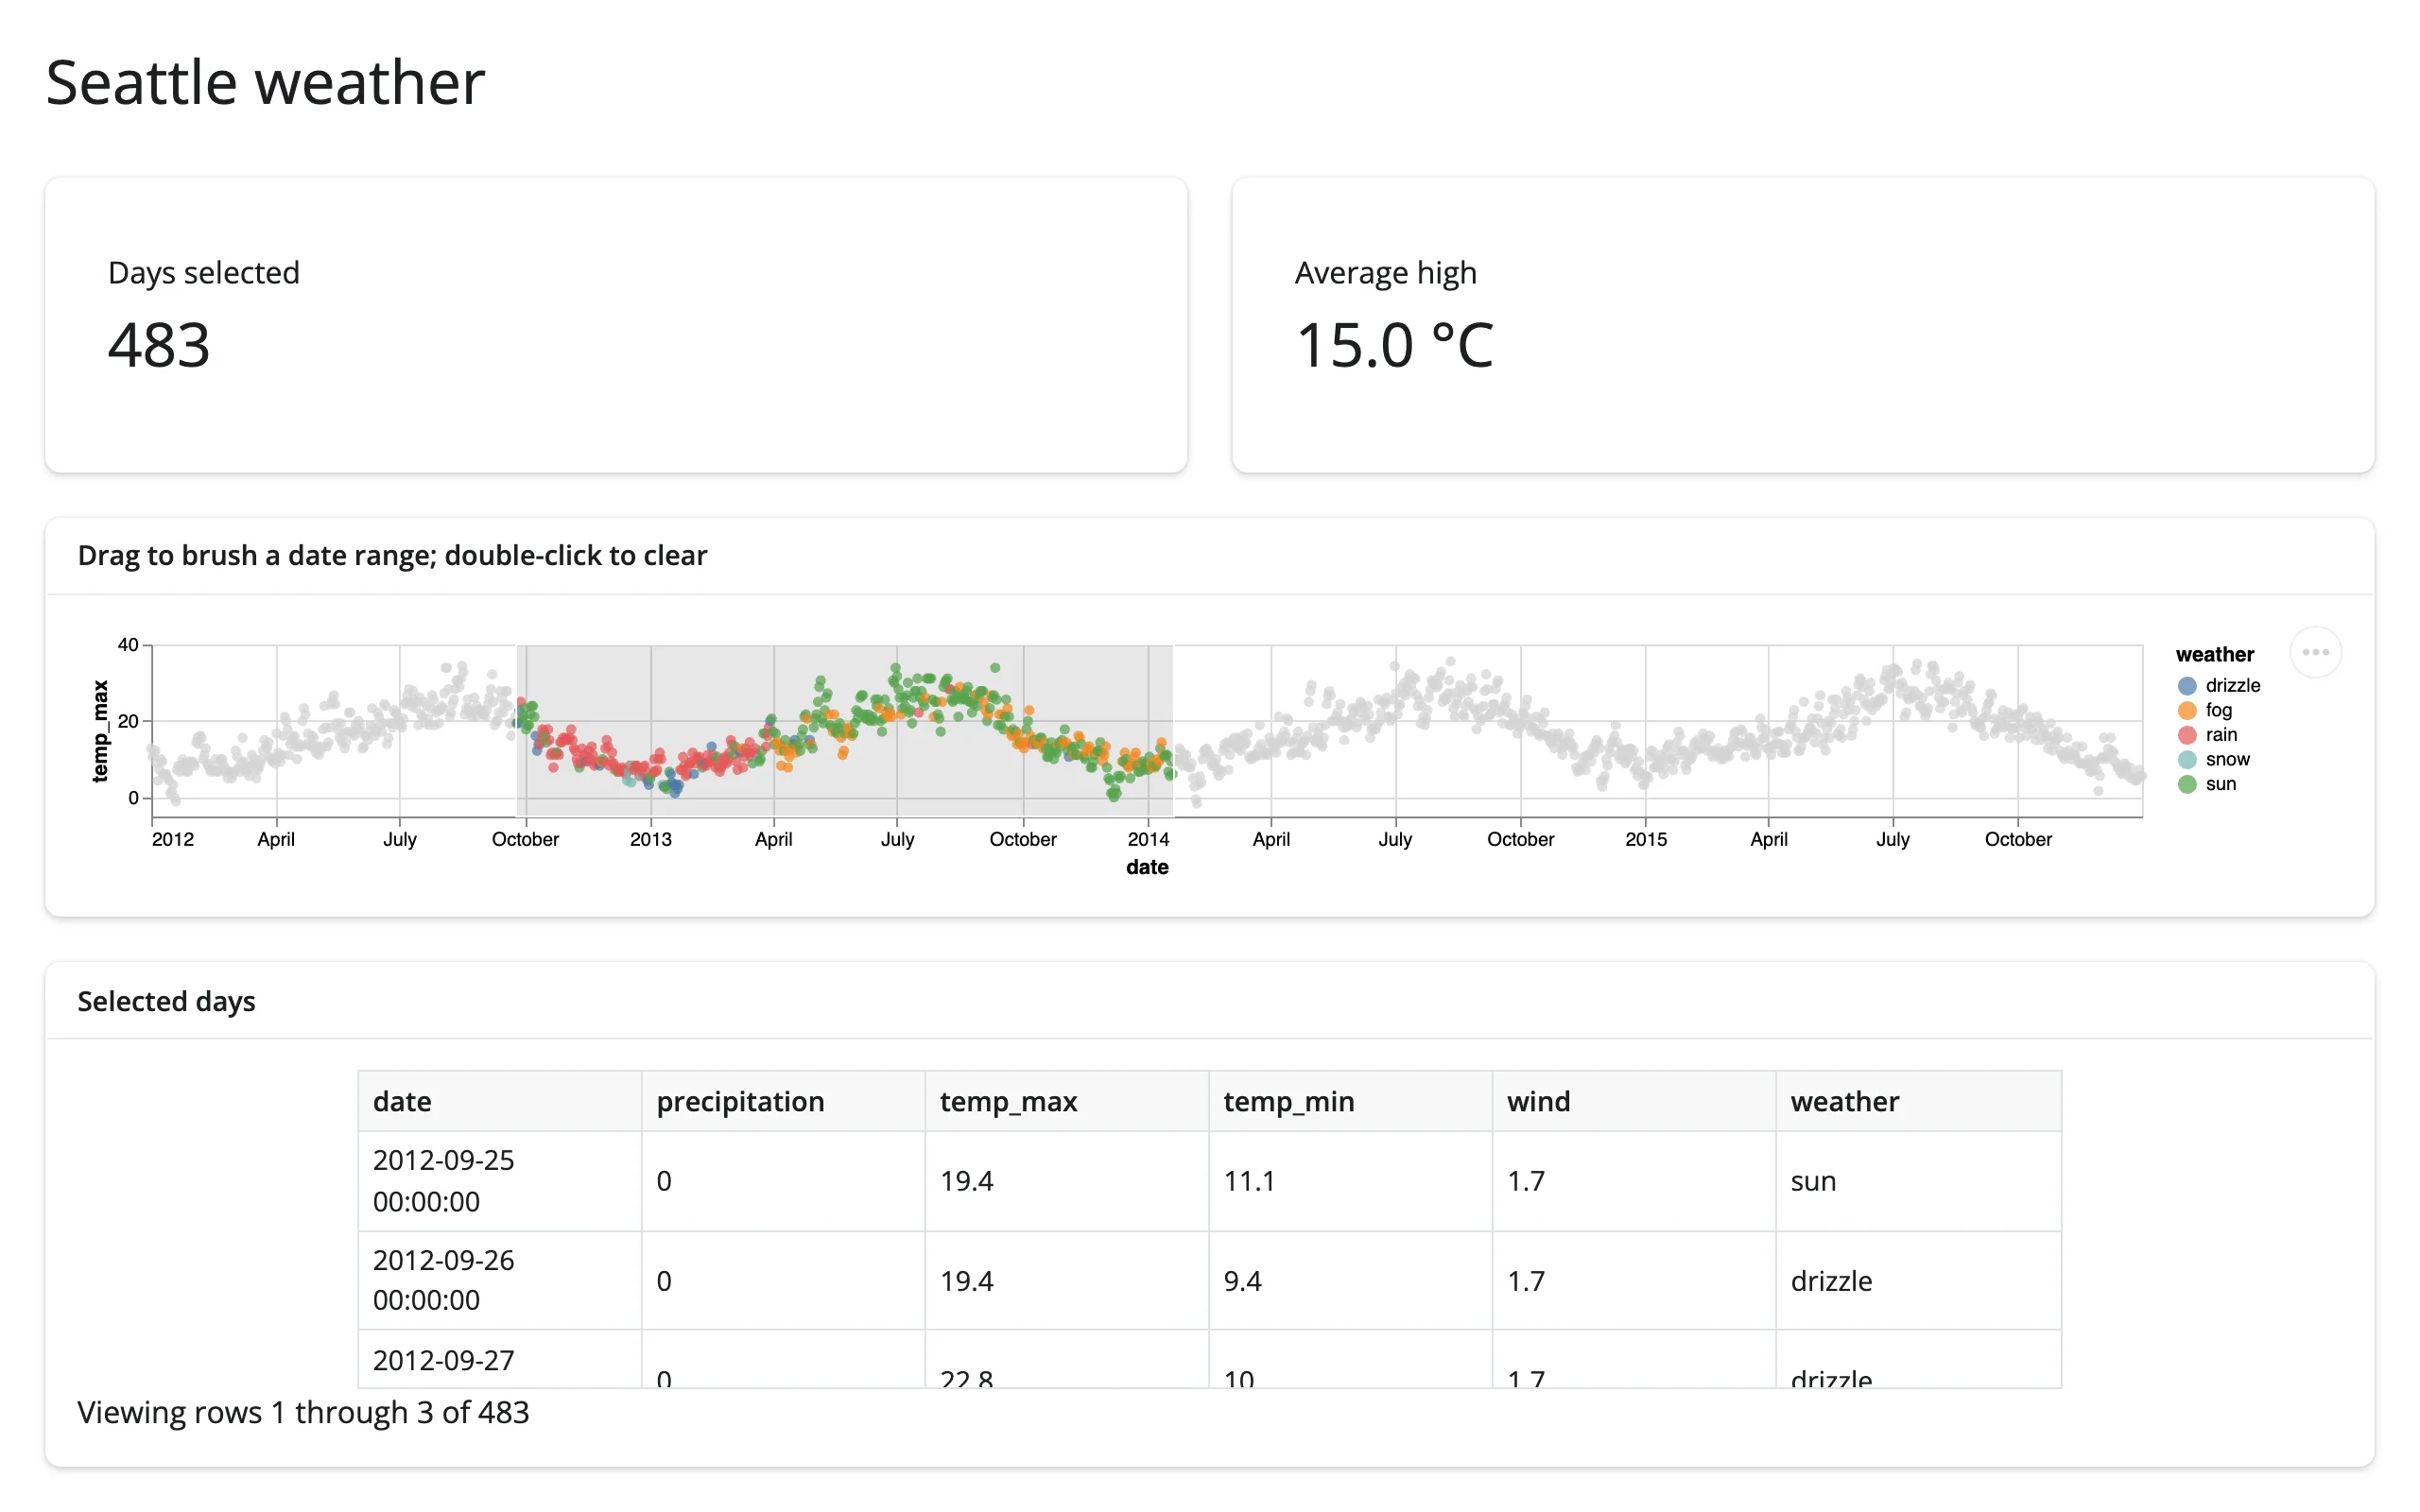
Brush a date range on an Altair timeline and see the matching days in a table and two value boxes, computed in Python from the selection.
An interval selection on a single Altair chart, read back into Python as a DataFrame. No second widget is needed to get a linked view: a value box and a render.data_frame table both derive from the same selected_rows("brush") call.
Run it
git clone --depth 1 https://github.com/posit-dev/py-shinywidgets
cd py-shinywidgets/website/gallery/templates/altair-weather-brush
uv run shiny run app.py
Source: app.py · Open in Shinylive
Try it
- Drag left-to-right across the scatter to brush a date range.
- Watch “Days selected” and “Average high” update, and the table below fill with the matching rows.
- Double-click the chart to clear the brush.
Accessors demonstrated
timeline.selected_rows("brush")– the rows ofweatherwhosedatefalls inside the namedbrushselection, as a DataFrame. Empty (notNone) when nothing is brushed.
What to change for your own data
- Replace
weatherwith your own DataFrame and adjust thex/y/colorencodings. encodings=["x"]restricts the brush to one axis (a date range here); drop it for a full 2D rectangular brush.- The selection name (
"brush") is arbitrary; keep it consistent betweenadd_paramsandselected_rows().
Dependency note
Only needs shinywidgets[altair] – the seattle_weather sample data comes from altair.datasets, which is bundled with altair itself, so no extra package or requirements.txt entry is needed.