Spatial explorer
Maps & geospatial
Clustered markers, a live “in view” count, and click-to-detail – a clean starting point for any point dataset.
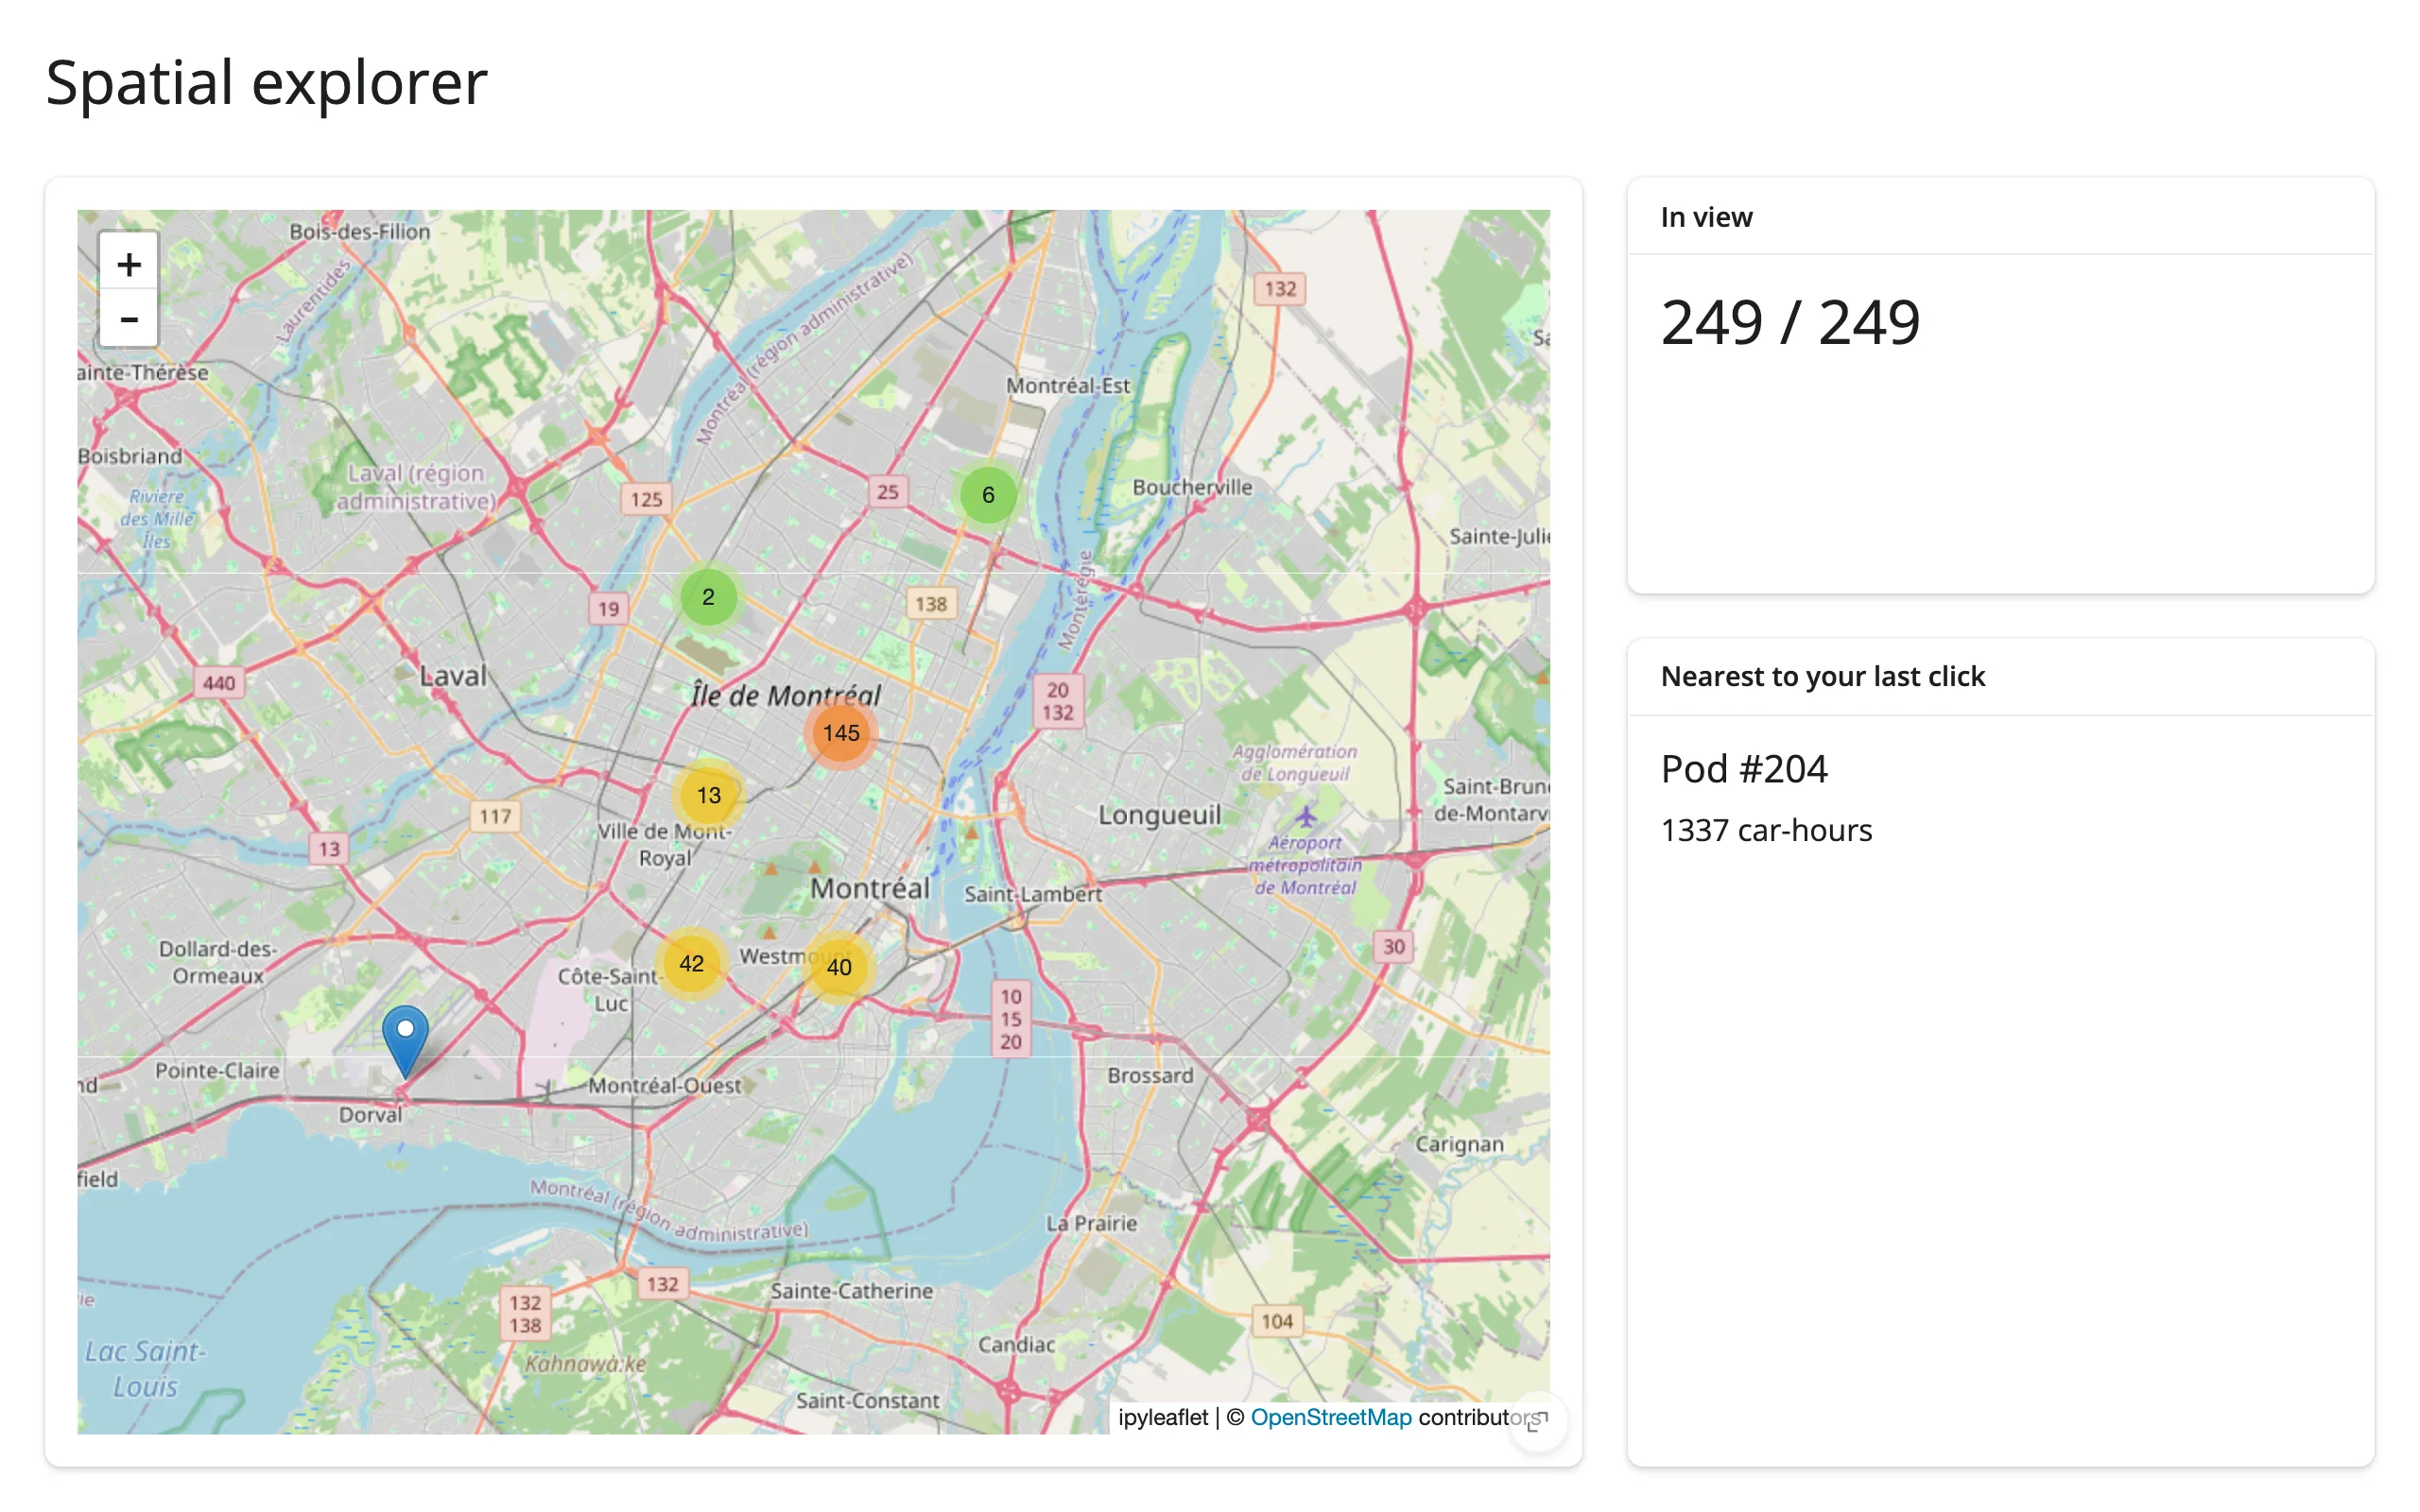
A clustered ipyleaflet marker map where panning or zooming updates a live “N in view” count computed from the map’s current bounds, and clicking anywhere on the map finds and displays the nearest point.
Run it
git clone --depth 1 https://github.com/posit-dev/py-shinywidgets
cd py-shinywidgets/website/gallery/templates/ipyleaflet-spatial-explorer
uv run shiny run app.py
Source: app.py · Open in Shinylive
Try it
- Pan or zoom the map and watch “In view” recompute against the full dataset.
- Click anywhere on the map; “Nearest to your last click” shows the closest pod and its usage.
Accessors demonstrated
map.bounds()– the current viewport as((south, west), (north, east)). Used here to filter the full dataset down to what’s visible.map.clicked()– the click-event payload, includingcoordinates.Noneuntil the first click.
What to change for your own data
- Swap
podsfor your own point DataFrame with latitude/longitude columns. - The “nearest” computation uses squared Euclidean distance in lat/lon space, which is fine at this scale; swap in a proper haversine distance for larger geographic extents.
MarkerClusteris optional – drop it for a few dozen points or fewer.