Linked scatter plots
Charts
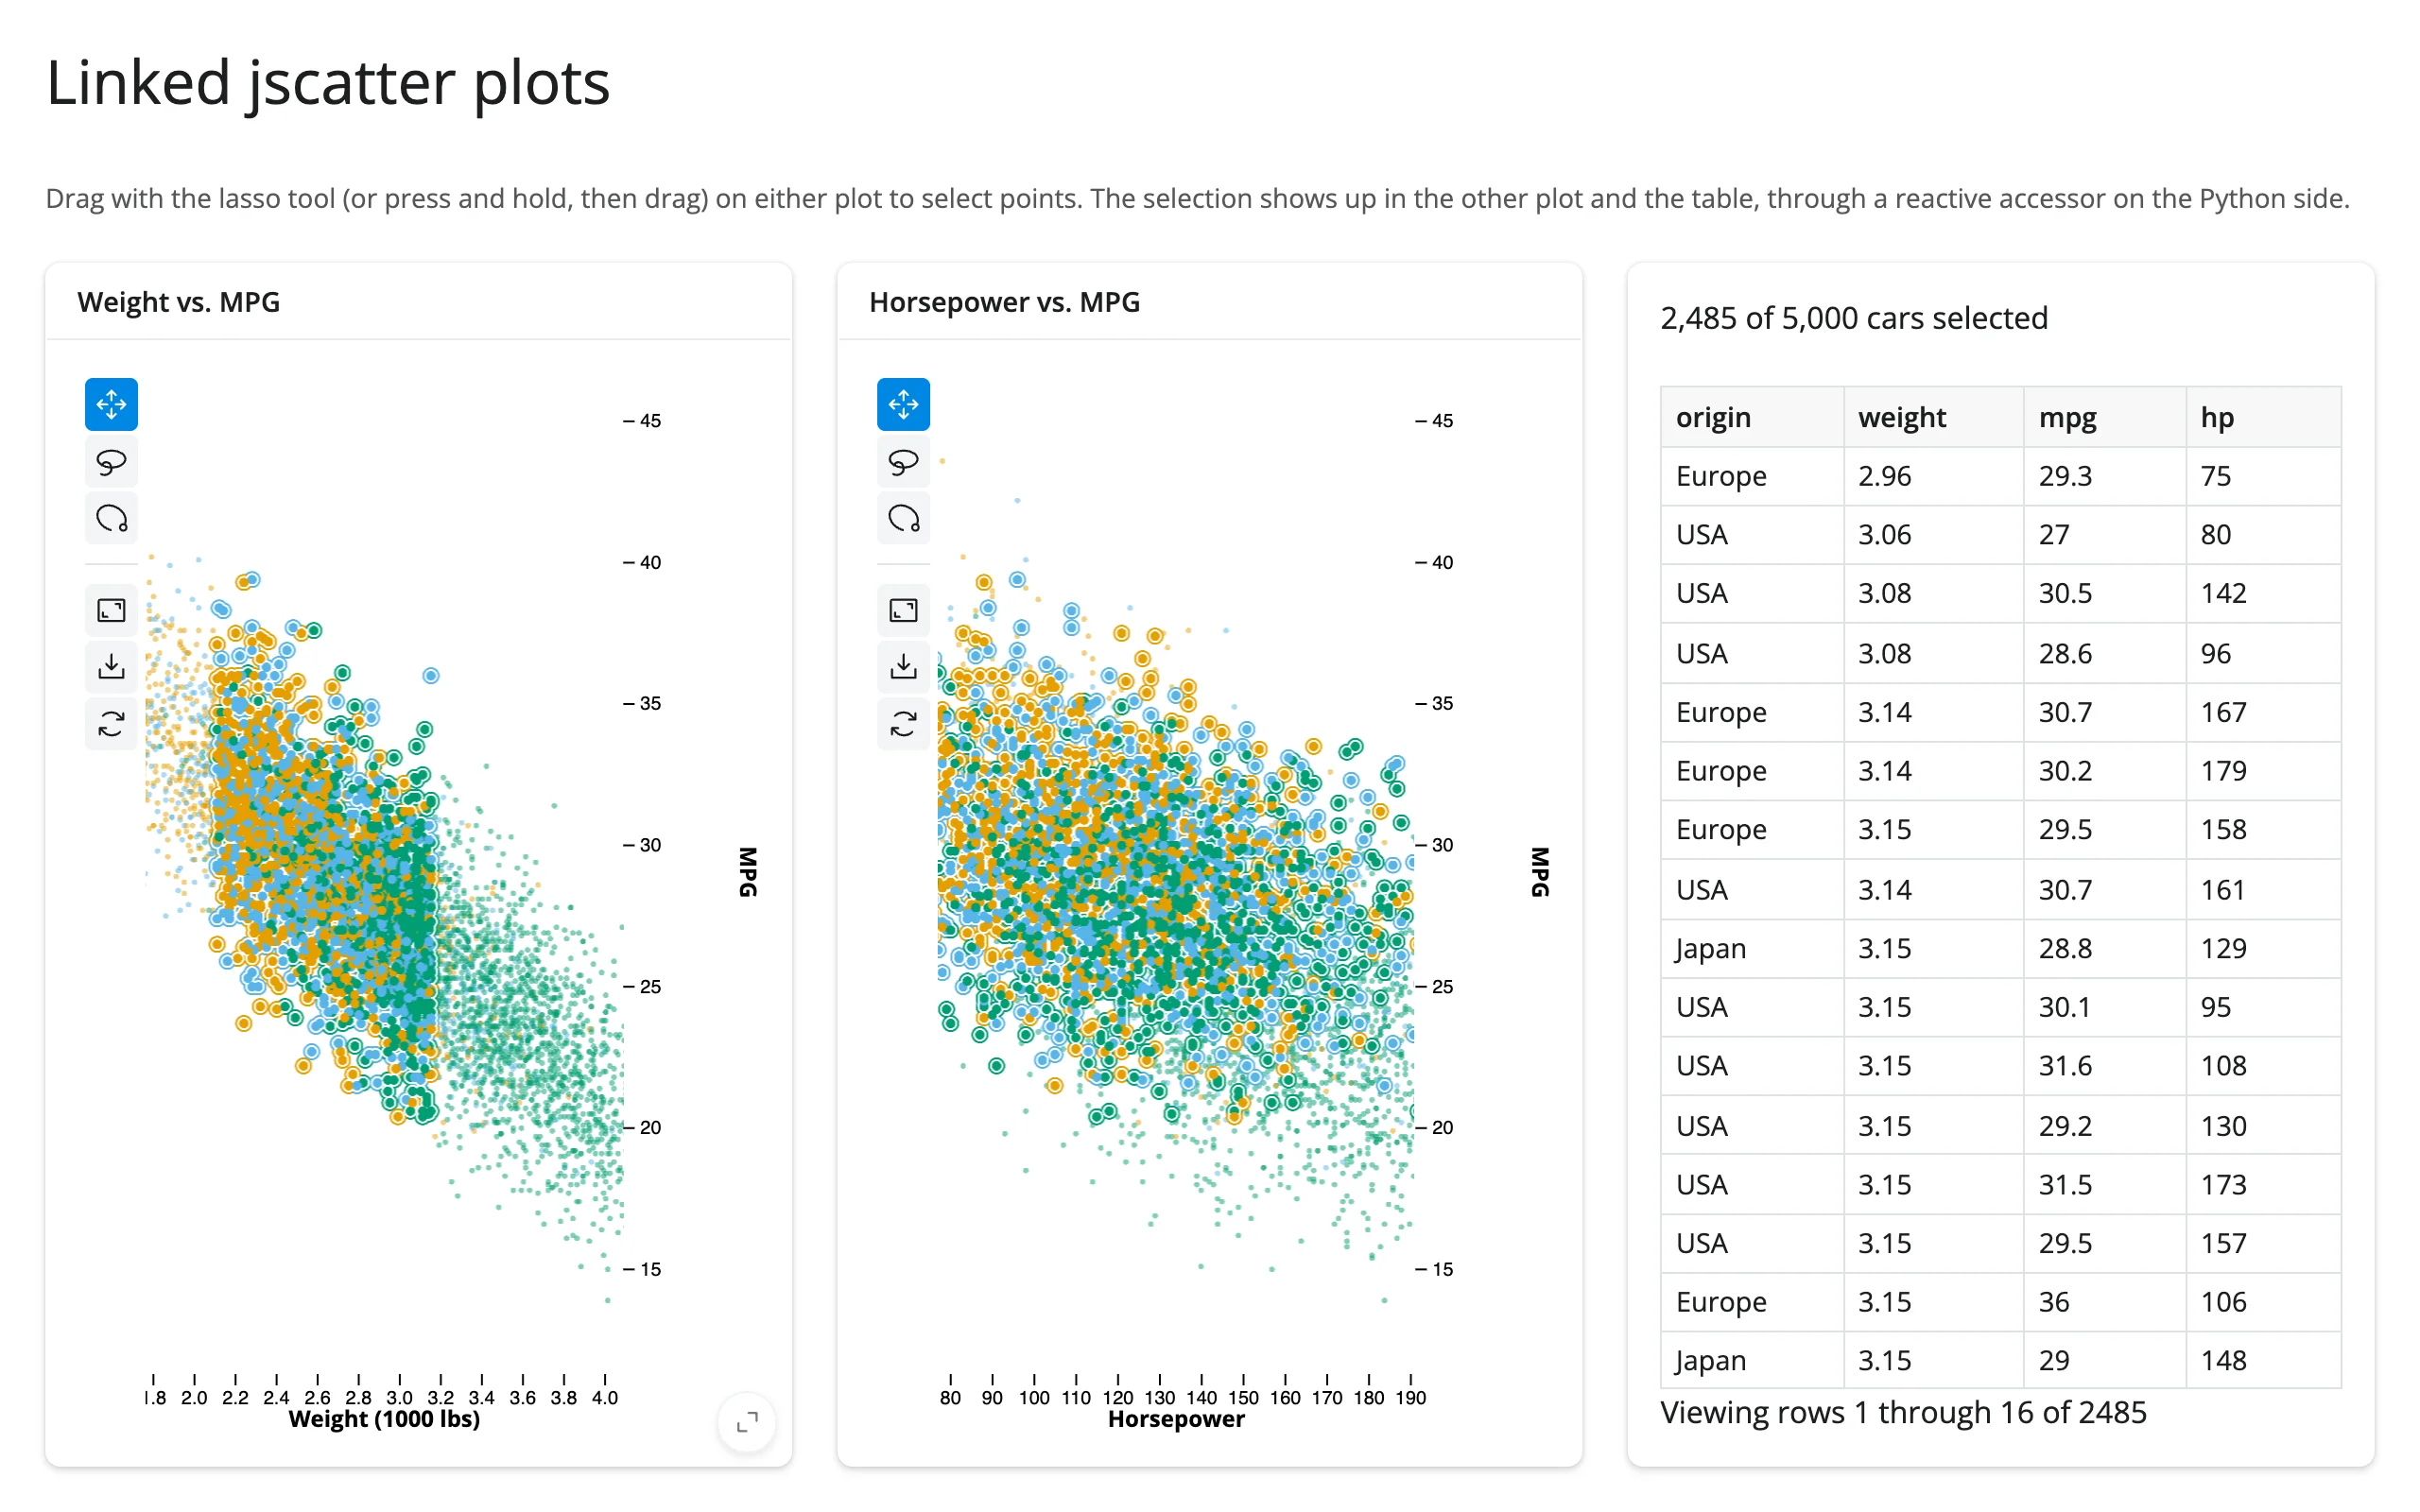
Two jupyter-scatter plots share a lasso selection, and a table shows the selected rows.
Two independent jscatter views of the same data (weight vs. MPG, horsepower vs. MPG), mirrored so that lassoing points in either one highlights the same points in the other, plus a count and a render.data_frame table of the selected rows.
Run it
git clone --depth 1 https://github.com/posit-dev/py-shinywidgets
cd py-shinywidgets/website/gallery/templates/jscatter-linked-scatter
uv run shiny run app.py
Source: app.py · Open in Shinylive
Try it
- Press and hold on one plot, then drag to lasso a region (jupyter-scatter starts its lasso on a long press, not an instant drag).
- Watch the matching points outline themselves in the other plot, and the table fill with the selected cars.
- Try lassoing in the second plot instead – the link works both ways.
Accessors demonstrated
weight_mpg.selected()/hp_mpg.selected()– the row indices of the current lasso selection, as a numpy array. Empty array when nothing is selected.
What to change for your own data
- Swap
carsfor your own DataFrame and thex/y/color_bycolumns on eachScatter. - The
link()helper is the reusable piece: it reads one plot’sselected()and writes it onto the other’s.widget.selectioninsidereactive.isolate(), guarded by an equality check to avoid a feedback loop. Apply the same helper to link any two jscatter views.
Scale note
At very large point counts (multi-million-row lasso selections), the selection payload can exceed Shiny’s websocket message size; see docs/widget-guides/jscatter/guide.md “Gotchas” for the threshold and workaround.