World city explorer
Maps & geospatial
Tables & grids
Click a city for a detail card, or drag a selection box for a filtered table – a clean starting point for a lonboard app.
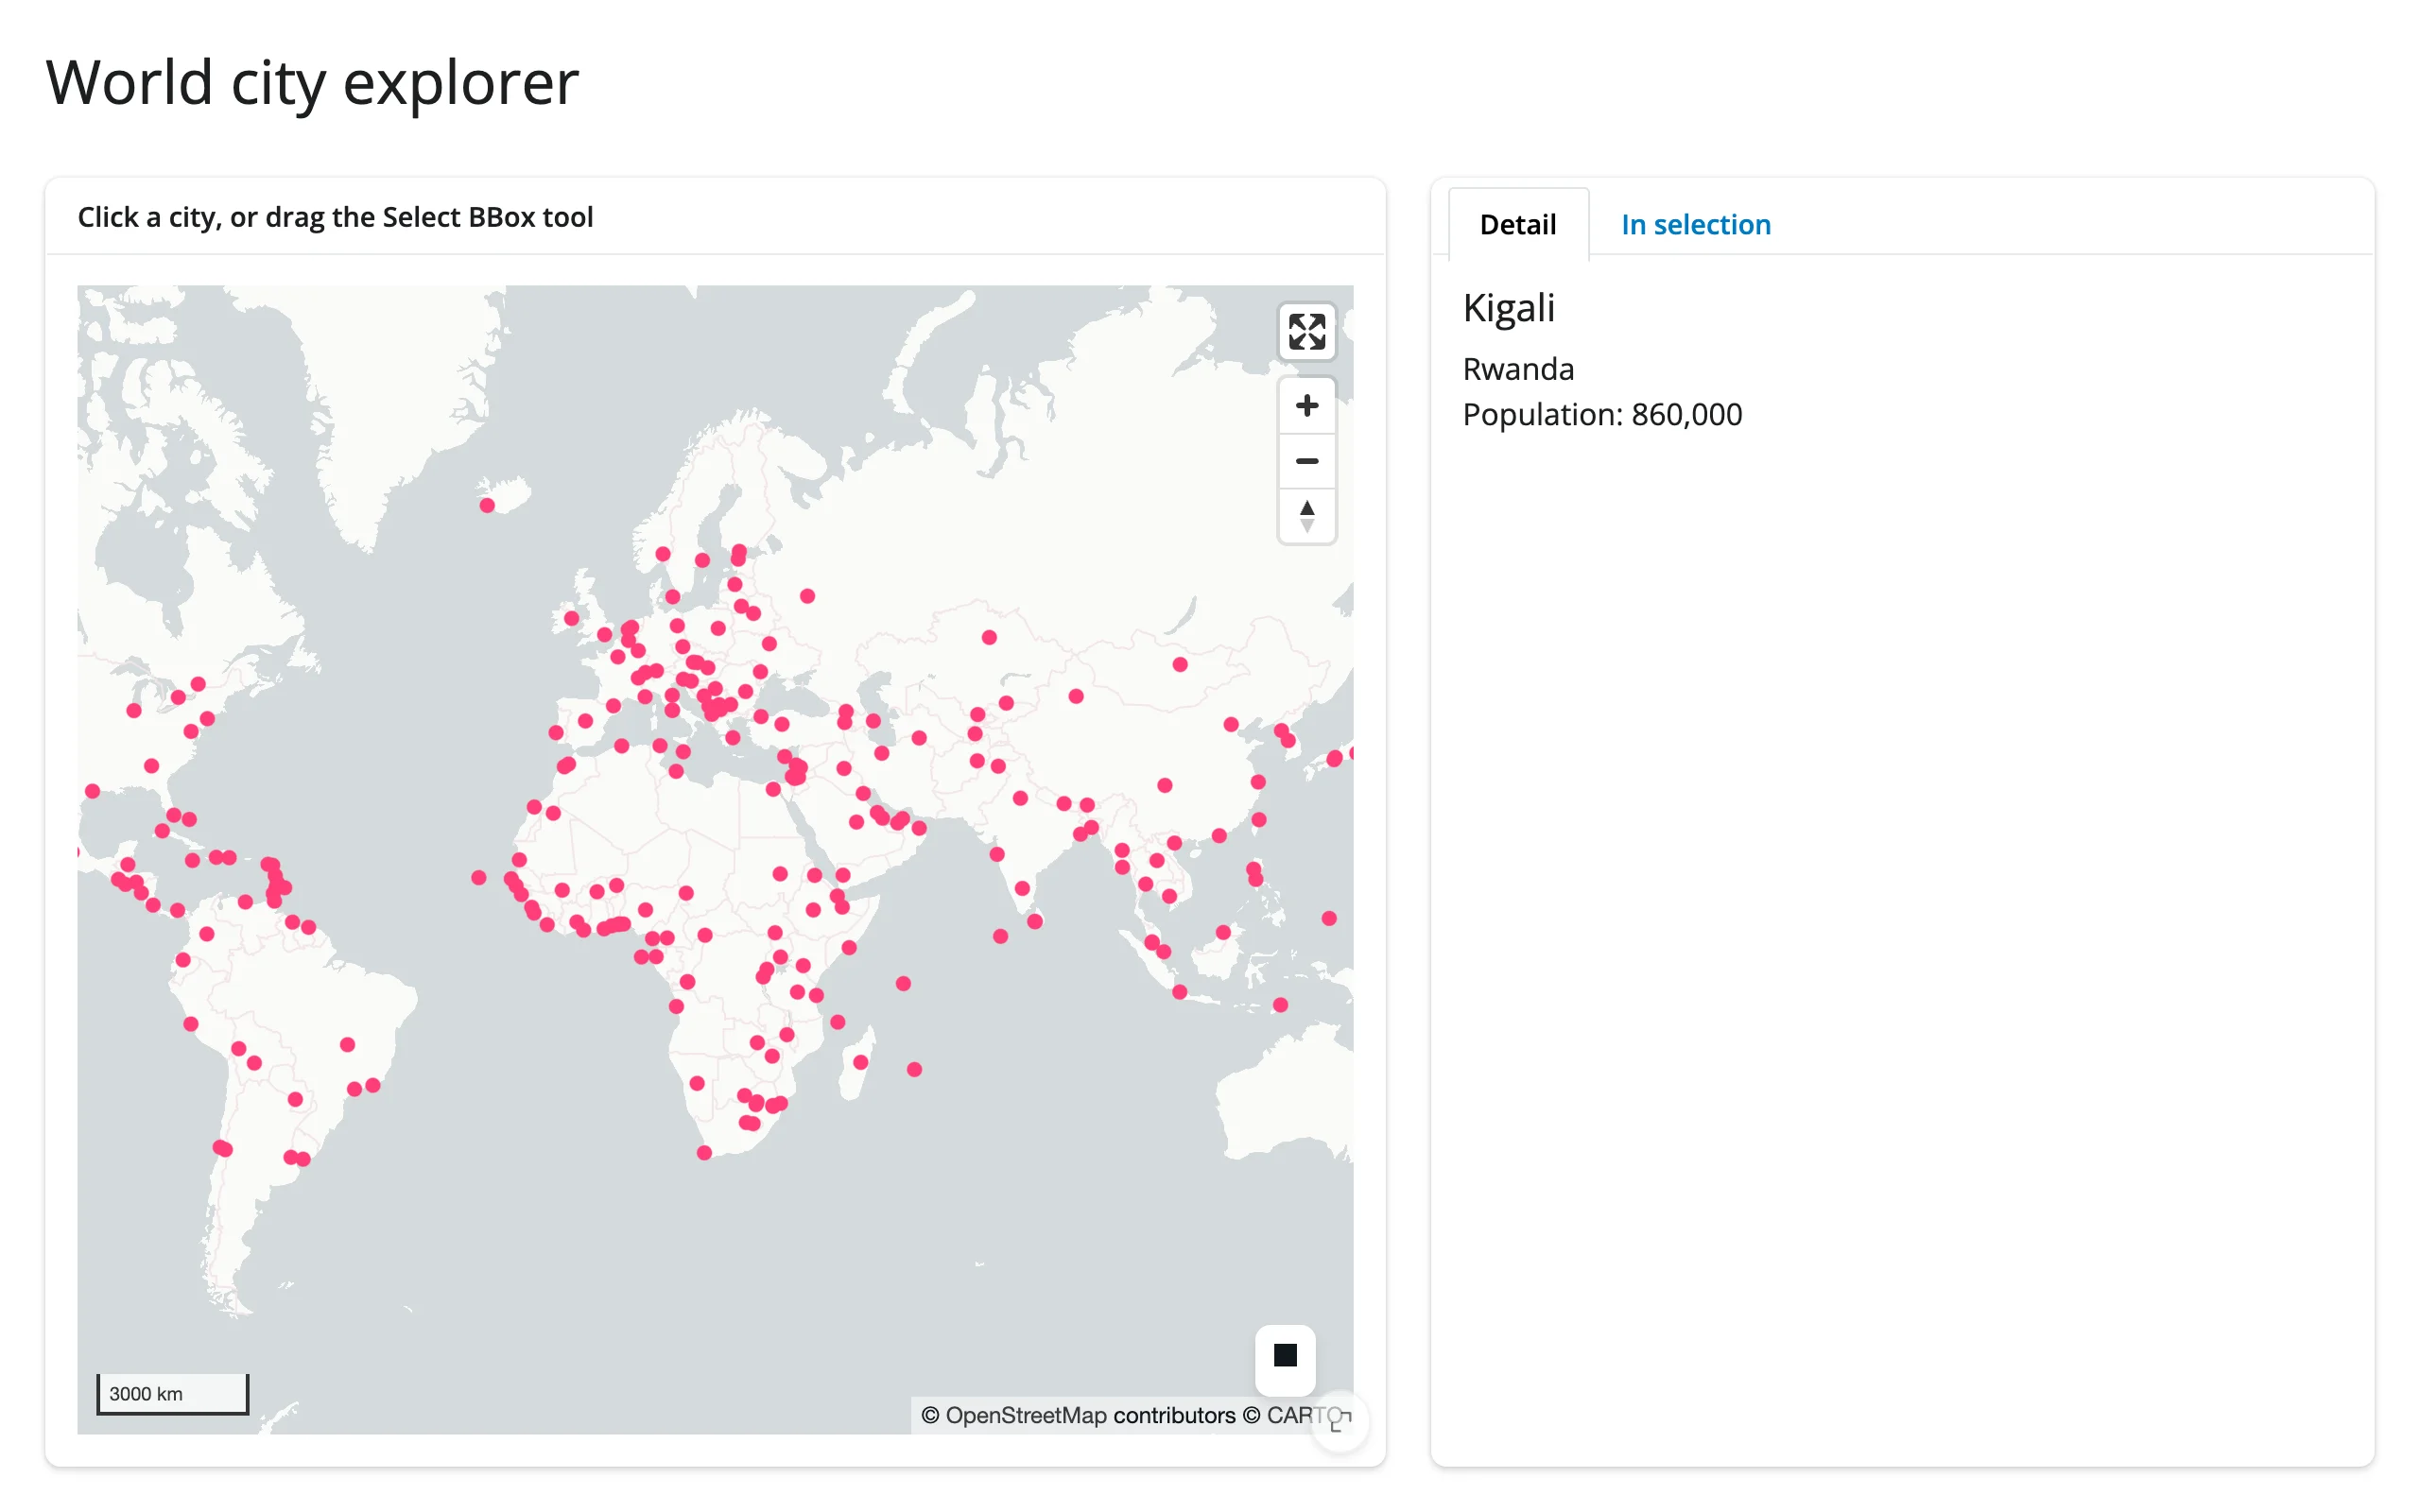
A lonboard point map over world cities, with two complementary accessors feeding two tabs: a single click resolves to a detail card, and the built-in “Select BBox” tool resolves to a filtered itables table.
Run it
git clone --depth 1 https://github.com/posit-dev/py-shinywidgets
cd py-shinywidgets/website/gallery/templates/lonboard-city-explorer
uv run shiny run app.py
Source: app.py · Open in Shinylive
Try it
- Click any city dot; the “Detail” tab shows its name, country, and population.
- Use the box-select tool (top-right of the map) to drag a rectangle; the “In selection” tab fills with every city whose coordinates fall inside it.
Accessors demonstrated
map.selected()– the row index of the last-clicked feature, orNone.map.selected_bounds()– the(minx, miny, maxx, maxy)of the last box selection, orNone.
What to change for your own data
- Replace the Natural Earth URL with your own GeoDataFrame (any point geometry works).
show_side_panel=Falseis set because the two cards below already show feature detail; drop it if you want lonboard’s built-in picking panel too.- Swap
ScatterplotLayerfor another lonboard layer type (e.g.PathLayer,PolygonLayer); onlyget_fill_color/pickable/auto_highlightneed to carry over for picking to keep working.
Network note
Fetches a small (~2 MB) public GeoJSON from a GitHub mirror at startup. Swap in a bundled or local file if you need a fully offline template.