Map viewport to chart
Charts
Maps & geospatial
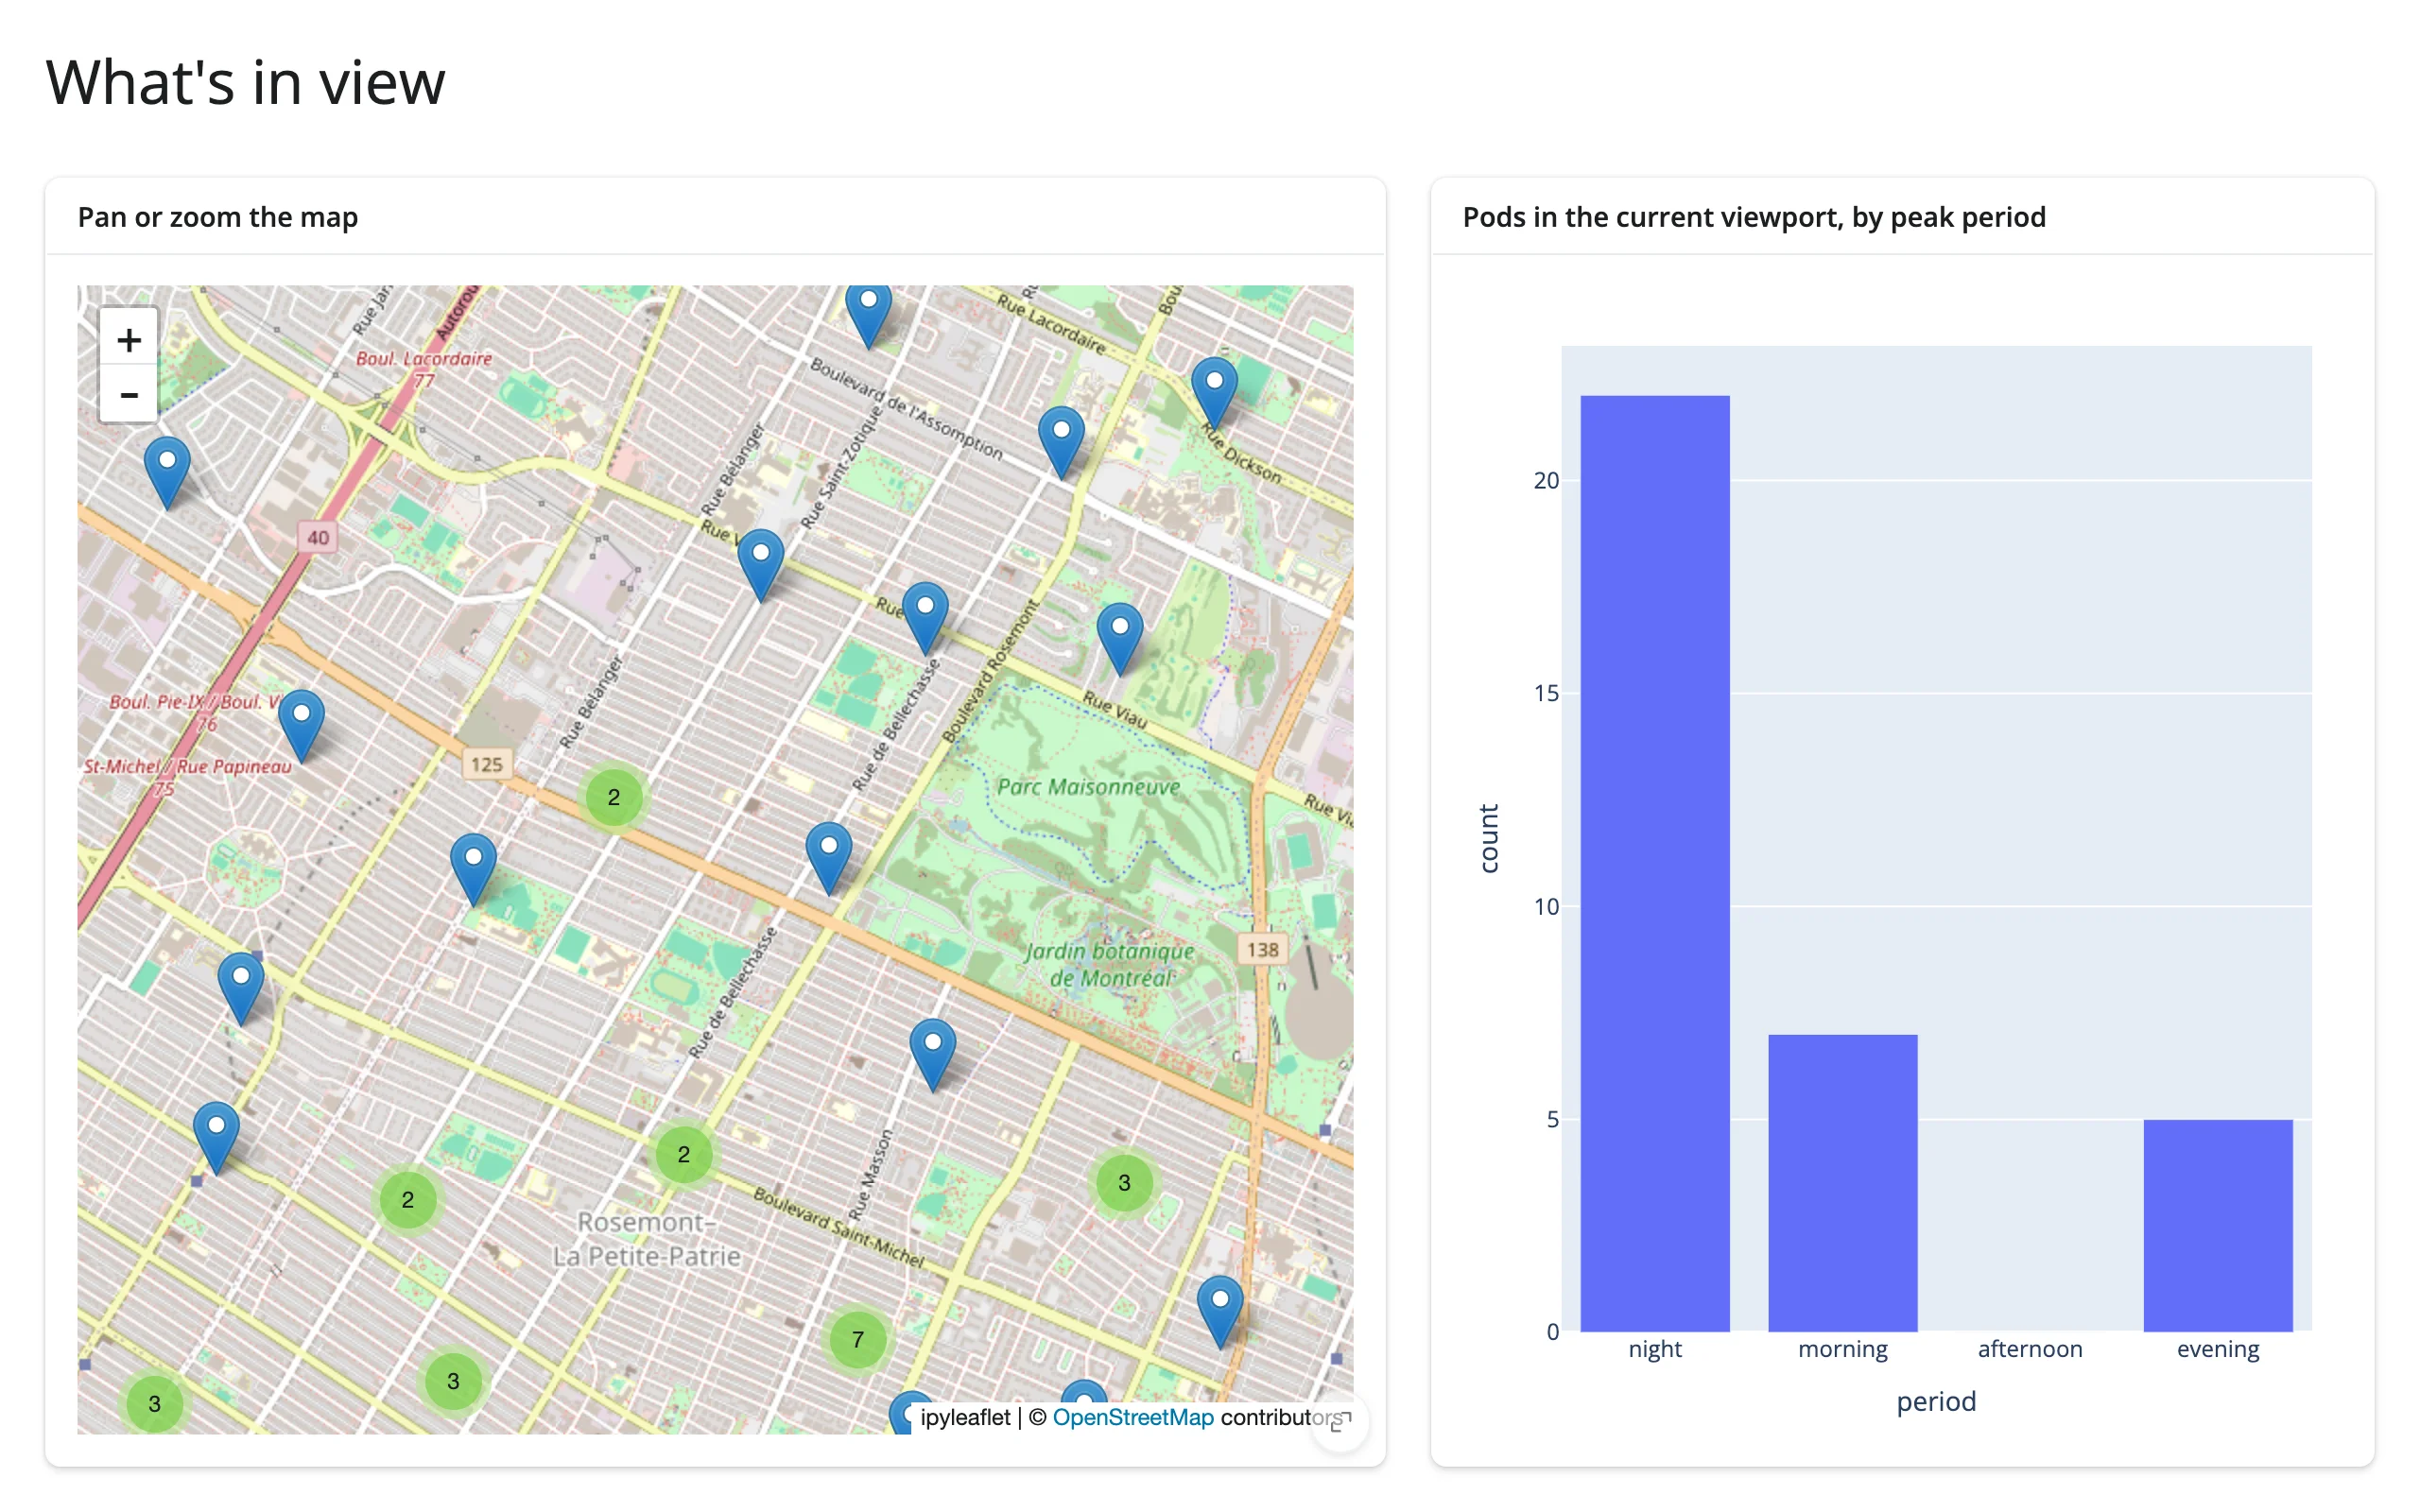
Pan or zoom the map and a bar chart recomputes from whatever is currently in view.
The “map viewport drives a chart” cross-widget pattern: an ipyleaflet map’s current bounds feed a plotly bar chart that always reflects what’s visible, recomputed from the full dataset on every pan or zoom. Two different widget libraries, one shared reactive read.
Run it
git clone --depth 1 https://github.com/posit-dev/py-shinywidgets
cd py-shinywidgets/website/gallery/templates/map-viewport-to-chart
uv run shiny run app.py
Source: app.py · Open in Shinylive
Try it
- Pan the map, or zoom in on a cluster.
- Watch the bar chart on the right recompute the peak-period breakdown for only the pods currently in view.
Accessors demonstrated
map.bounds()– the current viewport as((south, west), (north, east)). The chart filters the fullpodsDataFrame against these bounds on every render.
What to change for your own data
- Swap
podsfor your own point DataFrame; replace"period"with whatever categorical (or binned numeric) breakdown you want charted. - This same shape works for any map-widget-with-a-bounds-accessor paired with any chart library – see
docs/widget-guides/articles/linked-views/article.mdfor the lonboard and maplibre variants.
Credit
Promoted from docs/widget-guides/articles/linked-views/examples/06_ipyleaflet_bounds_to_plotly.py (the cross-cutting linked-views article), with full_screen=True cards and a comment header added for gallery consistency.