Lasso explorer
Charts
Tables & grids
Lasso points in a plotly scatter plot and see the matching rows in a searchable table and a one-line summary, with click-through detail.
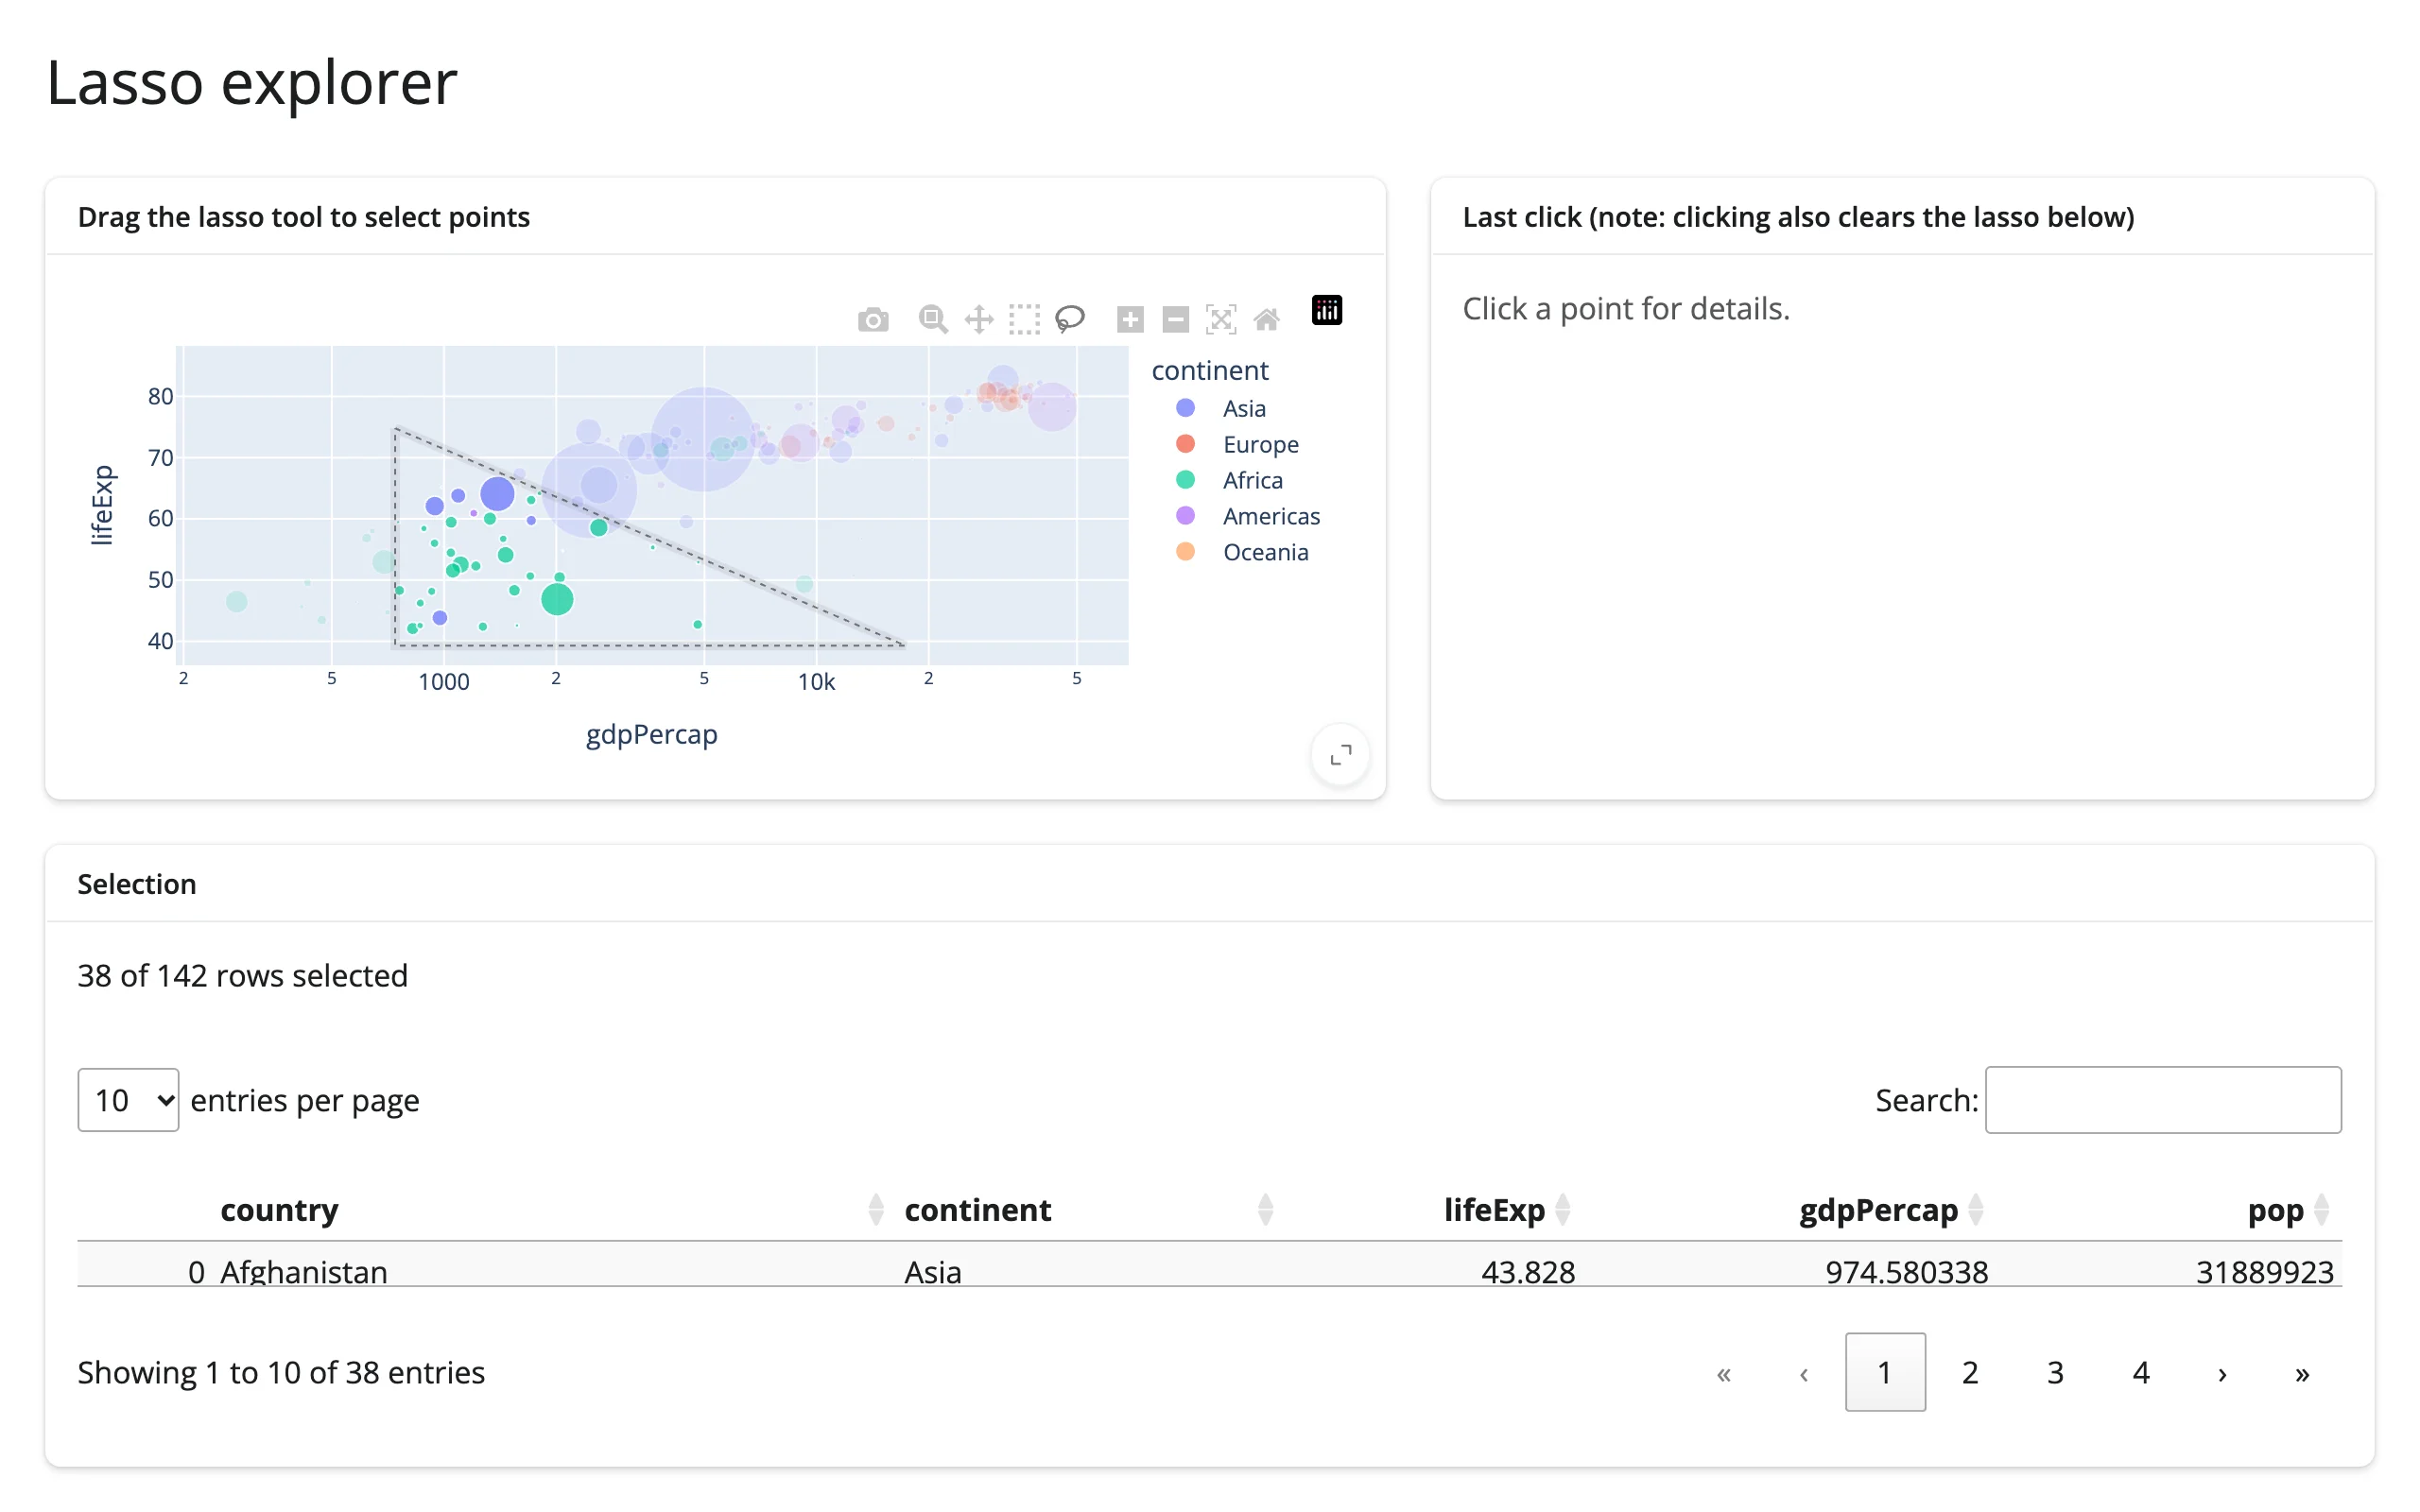
A scatter plot where lassoing a region of points drives a one-line summary and a searchable, sortable itables table of just the selected rows, plus a click-through detail card for a single point. This is the most common “explore my data frame visually” shape: one visual view, one tabular view, kept in sync by a reactive accessor.
Run it
git clone --depth 1 https://github.com/posit-dev/py-shinywidgets
cd py-shinywidgets/website/gallery/templates/plotly-lasso-explorer
uv run shiny run app.py
Source: app.py · Open in Shinylive
Try it
- Drag the lasso tool over a cluster of points (dragmode is already set to
"lasso"). - Watch the summary text and the table below update to the selected rows.
- Click a single point for its country/continent/life-expectancy detail card. Note that a plain click also clears the lasso selection (both gestures share the same plotly event machinery).
Accessors demonstrated
plot.selected_rows(df)– returns the rows ofdfmatching the current lasso selection, as a DataFrame. Empty when nothing is selected.plot.clicked()– the plotly click-event payload for the last clicked point, orNone.
What to change for your own data
- Swap
dffor your own DataFrame; keep acustom_data=[df.index]column on the trace soclicked()can map back to a row. - Change
x,y,color,sizeto your own columns. - Change the
colslist intable()to the columns you want visible in the table.