Your first widget app
This builds one small app in three steps: render a chart, react to what the user selects, then update the chart in place. Each step is a complete, runnable app that adds one idea to the previous one. All three use the same data: plotly.express.data.gapminder(), filtered to the year 2007 (141 countries’ GDP per capita and life expectancy – it ships with plotly, no download needed).
To follow along, install shinywidgets with plotly (pip install 'shinywidgets[plotly]'), save an example as app.py, and run it with shiny run app.py.
1. Render a widget
In a Shiny app, a function with a render decorator is an output: Shiny calls it and shows what it returns, where the function appears in the file. @render_plotly is one of those, for a function that returns a plotly figure. (ui.page_opts() sets the page title, and fillable=True lets the chart fill the window.) Setting dragmode="lasso" makes the lasso tool active by default (without it, the user would have to pick it from the plot’s modebar first), and custom_data=[df.index] tags every point with its row in df, which the next step needs to turn a selection back into rows of data:
import plotly.express as px
from shiny.express import ui
from shinywidgets import render_plotly

df = px.data.gapminder().query("year == 2007").reset_index(drop=True)

ui.page_opts(title="Gapminder 2007", fillable=True)


@render_plotly
def plot():
    fig = px.scatter(
        df,
        x="gdpPercap",
        y="lifeExp",
        size="pop",
        color="continent",
        size_max=48,
        hover_name="country",
        custom_data=[df.index],
        log_x=True,
        template="plotly_white",
    )
    fig.update_traces(marker=dict(opacity=0.85, line=dict(width=0)))
    fig.update_layout(dragmode="lasso", legend_title_text="")
    return fig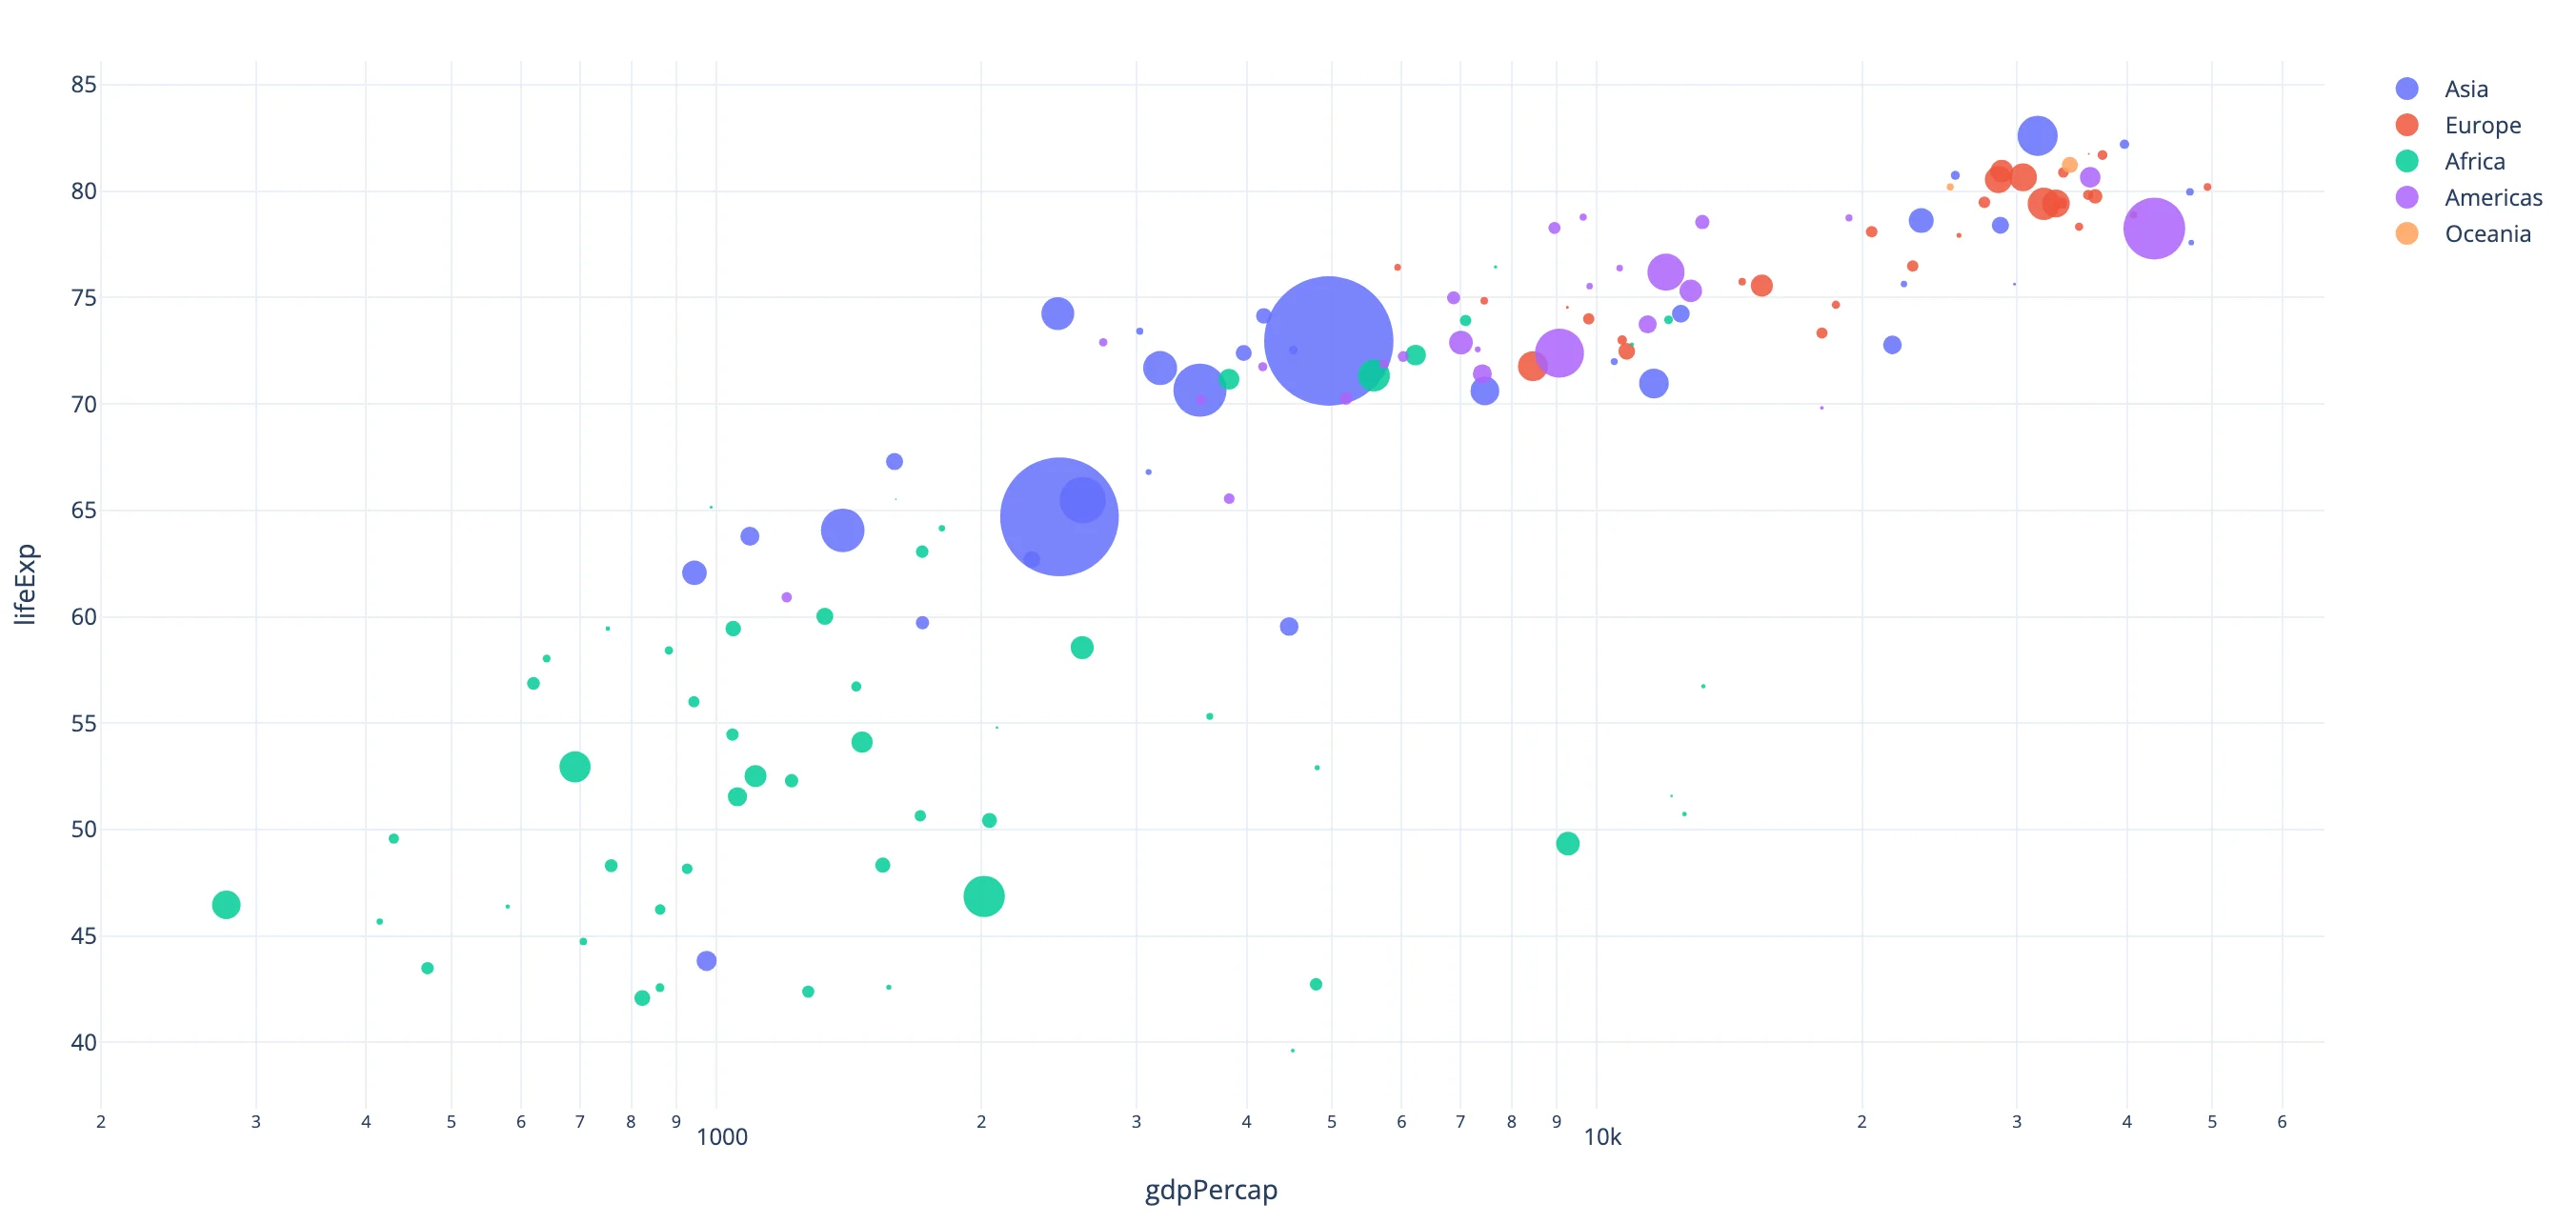
That’s a complete app: one bubble per country, sized by population and colored by continent. Nothing reads the user’s interaction yet – that’s the next step.
2. React to the user
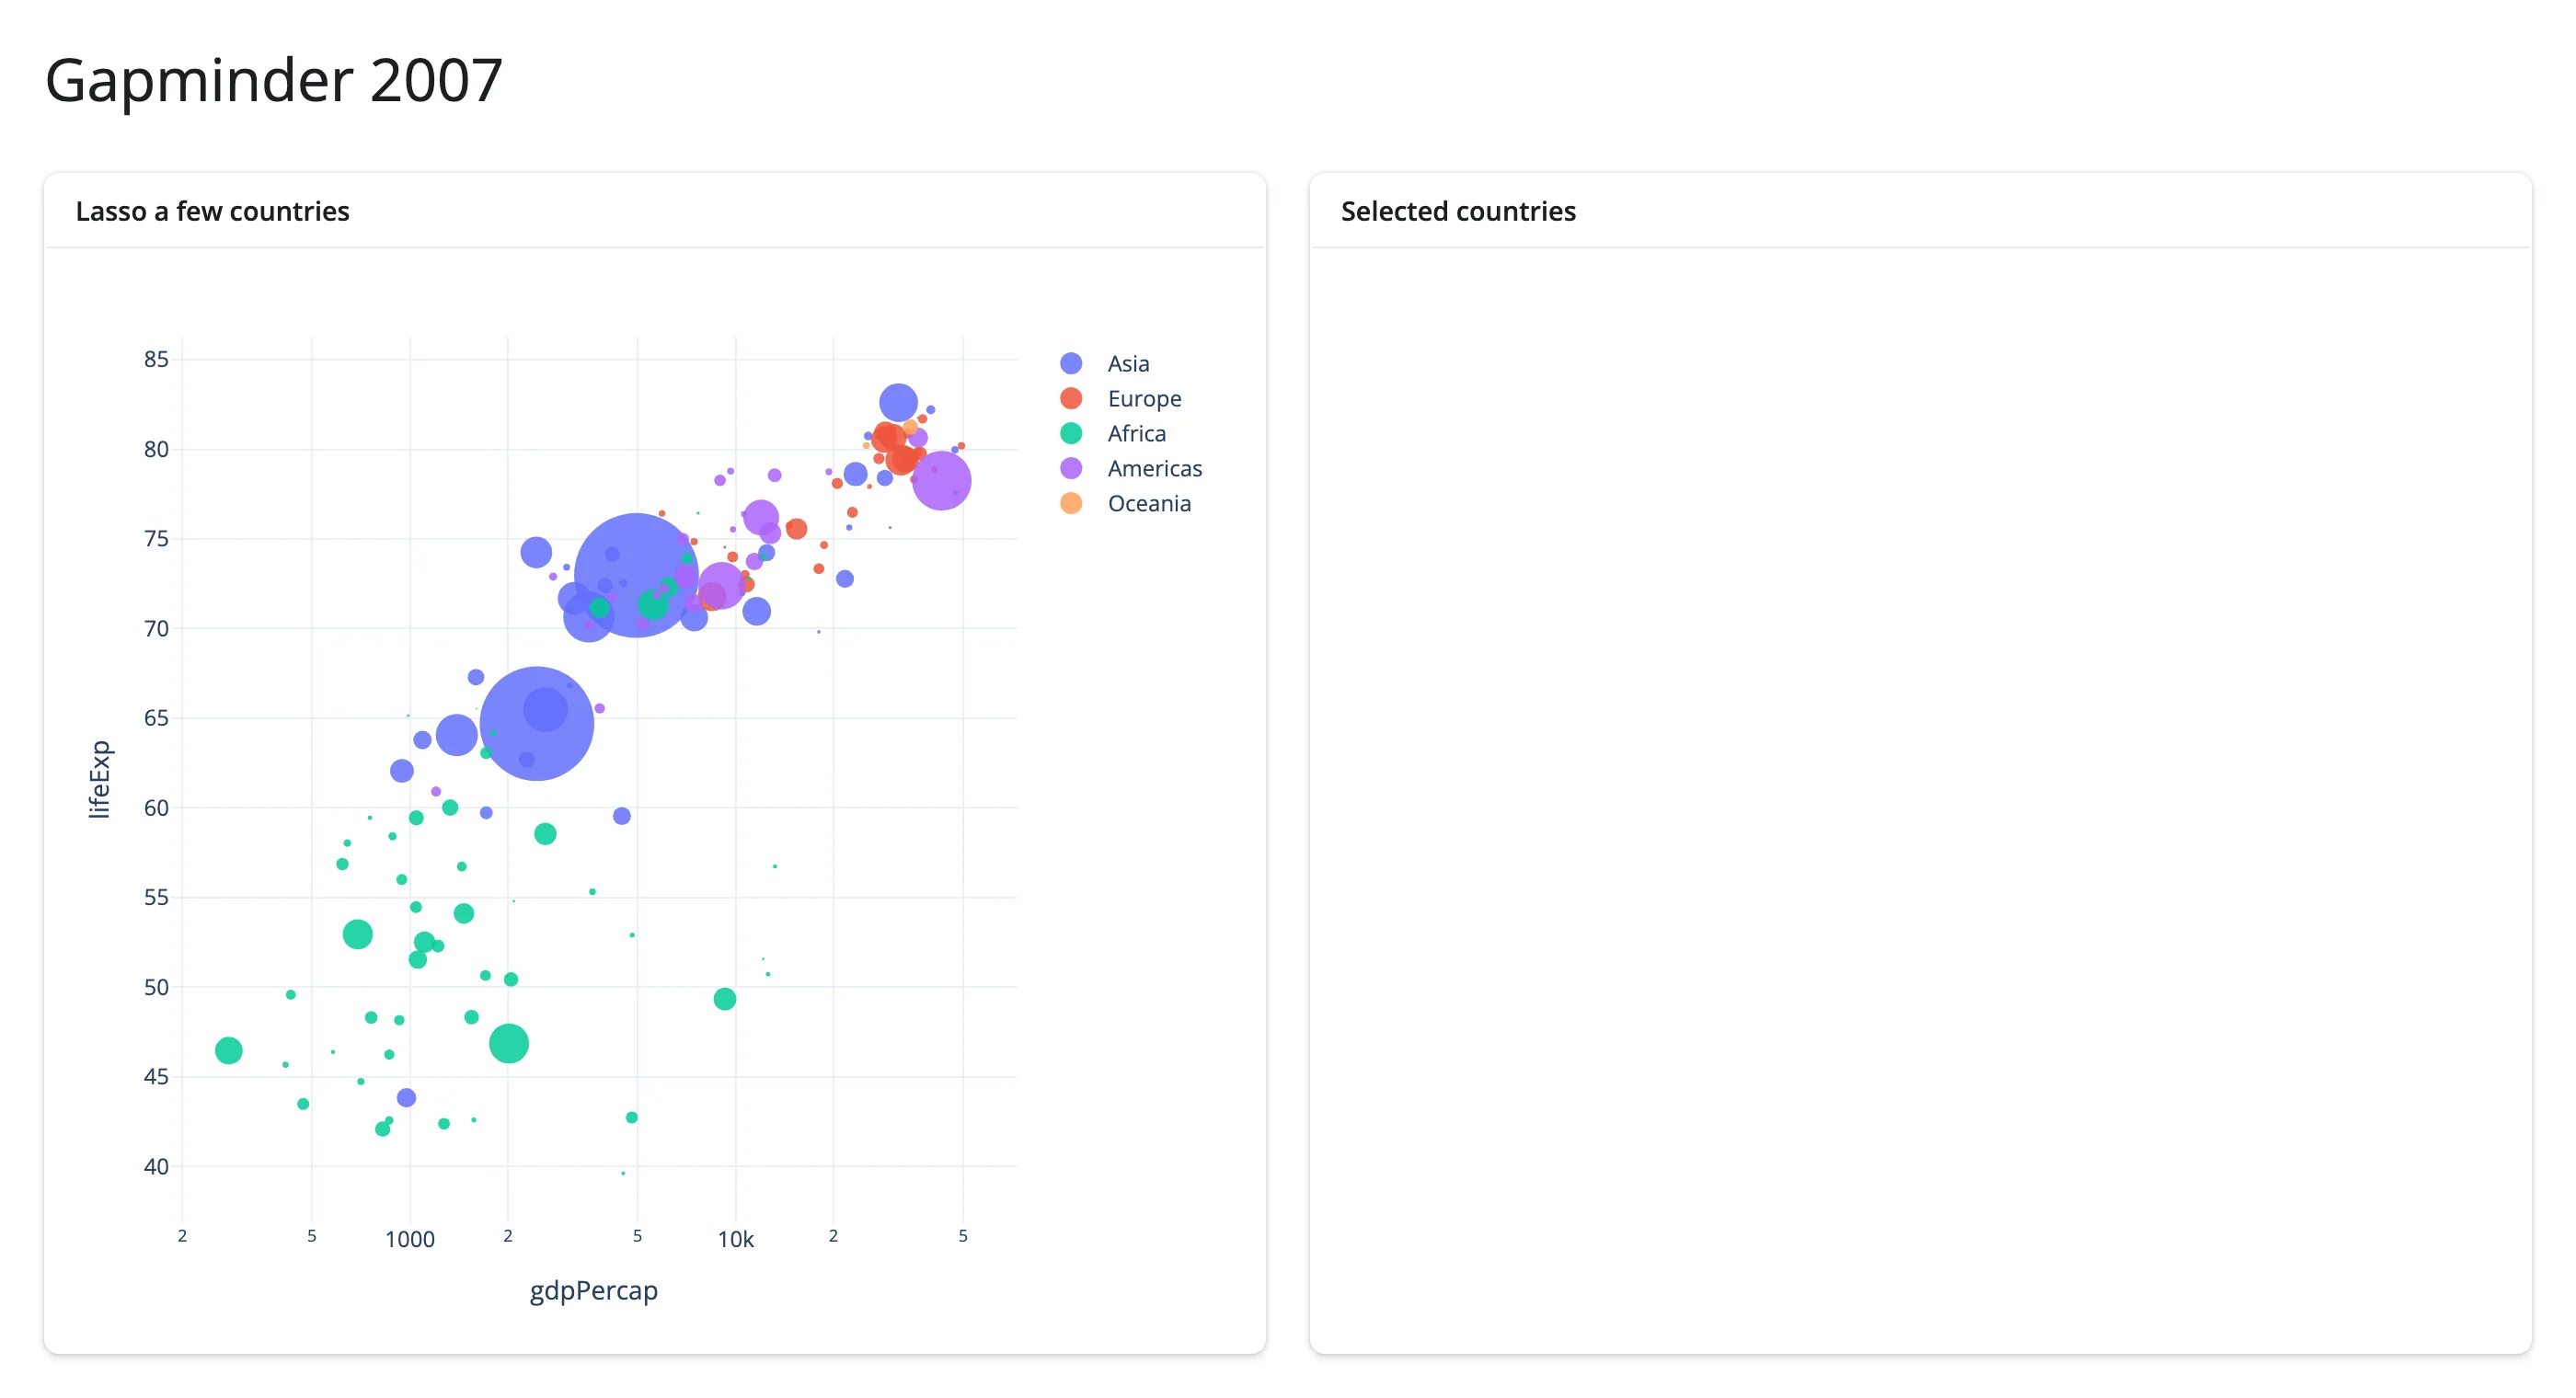
plot.selected_rows(df) is a reactive accessor: it returns the rows of df whose points are inside the most recent lasso, matched up via the custom_data set in step 1. A second output, @render.data_frame, calls it, and because it does, Shiny reruns it every time the selection changes. The accessor returns an empty data frame until the user selects something, so req(not rows.empty) holds the table back until there’s a real selection to show. The with ui.layout_columns() and with ui.card() blocks arrange the page: outputs inside a with block go inside that column or card.
import plotly.express as px
from shiny import req
from shiny.express import render, ui
from shinywidgets import render_plotly

df = px.data.gapminder().query("year == 2007").reset_index(drop=True)

ui.page_opts(title="Gapminder 2007", fillable=True)

with ui.layout_columns():
    with ui.card(full_screen=True):
        ui.card_header("Lasso a few countries")

        @render_plotly
        def plot():
            fig = px.scatter(
                df,
                x="gdpPercap",
                y="lifeExp",
                size="pop",
                color="continent",
                size_max=48,
                hover_name="country",
                custom_data=[df.index],
                log_x=True,
                template="plotly_white",
            )
            fig.update_traces(marker=dict(opacity=0.85, line=dict(width=0)))
            fig.update_layout(dragmode="lasso", legend_title_text="")
            return fig

    with ui.card(full_screen=True):
        ui.card_header("Selected countries")

        @render.data_frame
        def selected_countries():
            rows = plot.selected_rows(df)
            req(not rows.empty)
            return rows[["country", "continent", "gdpPercap", "lifeExp", "pop"]]
Before any selection, the table card is empty. Lasso the rich, high-life-expectancy cluster in the upper-right and it fills in:
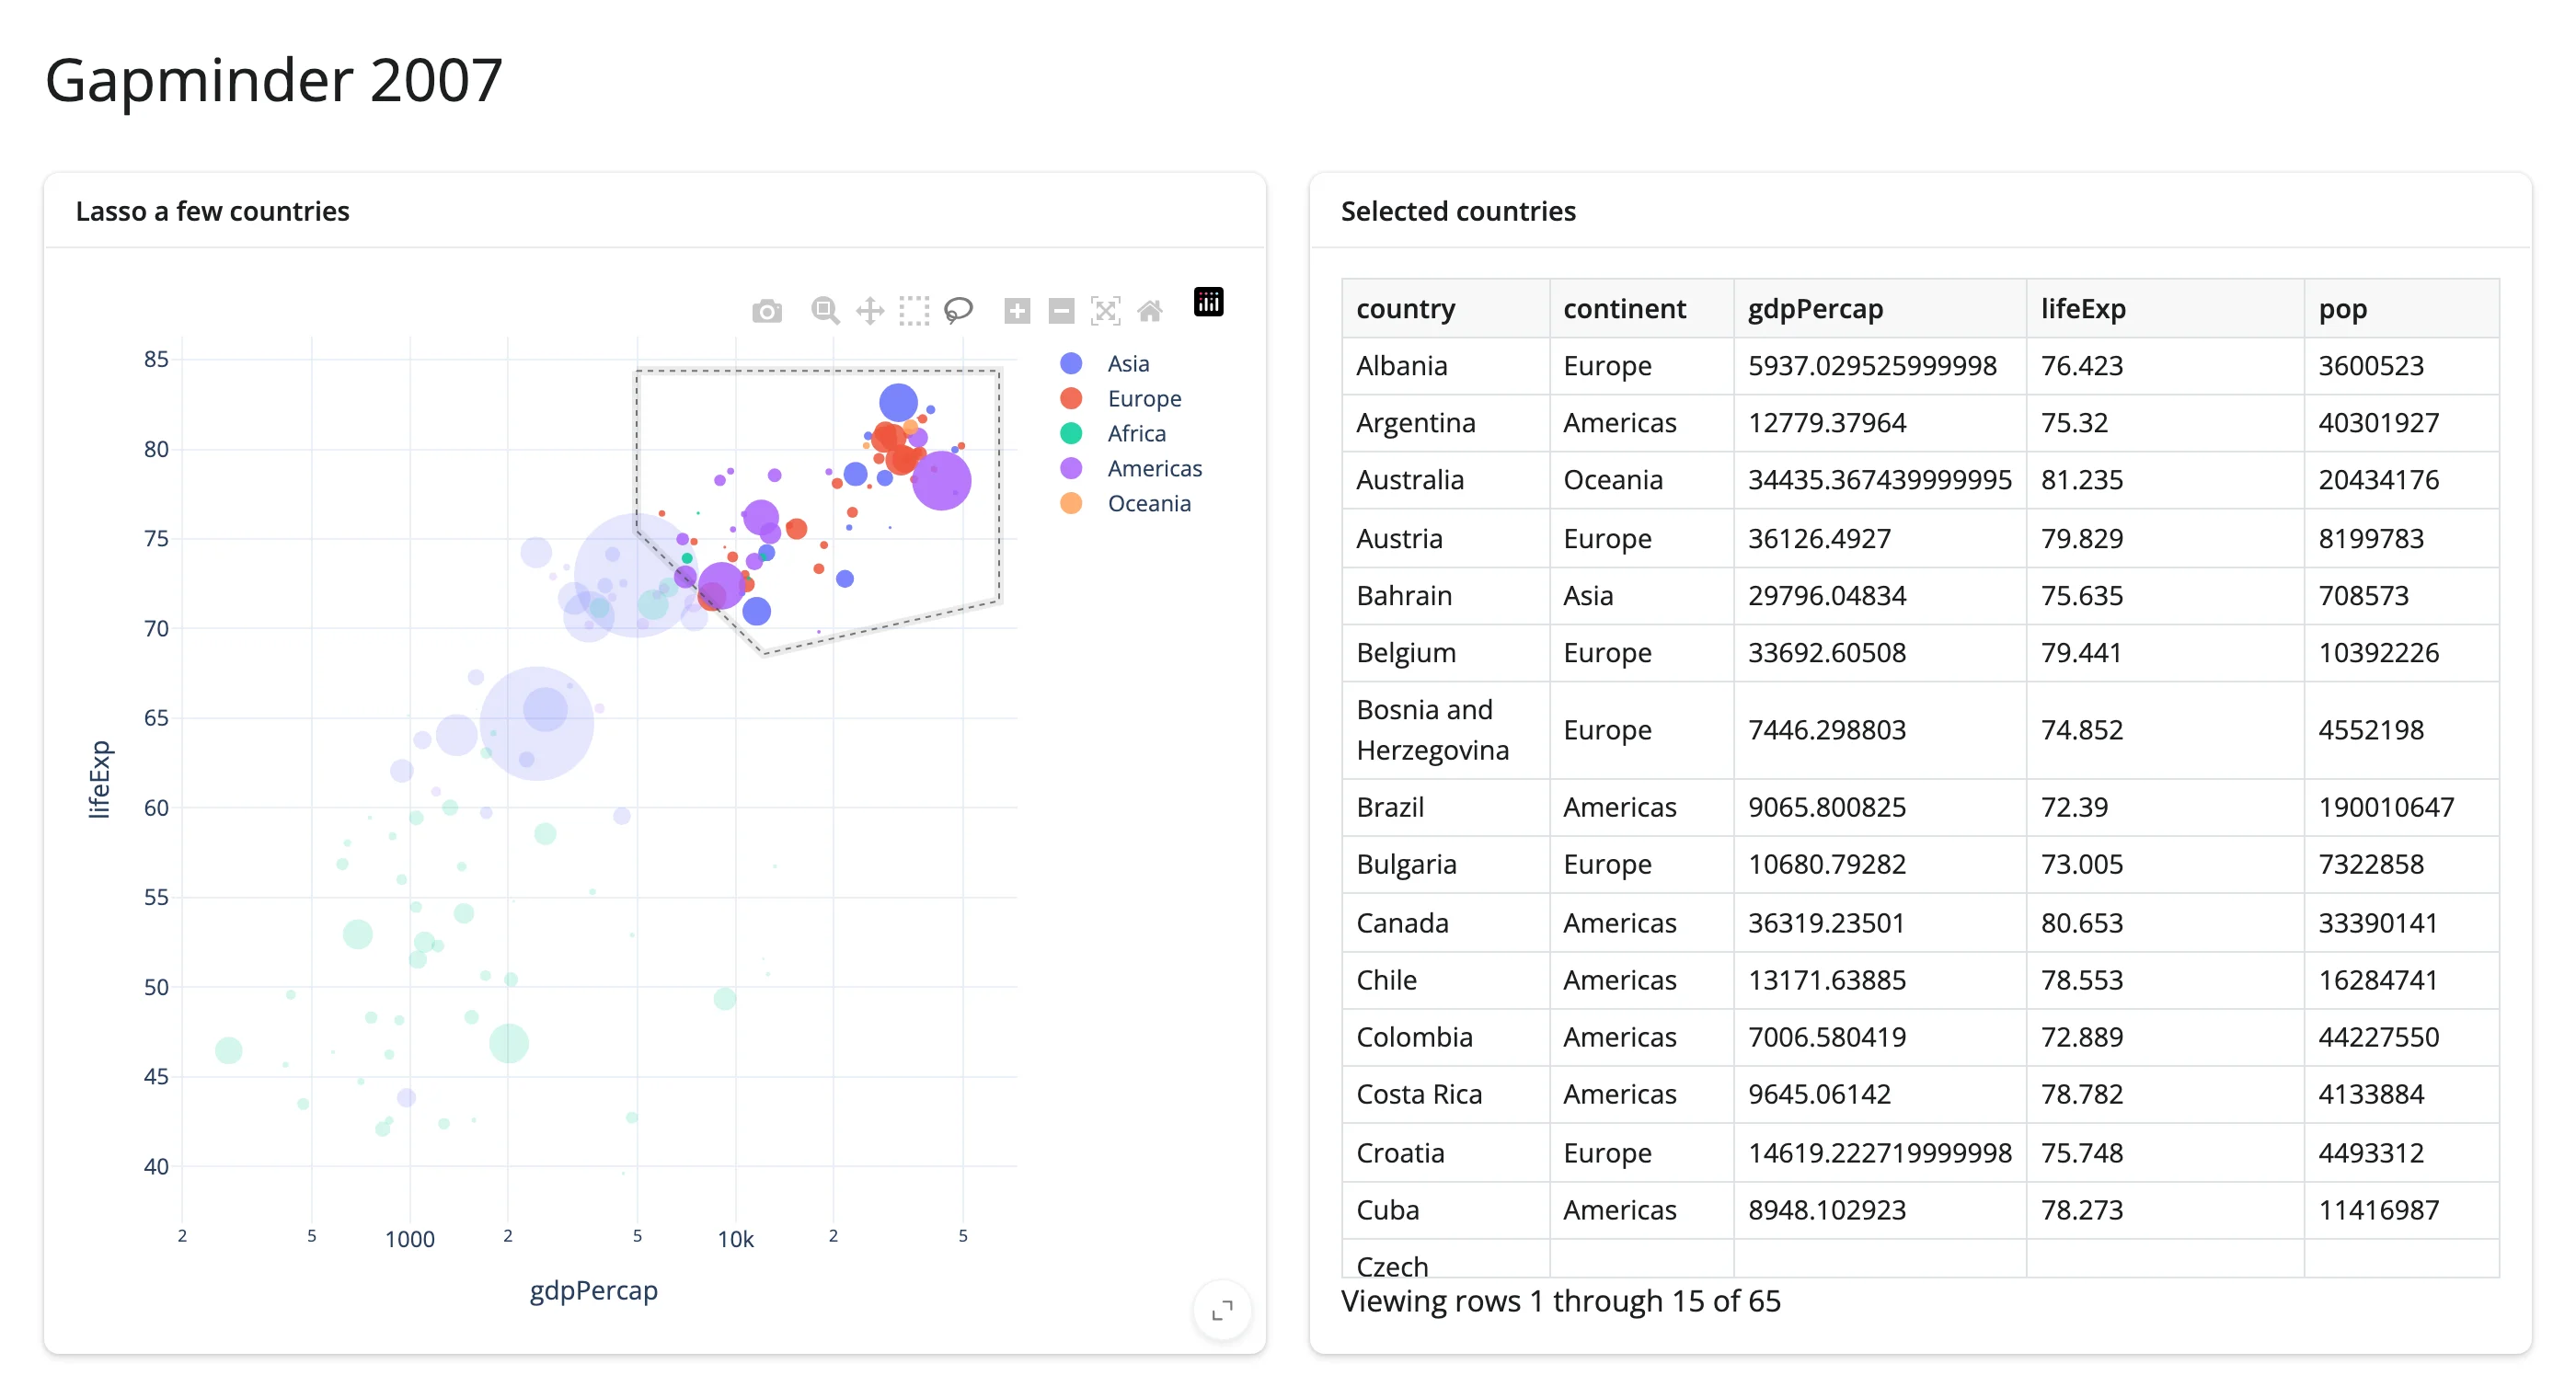
plot.selected_rows() is one of eleven accessors on @render_plotly – clicked(), hover(), relayout() (pan/zoom), and more. Reacting to widgets covers what they all have in common: what they return before the first interaction, what survives a re-render, and how to rate-limit a noisy one.
3. Update it in place
Nothing so far changes the plot itself from Python. This step adds a @reactive.effect, which reruns like an output when what it reads changes, but displays nothing; it’s for side effects. This one writes a summary of the lassoed countries onto the existing figure, as an annotation – plot.widget is the live FigureWidget, and setting plot.widget.layout.annotations pushes the change to the browser without rebuilding the chart:
import plotly.express as px
from shiny import reactive, req
from shiny.express import render, ui
from shinywidgets import render_plotly

df = px.data.gapminder().query("year == 2007").reset_index(drop=True)

ui.page_opts(title="Gapminder 2007", fillable=True)

with ui.layout_columns():
    with ui.card(full_screen=True):
        ui.card_header("Lasso a few countries")

        @render_plotly
        def plot():
            fig = px.scatter(
                df,
                x="gdpPercap",
                y="lifeExp",
                size="pop",
                color="continent",
                size_max=48,
                hover_name="country",
                custom_data=[df.index],
                log_x=True,
                template="plotly_white",
            )
            fig.update_traces(marker=dict(opacity=0.85, line=dict(width=0)))
            fig.update_layout(dragmode="lasso", legend_title_text="")
            return fig

    with ui.card(full_screen=True):
        ui.card_header("Selected countries")

        @render.data_frame
        def selected_countries():
            rows = plot.selected_rows(df)
            req(not rows.empty)
            return rows[["country", "continent", "gdpPercap", "lifeExp", "pop"]]


# Summarize the lassoed countries directly on the existing figure, as an
# annotation, without rebuilding the plot: a re-render would clear the lasso
# itself and reset any zoom the user made first. No `reactive.isolate()`
# around the write below: restyling `plot.widget` doesn't feed back into
# `selected_rows()`, which only updates from the browser's own selection
# events. See "Writing back" in the Updating in place guide for the pattern
# where isolate() IS required (an effect that reads and writes the SAME reactive
# state).
@reactive.effect
def _summarize():
    rows = plot.selected_rows(df)
    note = (
        f"<b>{len(rows)} countries</b><br>"
        f"avg life expectancy {rows.lifeExp.mean():.1f} yrs<br>"
        f"{rows['pop'].sum() / 1e9:.1f}B people"
        if len(rows)
        else ""
    )
    plot.widget.layout.annotations = [
        dict(
            text=note,
            xref="paper", yref="paper", x=0.02, y=0.98,
            xanchor="left", yanchor="top", align="left",
            showarrow=False, font=dict(size=15, color="#111"),
            bgcolor="rgba(255,255,255,0.92)", bordercolor="#111",
            borderwidth=1.5, borderpad=10,
        )
    ] if note else []
Even though color="continent" now splits the figure into one trace per continent, plot.selected_rows(df) still works: it matches each selected point back to a row of df by the custom_data=[df.index] value carried on that point, not by which trace it came from.
Zoomed in with the plot’s modebar, then lassoed again – the zoom is still in place, because the effect only sets plot.widget.layout.annotations; the render function that built the figure (and would reset the zoom if it re-ran) never executes again:
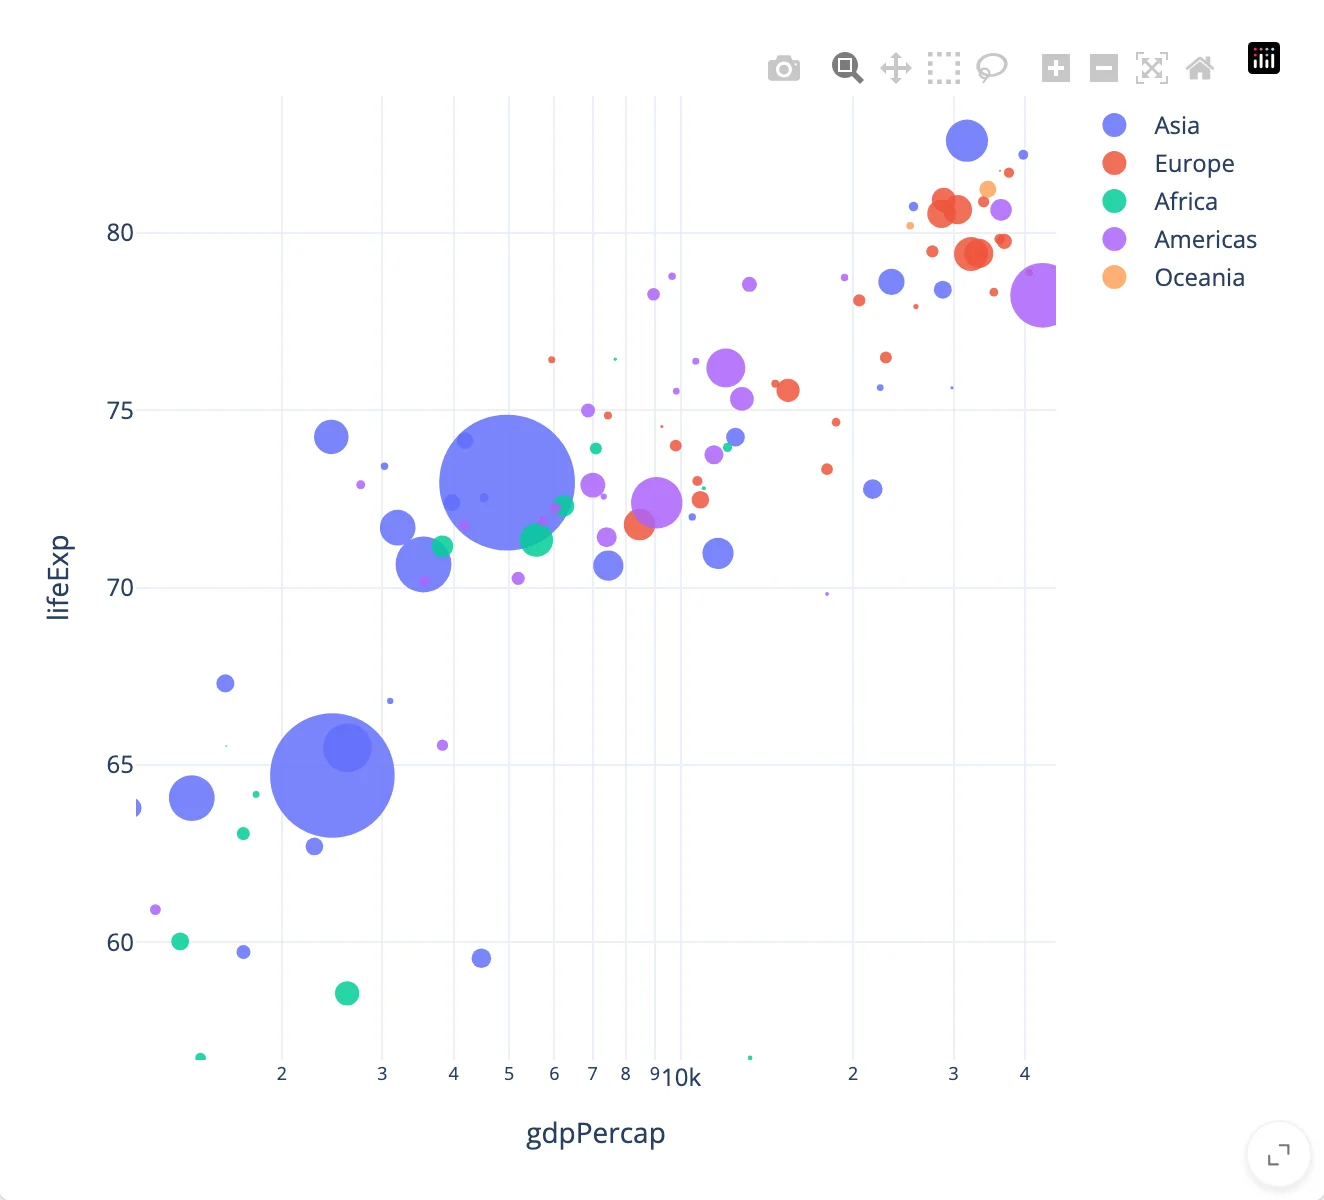
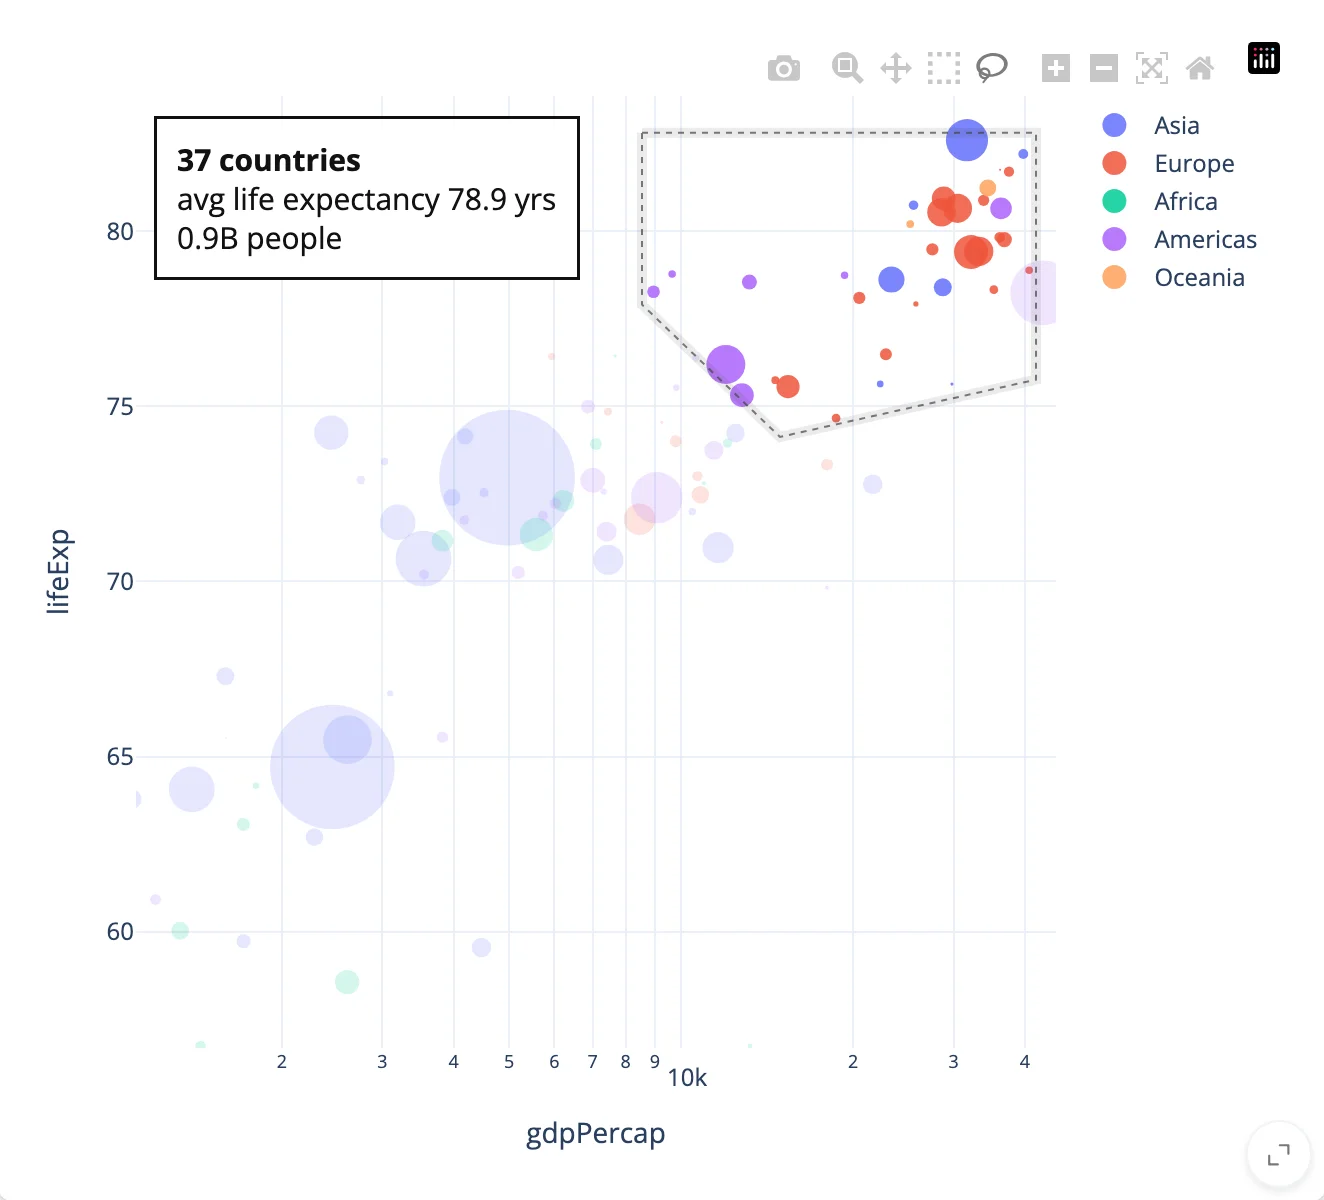
Compare this to what re-rendering would do: reading input.something() directly in plot’s render function would rebuild the whole figure on every change, resetting the zoom and clearing the lasso along with it. Updating in place covers this trade-off for every widget in the roster, including the cases where re-rendering is actually fine.
Where to go next
- Choosing a widget – which library fits your data, if it isn’t plotly.
- Reacting to widgets – the full accessor model.
- Updating in place –
.widget,reactive.isolate(), and the three widget lifetimes. - Troubleshooting – what to check if a widget doesn’t show up.
- The plotly guide – every accessor
@render_plotlyhas, and more linked-view patterns than this walkthrough needs.