quak
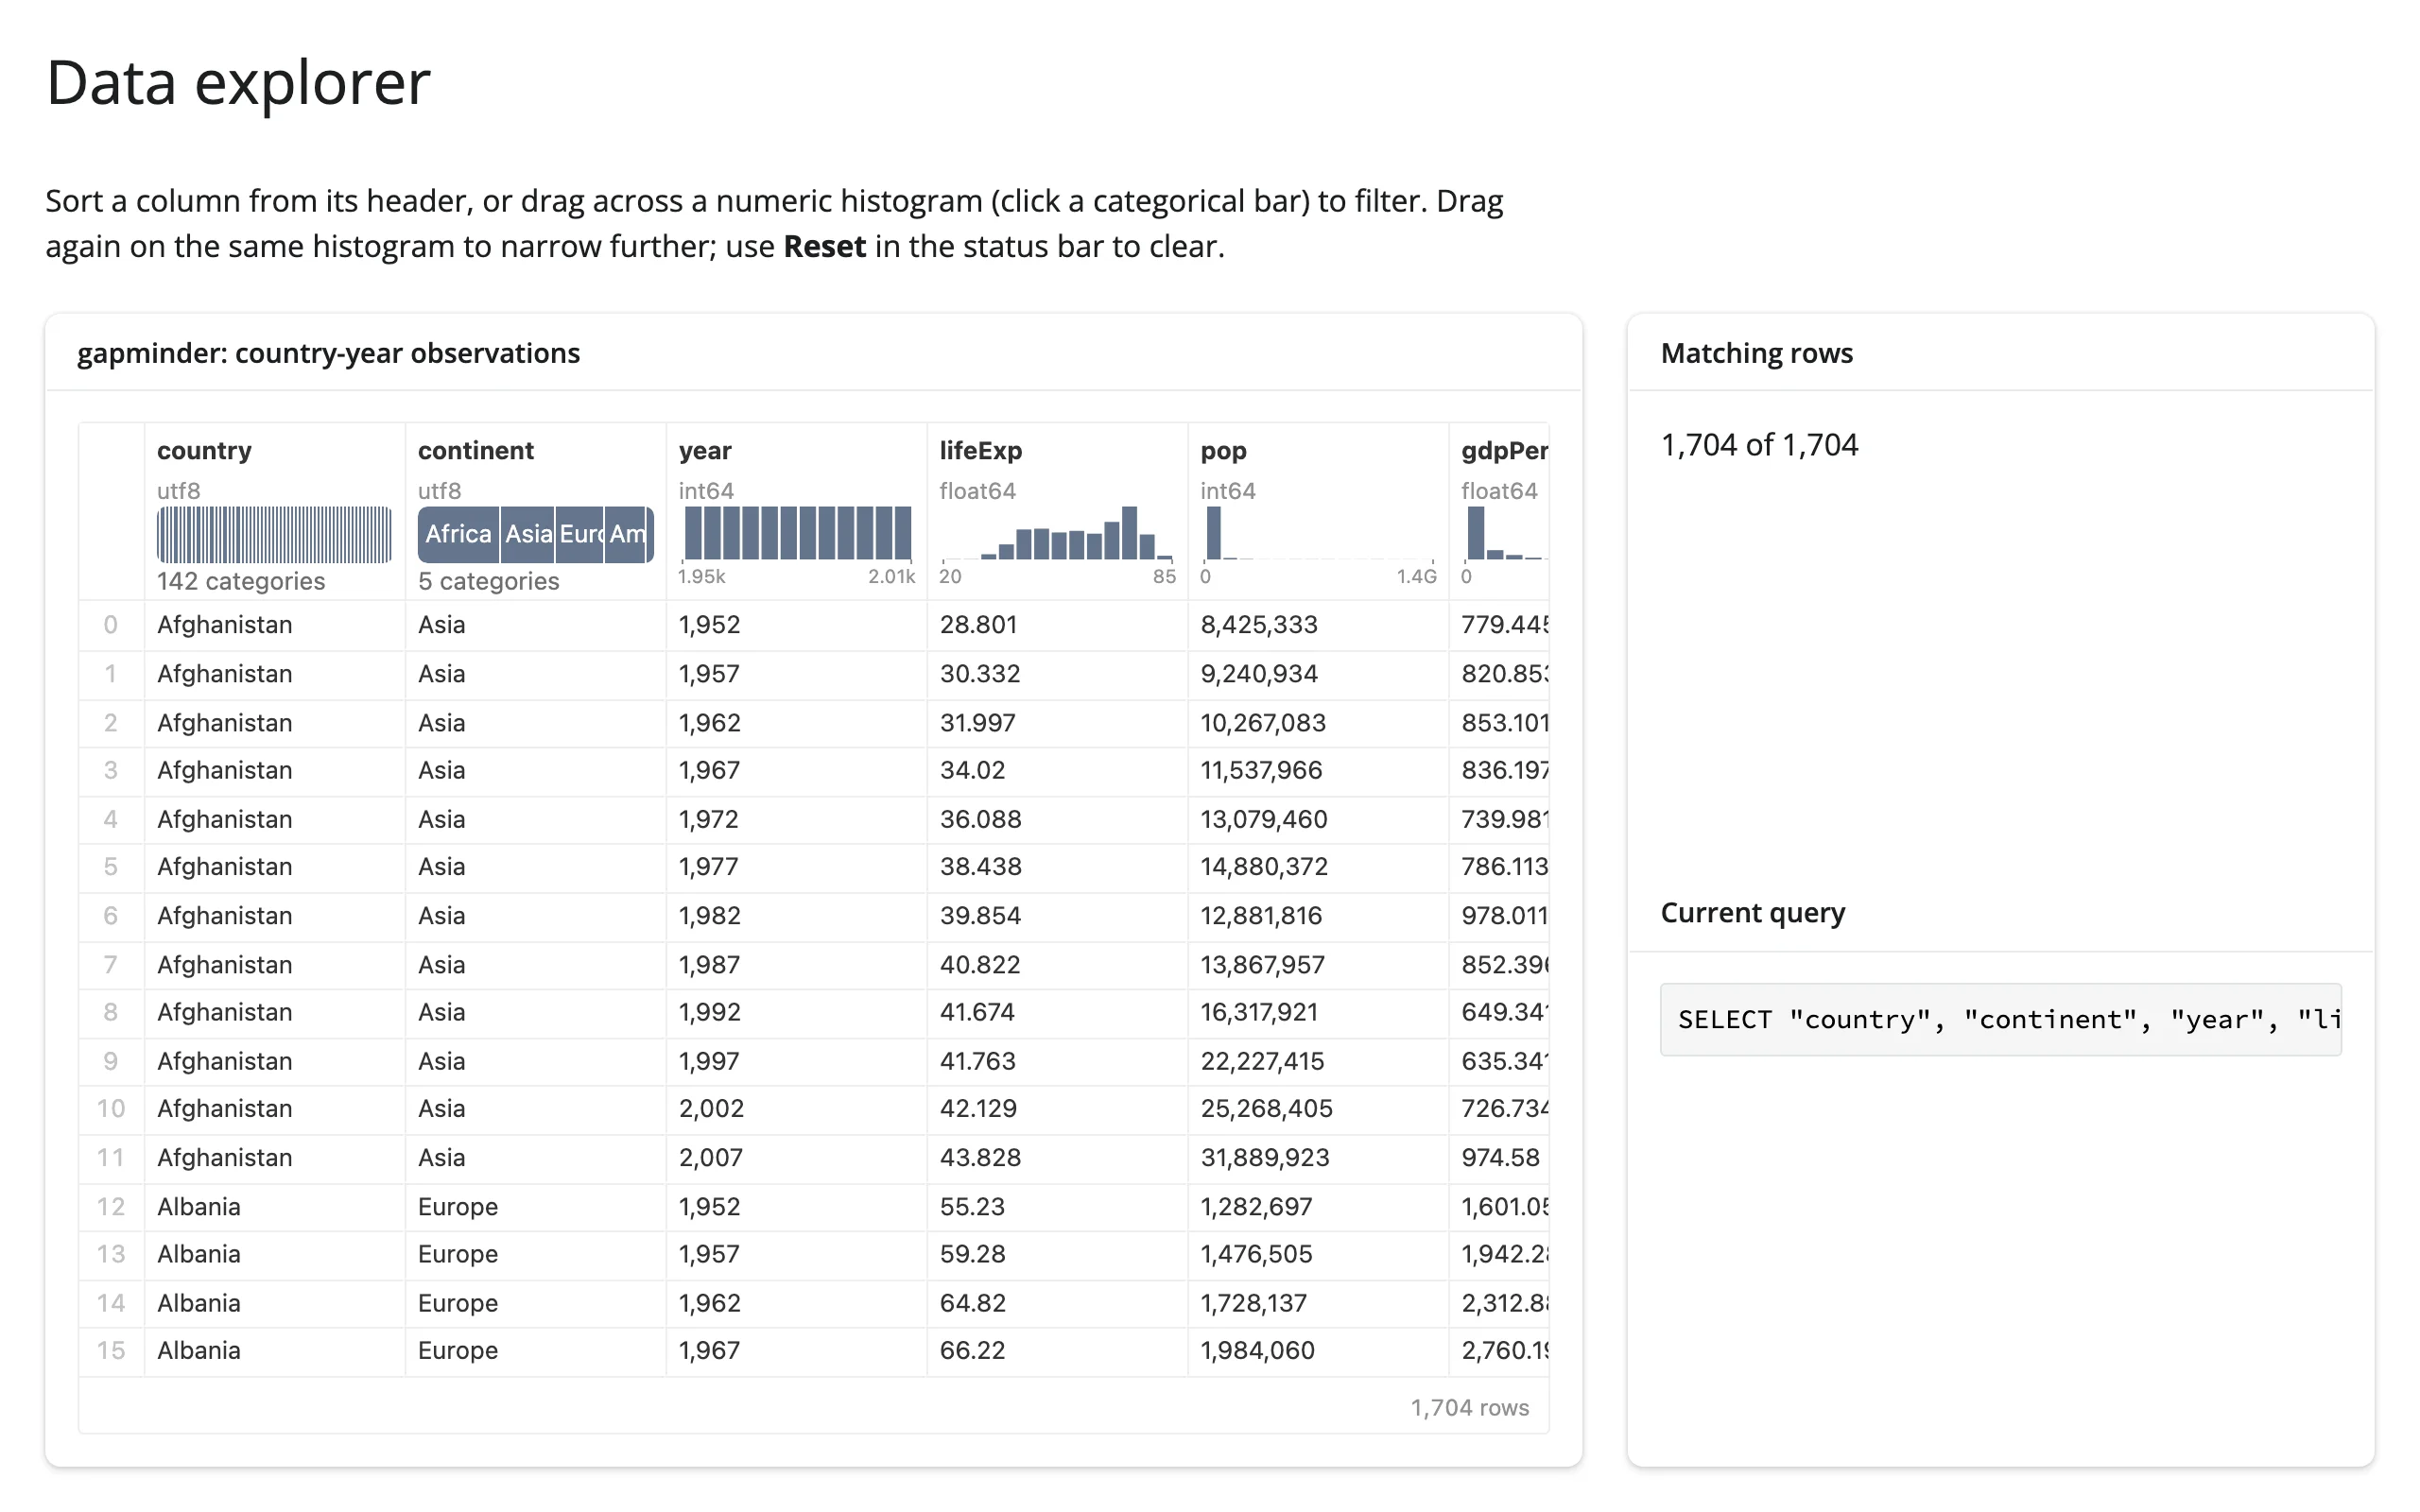
quak is a data table widget by Trevor Manz (also the author of anywidget), built on DuckDB and the Mosaic visualization framework. Point it at a DataFrame and it renders a scrollable, sortable table where every column header carries a small histogram – a numeric column gets a distribution, a categorical column gets a bar per category. Drag across a histogram, or click a category bar, and quak crossfilters: every other column’s histogram redraws to show the selection, and the table’s rows narrow to match.
What makes quak different from a client-side table is where the data lives. Your DataFrame never leaves the Python process – quak registers it in a DuckDB connection and queries it there, sending only the rows on screen and the histogram bin counts to the browser. That means a table of 5 million rows renders about as fast, and costs about as much browser memory, as a table of 5 thousand.
@render_quak accepts a pandas or polars DataFrame, a pyarrow Table, a DuckDB relation, a DuckDB connection, or a quak.Widget you built yourself, and fills its container by default (or respects an explicit height). It also locks down the widget’s DuckDB connection before display, so a visitor’s browser can query the data but can’t reach the server’s files – see “Security” below. Two accessors, table.sql() and table.data(), read back the query behind the user’s current sort and filter as a string and as a lazy DuckDB relation – the mechanism behind every pattern in “Coordinating multiple views” below: a value box of filtered counts, a chart of exactly the filtered rows, a CSV download read on demand of exactly the filtered subset.
Reach for quak when the point is exploring a large table by brushing summary histograms, especially past the row counts where itables or reactable start to struggle. If you need cell editing, row selection, or a grid that looks like the rest of your app, those two (or ipydatagrid) are a better fit. If the user needs to pivot and re-aggregate the data themselves, see perspective. If you want several linked, DuckDB-backed views (not just one table) built from a declarative spec, see mosaic – quak is, in fact, a single Mosaic view under the hood.
Installation
pip install 'shinywidgets[quak]'This installs quak and its dependencies (duckdb, pyarrow, anywidget). quak (via duckdb) has no wheels for Python 3.15 yet; stay on 3.10-3.14 until duckdb catches up.
Quick start
Return any DataFrame and you get a full table: per-column histograms, sorting, and crossfiltering, with no other code.
from __future__ import annotations

import plotly.express as px
from shiny.express import ui
from shinywidgets import render_quak

ui.page_opts(title="quak quickstart", fillable=True)

gapminder = px.data.gapminder()

with ui.card(full_screen=True):

    @render_quak
    def table():
        return gapminder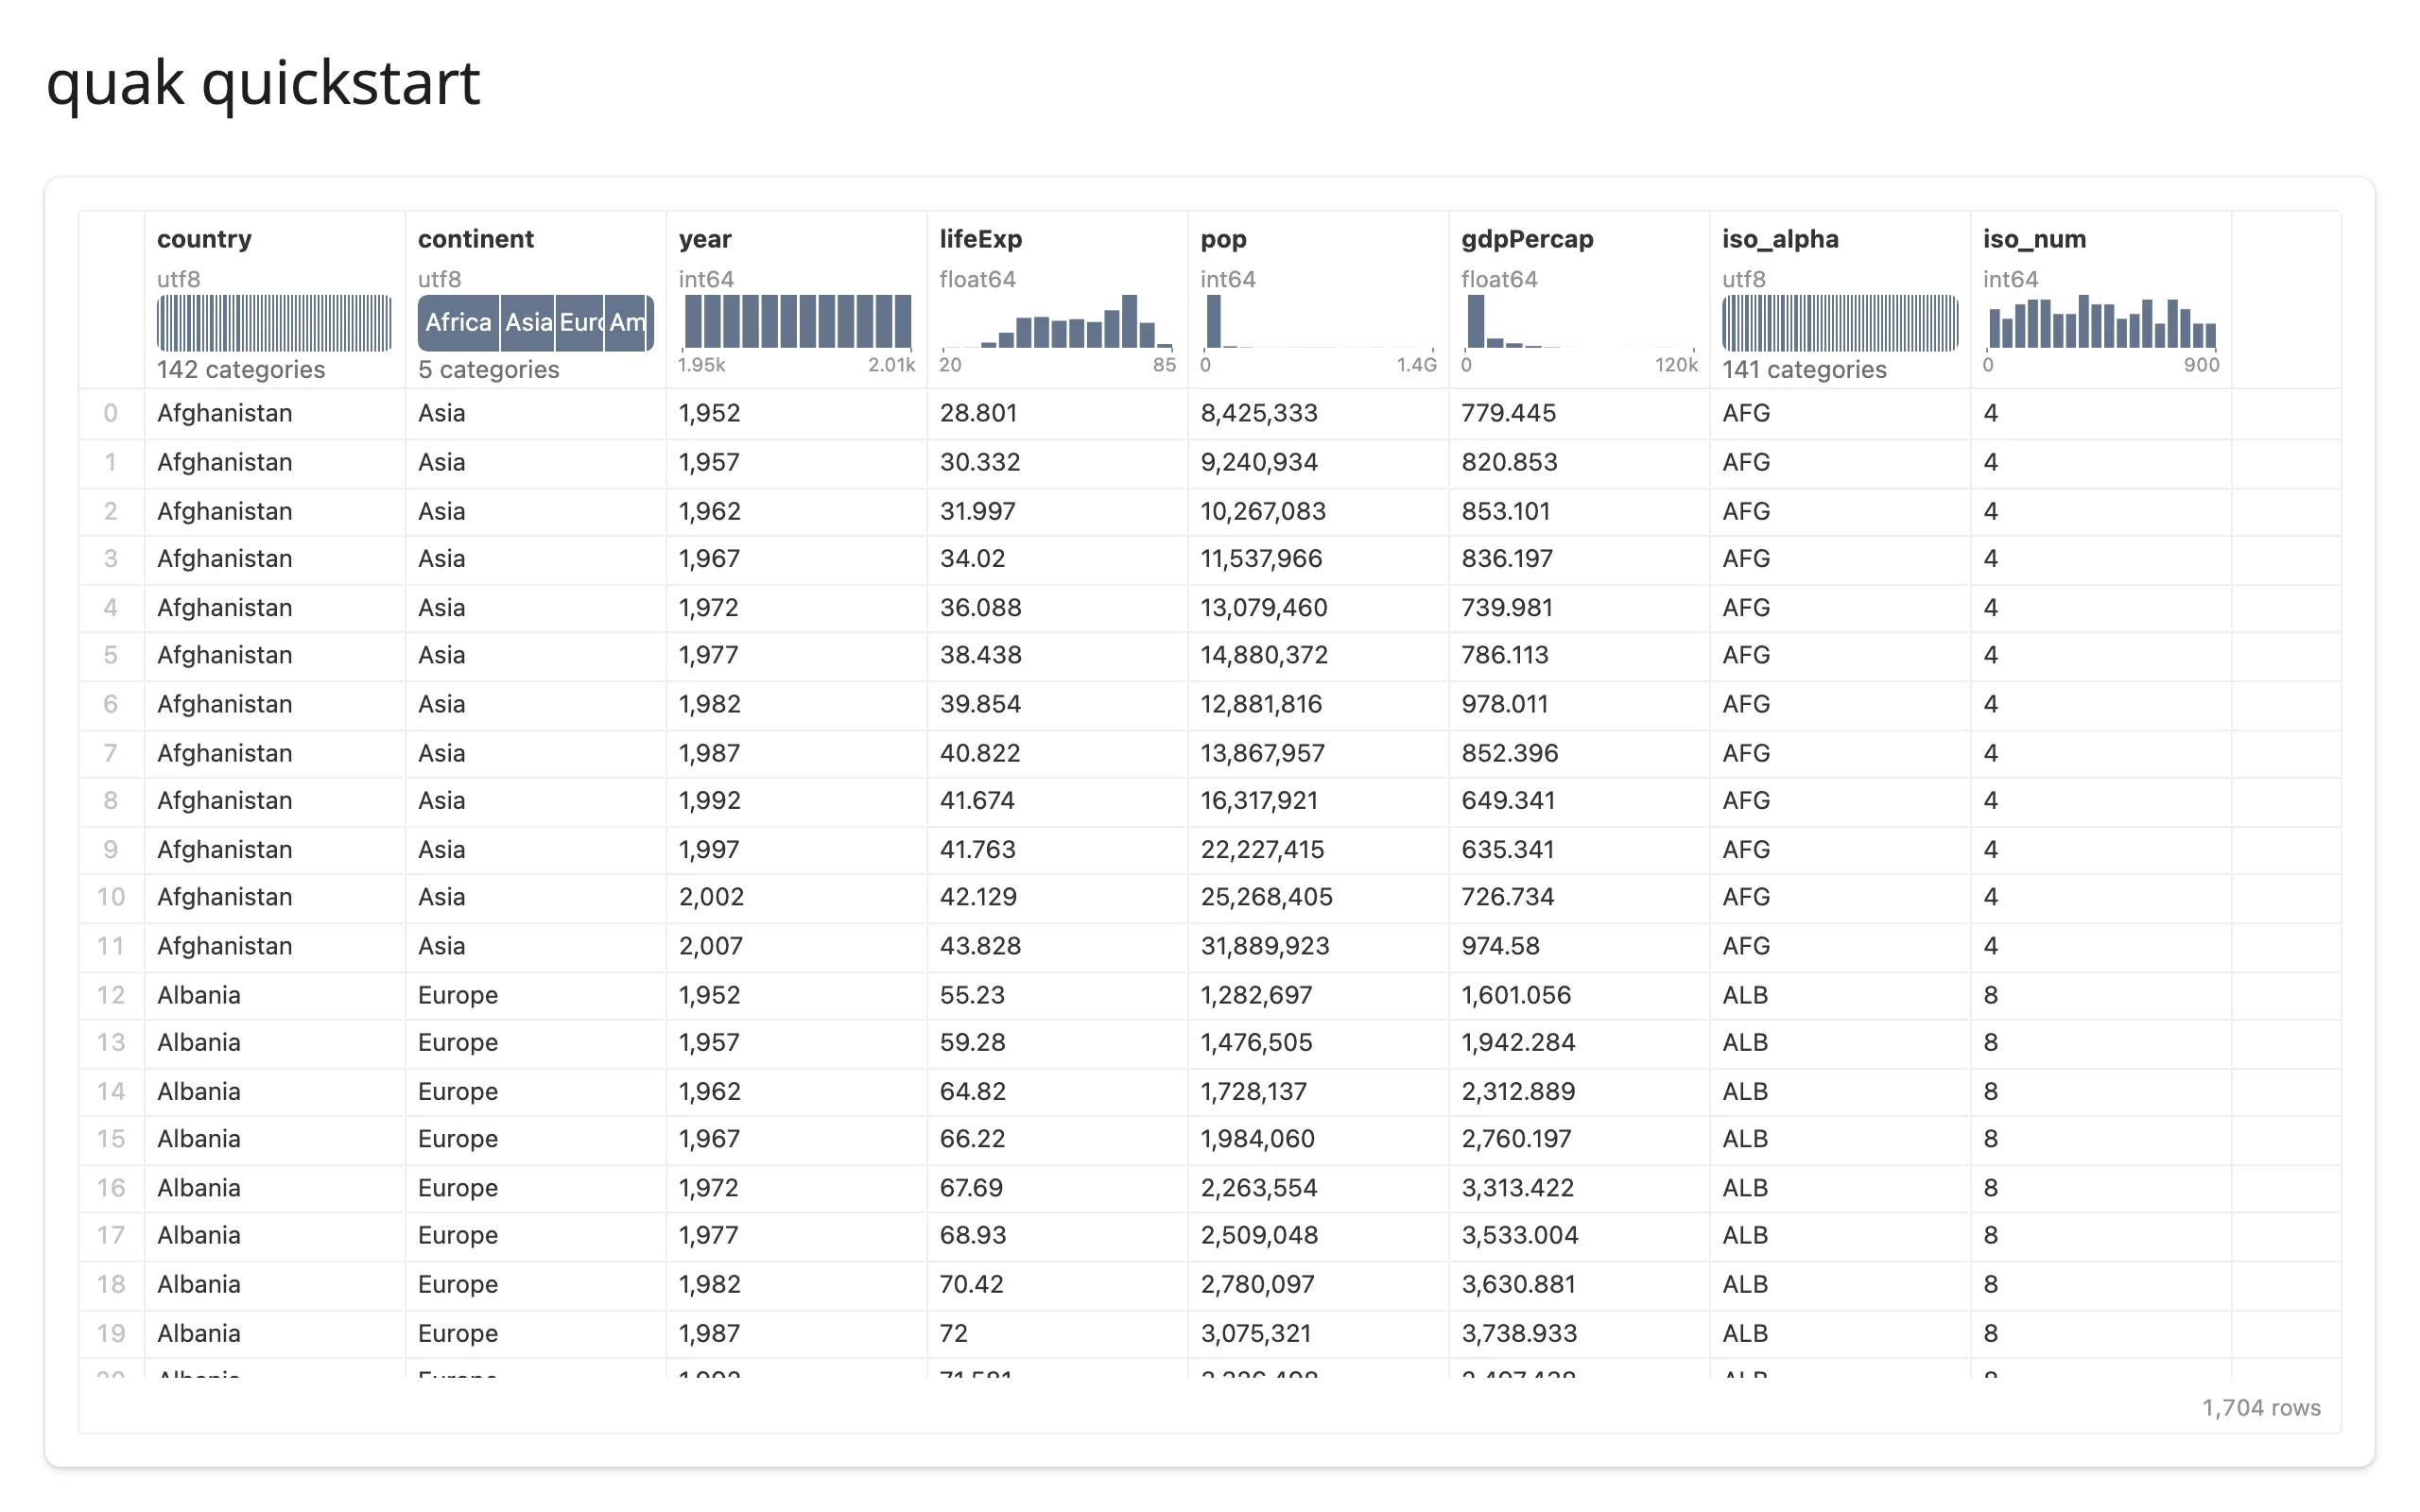
What you can build
Crossfiltering, with no application code
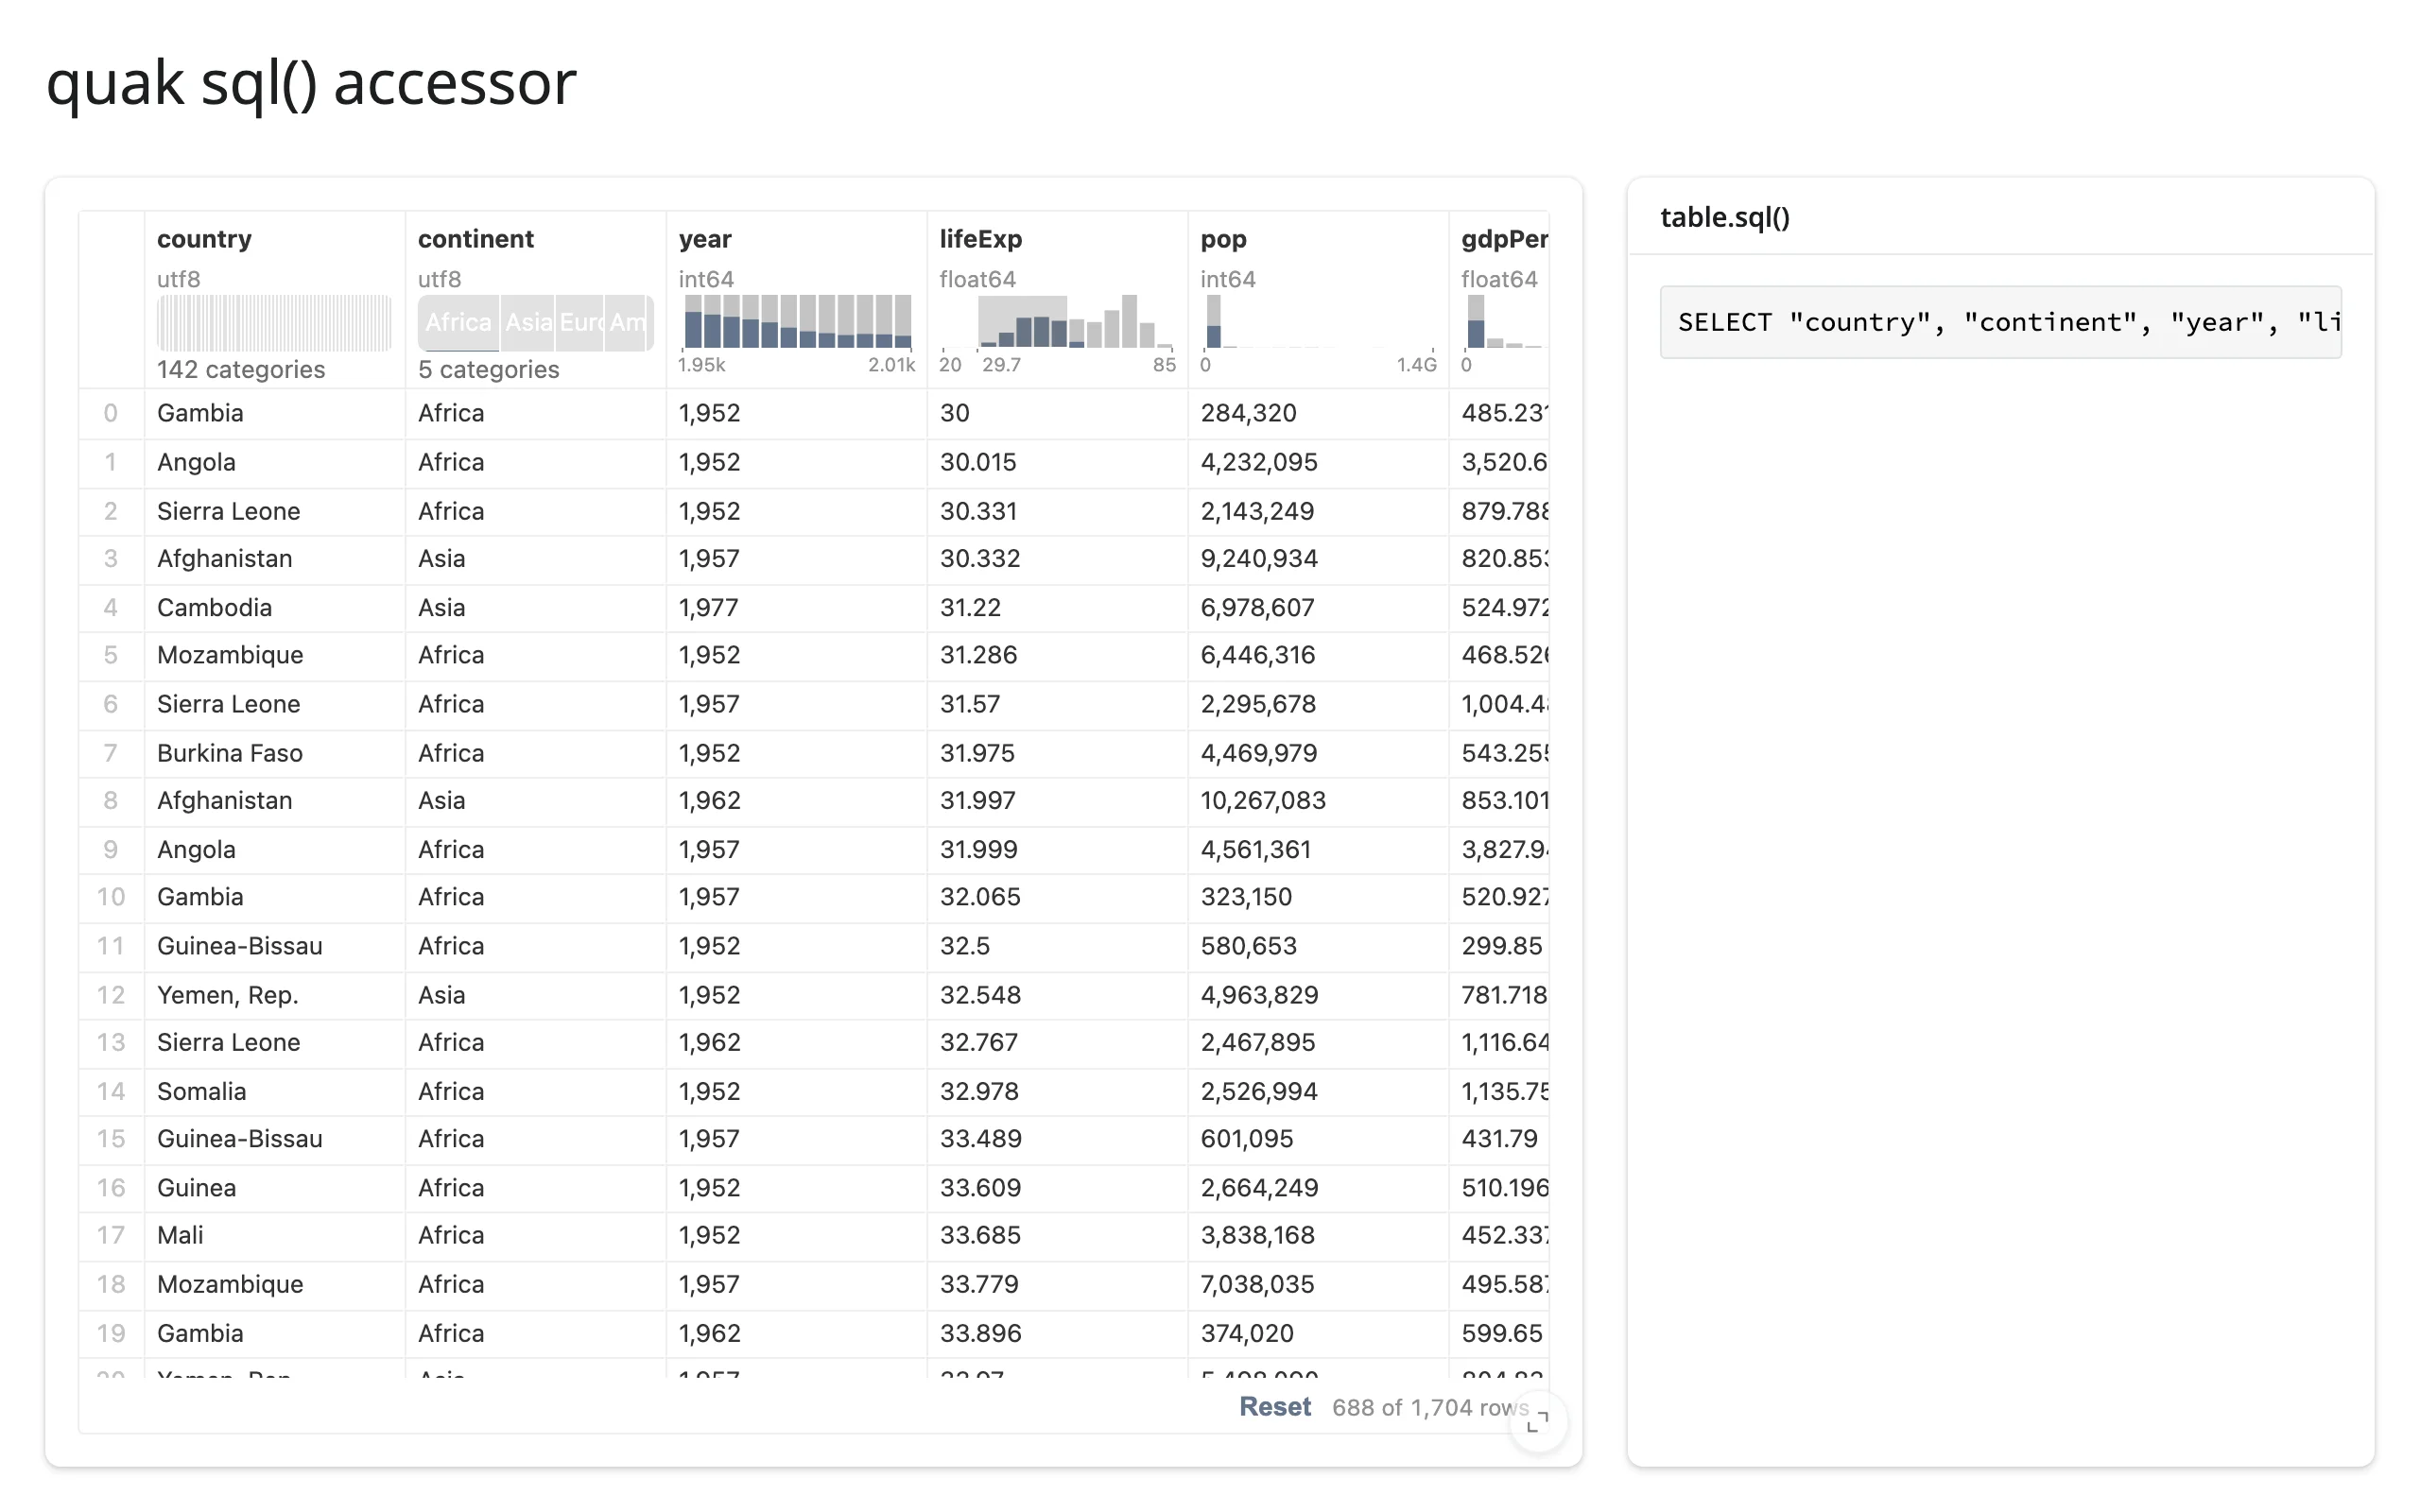
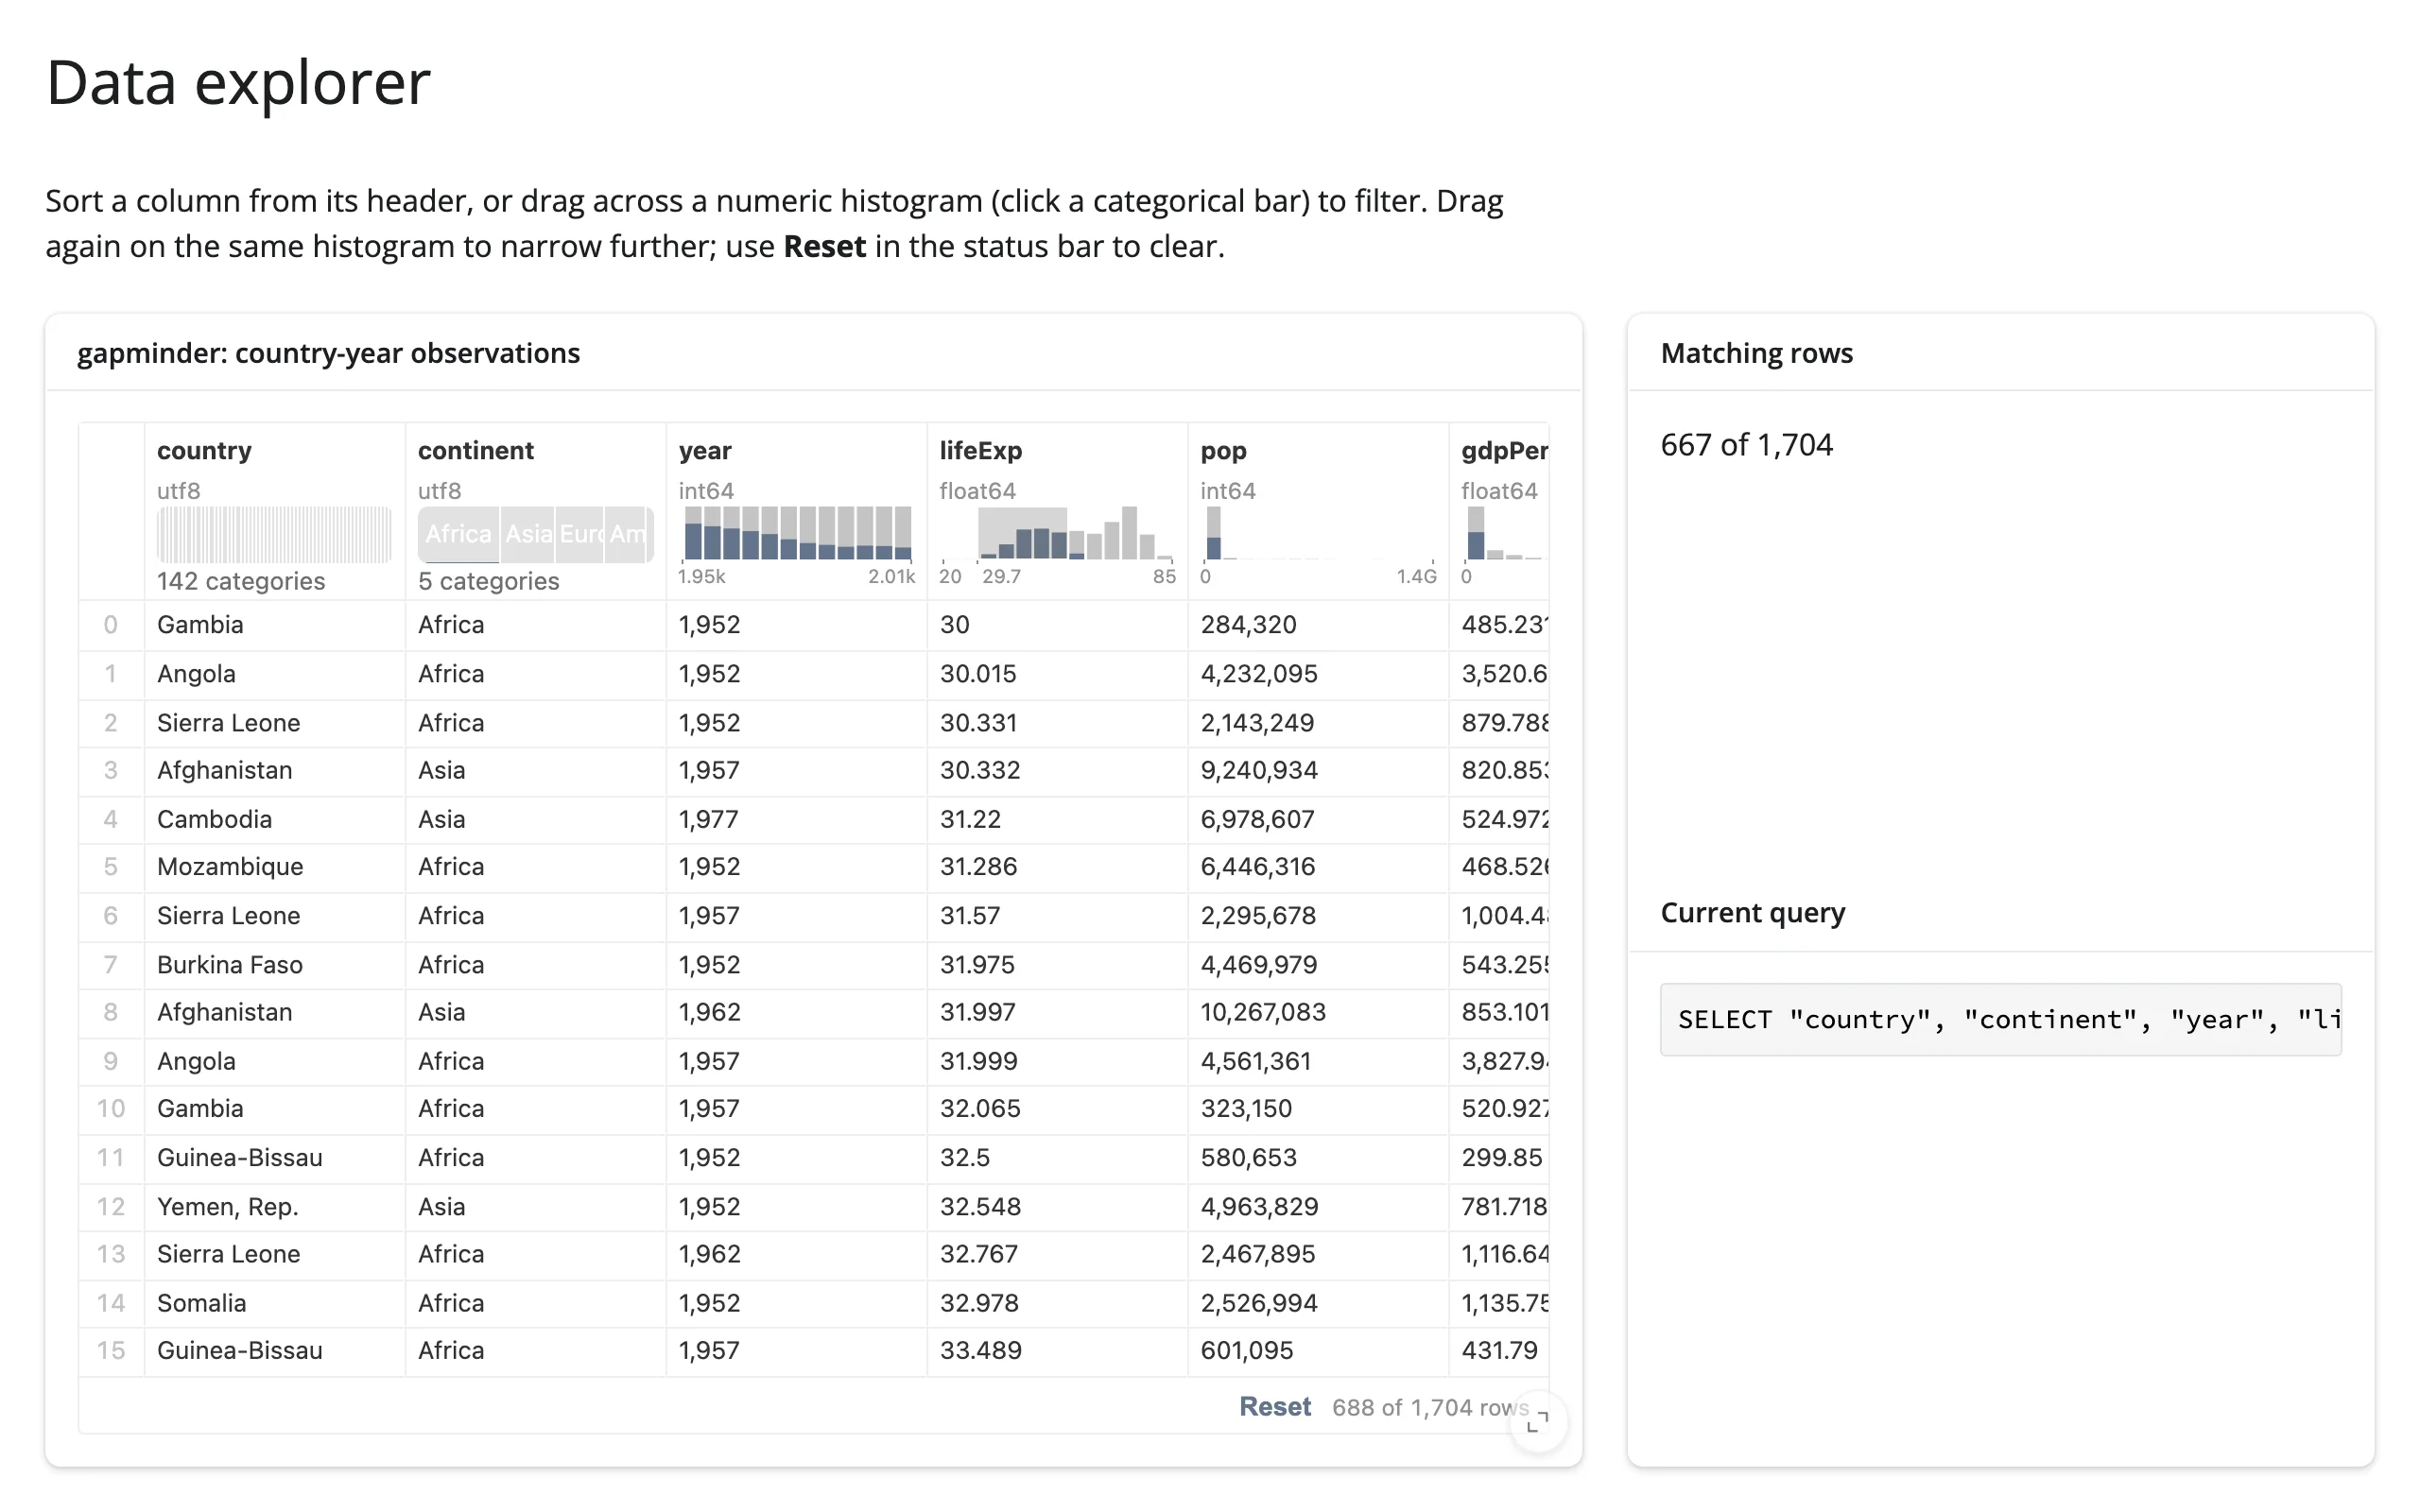
Drag across a numeric column’s histogram, or click a bar in a categorical column’s histogram, and quak filters the table to the matching rows – every other column’s histogram redraws over the selection (the pale bars are the full data; the dark overlay is the current selection), and a Reset link appears in the status bar. This is the same app as the quick start; the behavior is built into quak itself.
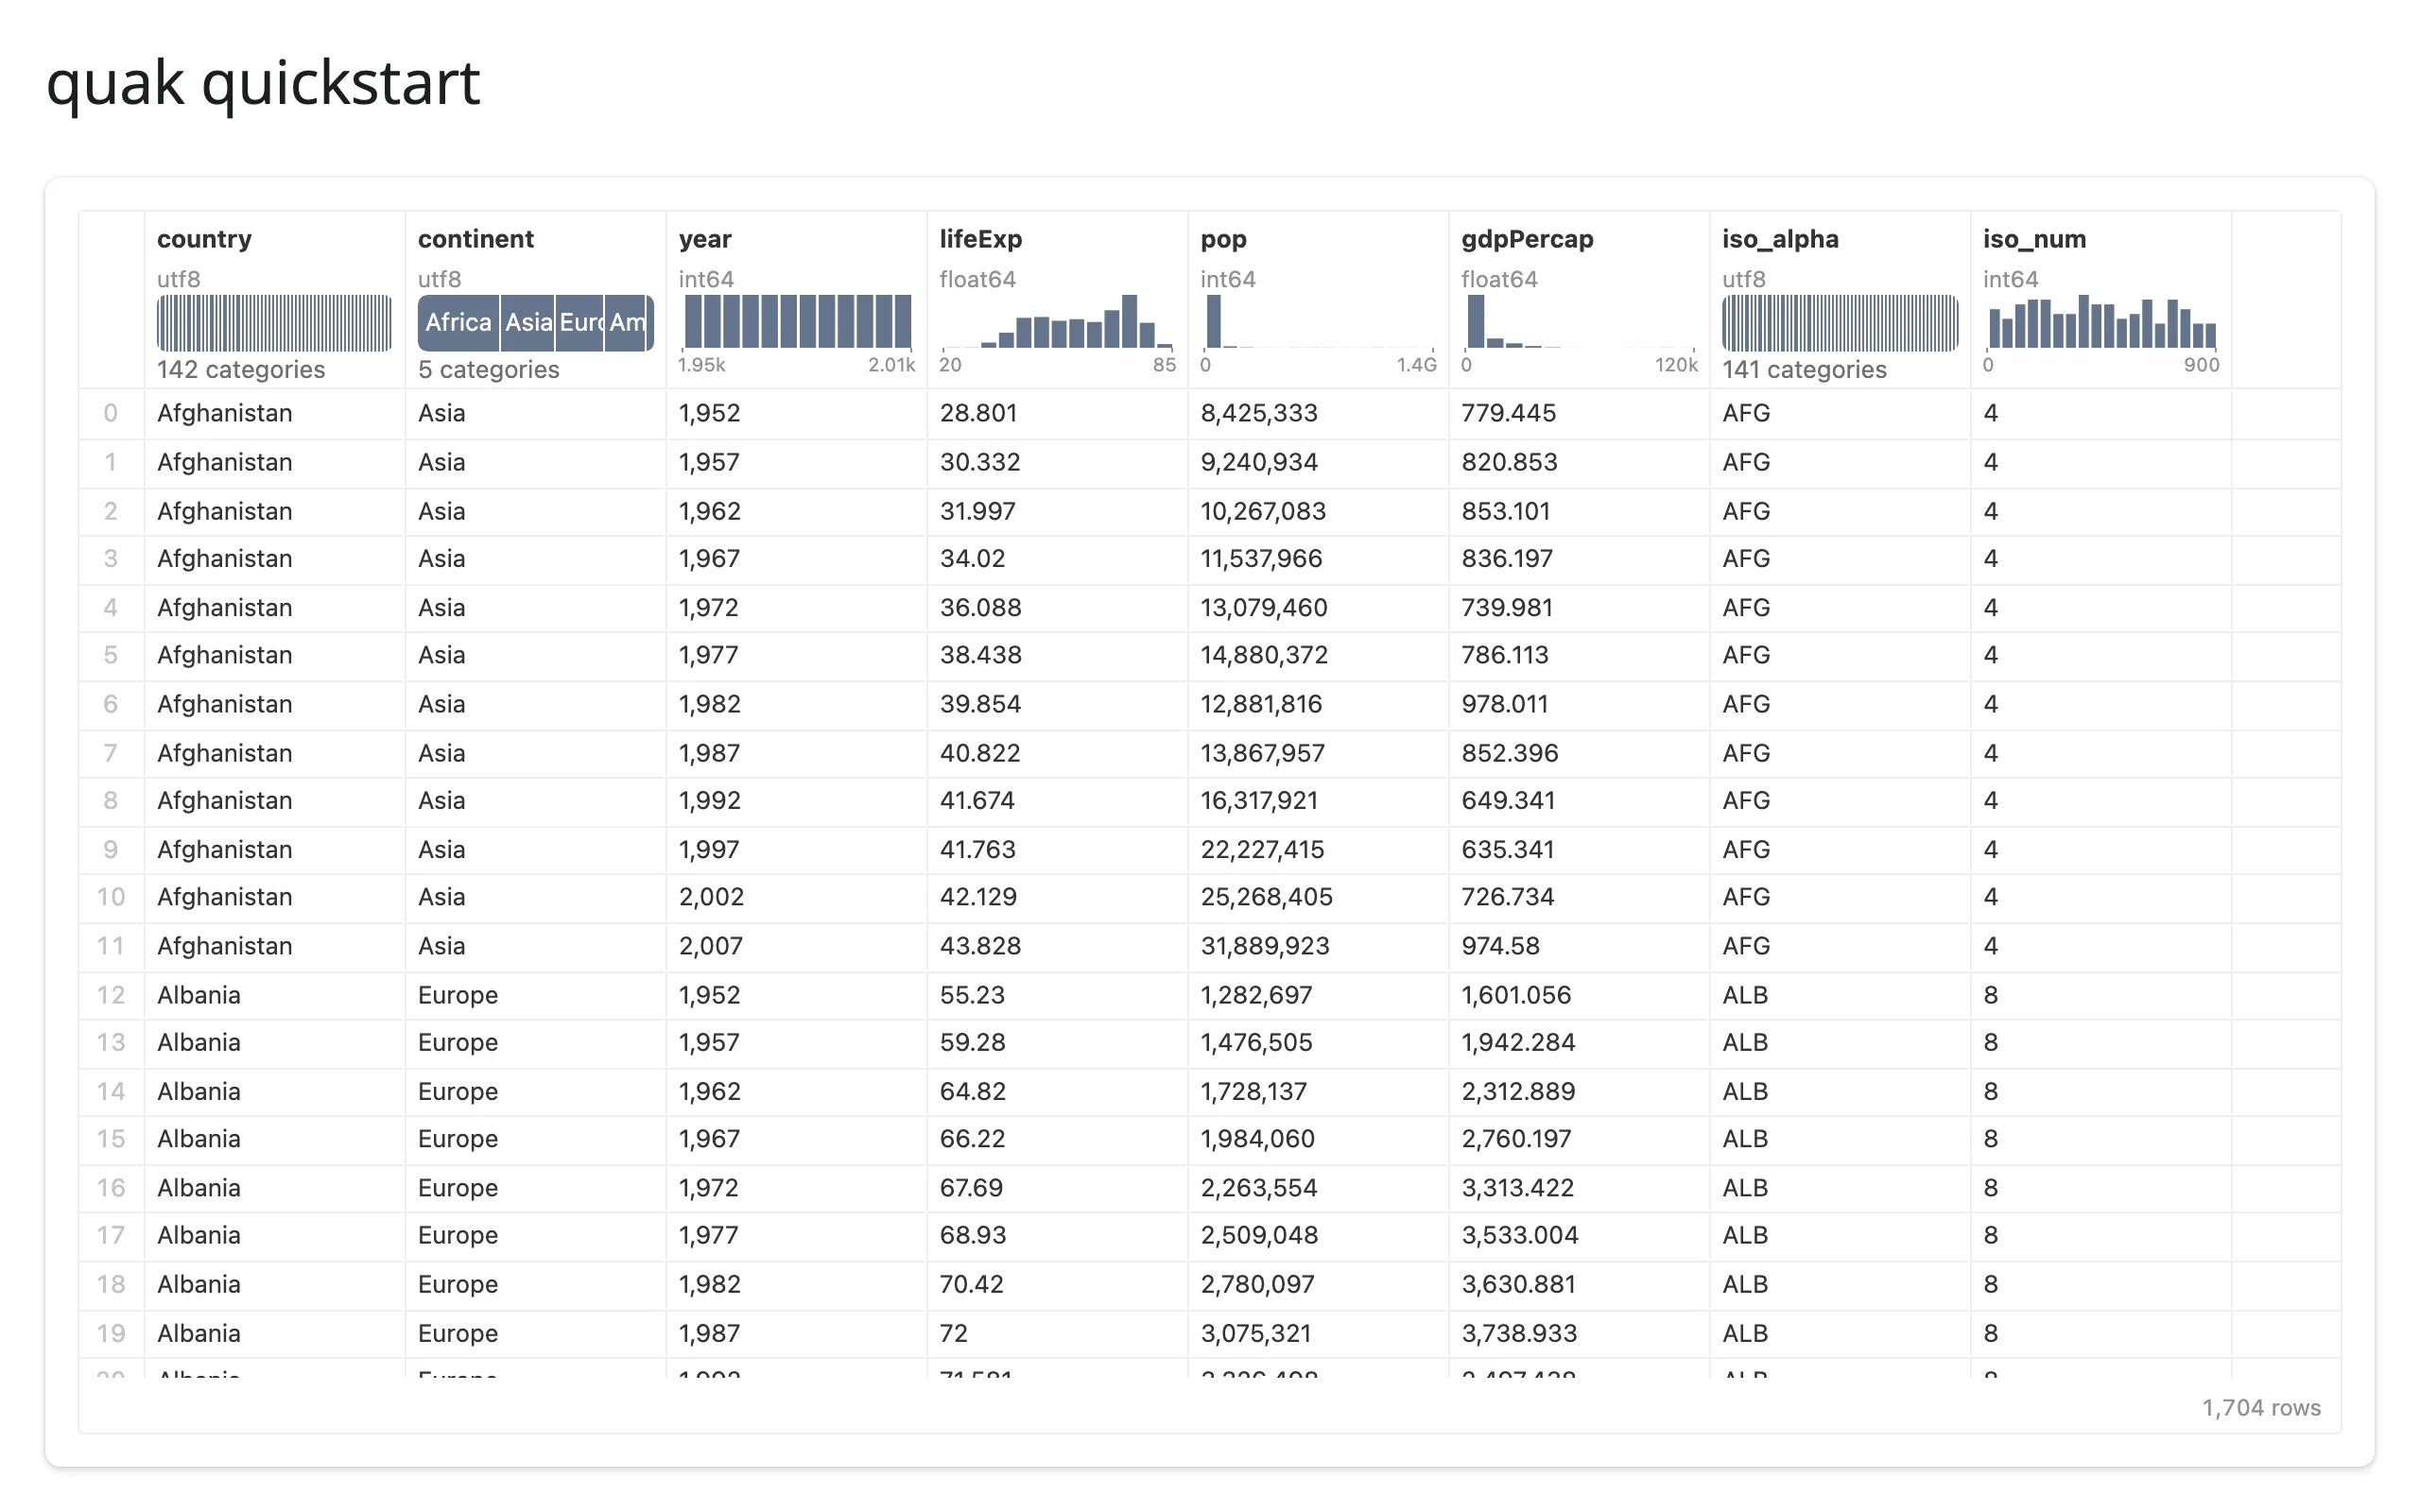
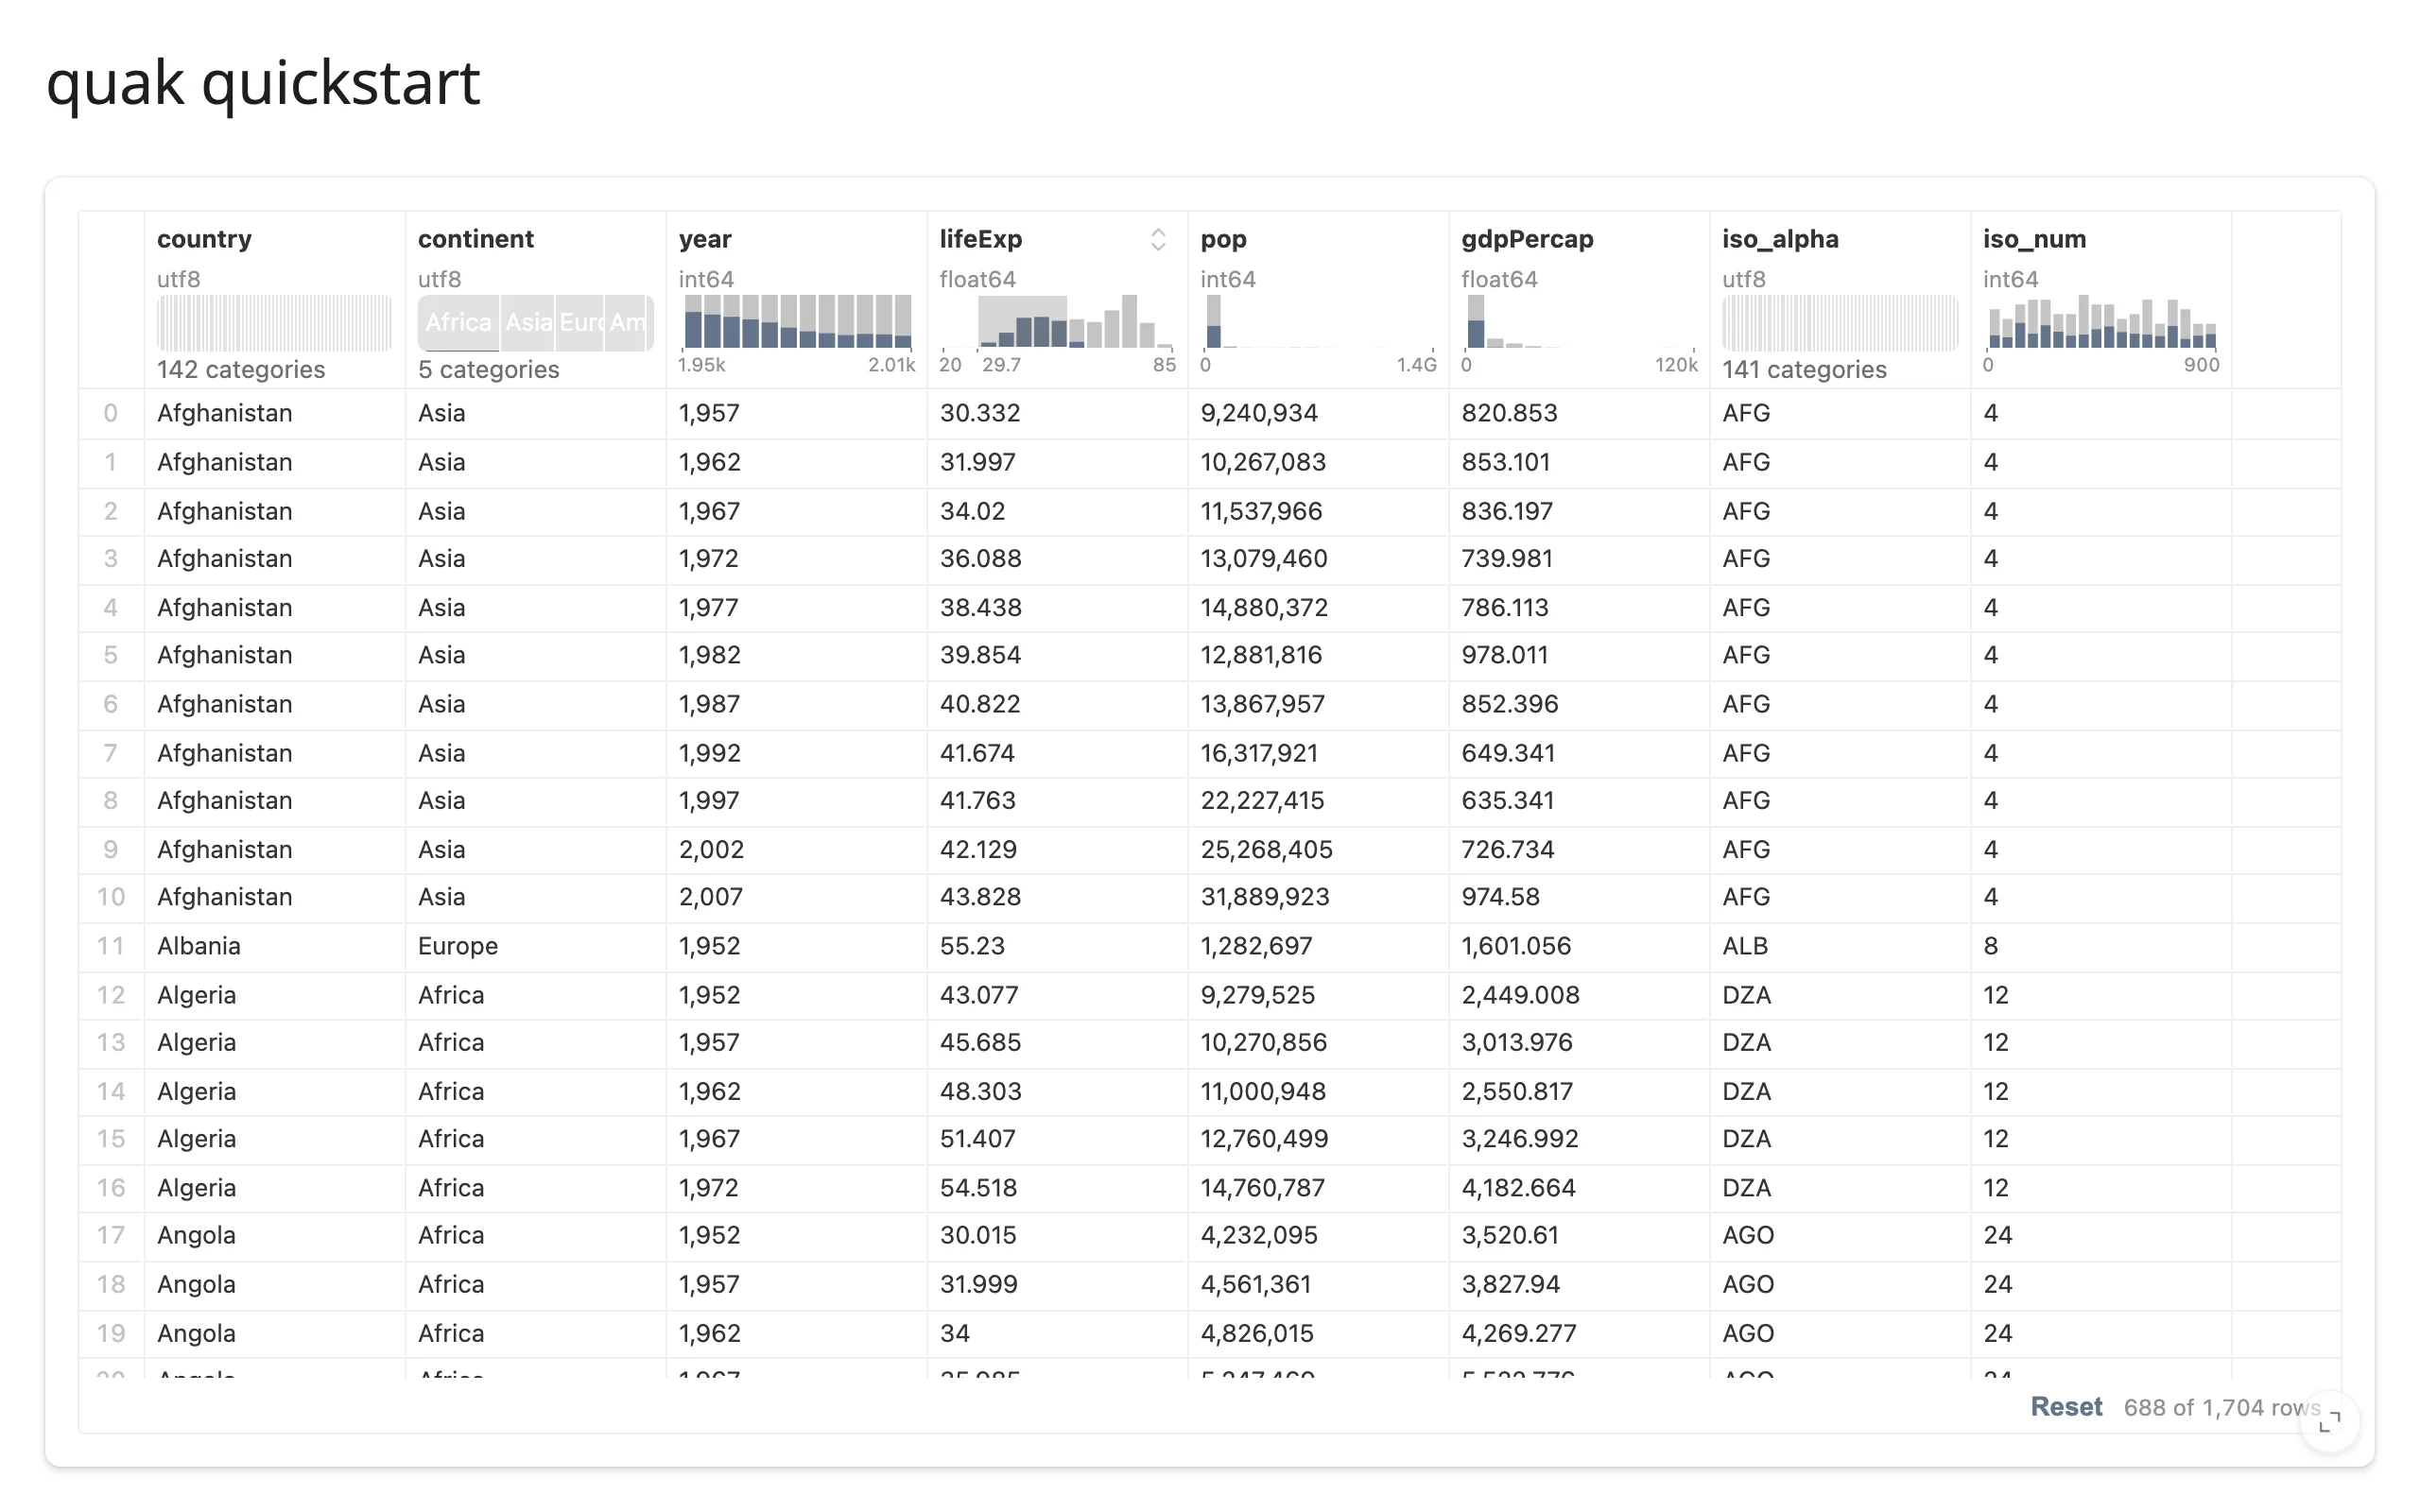
Sorting is also free: hover a column header and three sort states cycle through its header’s sort button (ascending, descending, unsorted).
Any DataFrame-like object, including a DuckDB relation or connection
Besides pandas/polars DataFrames and pyarrow Tables, render_quak accepts a DuckDB relation or connection directly – useful when your data already lives in DuckDB and you don’t want to materialize a DataFrame copy of it first.
from __future__ import annotations

import duckdb
import plotly.express as px
from shiny.express import ui
from shinywidgets import render_quak

ui.page_opts(title="quak from a DuckDB relation", fillable=True)

# Register once; render_quak() also accepts pandas/polars DataFrames and
# pyarrow Tables directly, with no conversion step. DuckDBPyConnection.register()
# returns the connection (for chaining) -- discard it, or Shiny Express's
# auto-display will try to render that return value as page content.
con = duckdb.connect(":memory:")
_ = con.register("gapminder", px.data.gapminder())
by_country_year = con.sql("""
    select country, continent, year, lifeExp, pop, gdpPercap
    from gapminder
    where pop > 2_000_000
""")

with ui.card(full_screen=True):

    @render_quak
    def table():
        return by_country_year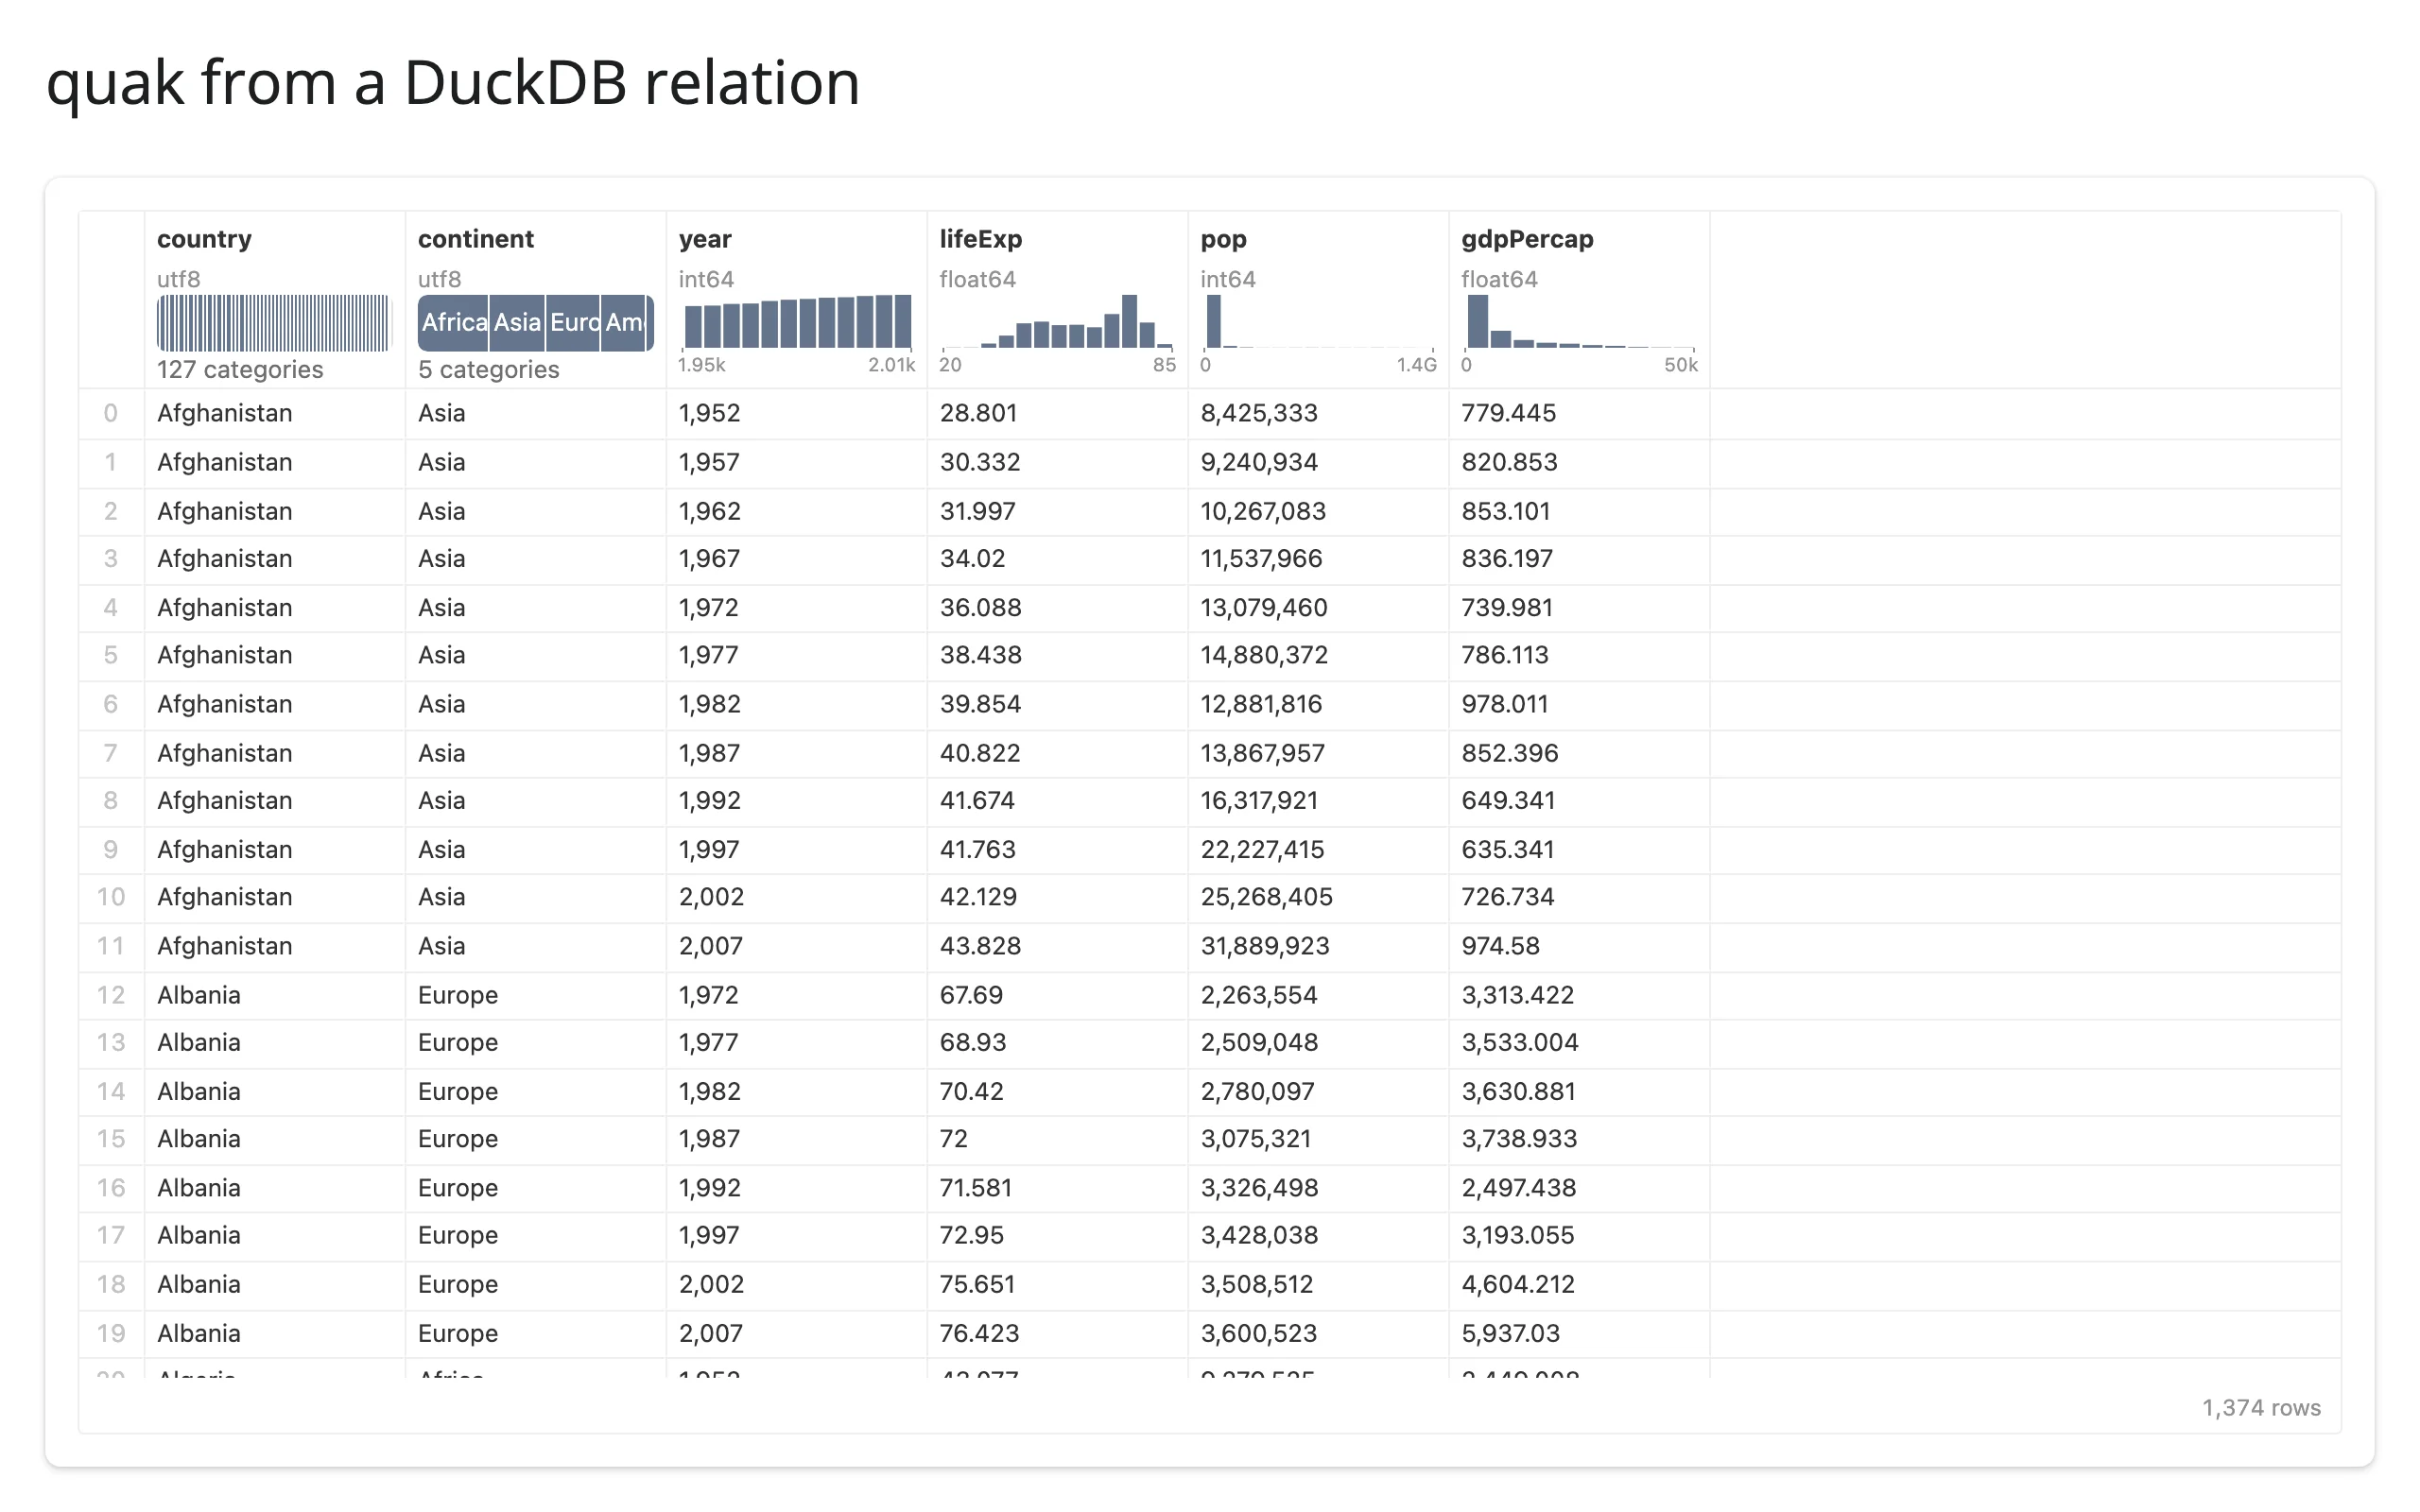
If you pass a bare duckdb.DuckDBPyConnection instead of a relation, quak queries a table named df on it by default – construct quak.Widget(con, table="your_table") yourself if your table has a different name (see Gotchas).
Scale: millions of rows at roughly constant cost
Because quak only ever sends the rows on screen and each histogram’s bin counts over the wire, a table of 5 million rows renders about as fast as one of 5 thousand – the cost moved to DuckDB running in your Python process, which is built for exactly this.
from __future__ import annotations

import numpy as np
import pandas as pd
from shiny.express import ui
from shinywidgets import render_quak

ui.page_opts(title="quak at scale", fillable=True)

# Synthetic "ride" data, sized for scale rather than realism: quak only ever
# sends the rows on screen and each histogram's bin counts over the wire, so
# the browser payload is about the same at 5k rows or 5M.
n = 5_000_000
rng = np.random.default_rng(0)
rides = pd.DataFrame(
    {
        "borough": rng.choice(
            ["Manhattan", "Brooklyn", "Queens", "Bronx", "Staten Island"],
            n,
            p=[0.45, 0.25, 0.2, 0.07, 0.03],
        ),
        "hour": rng.integers(0, 24, n),
        "trip_minutes": np.clip(rng.gamma(2.0, 6.0, n), 1, 120).round(1),
        "fare_usd": np.clip(rng.gamma(3.0, 5.0, n), 2.5, 200).round(2),
    }
)

with ui.card(full_screen=True):
    ui.card_header(f"{n:,} synthetic rides")

    @render_quak
    def table():
        return rides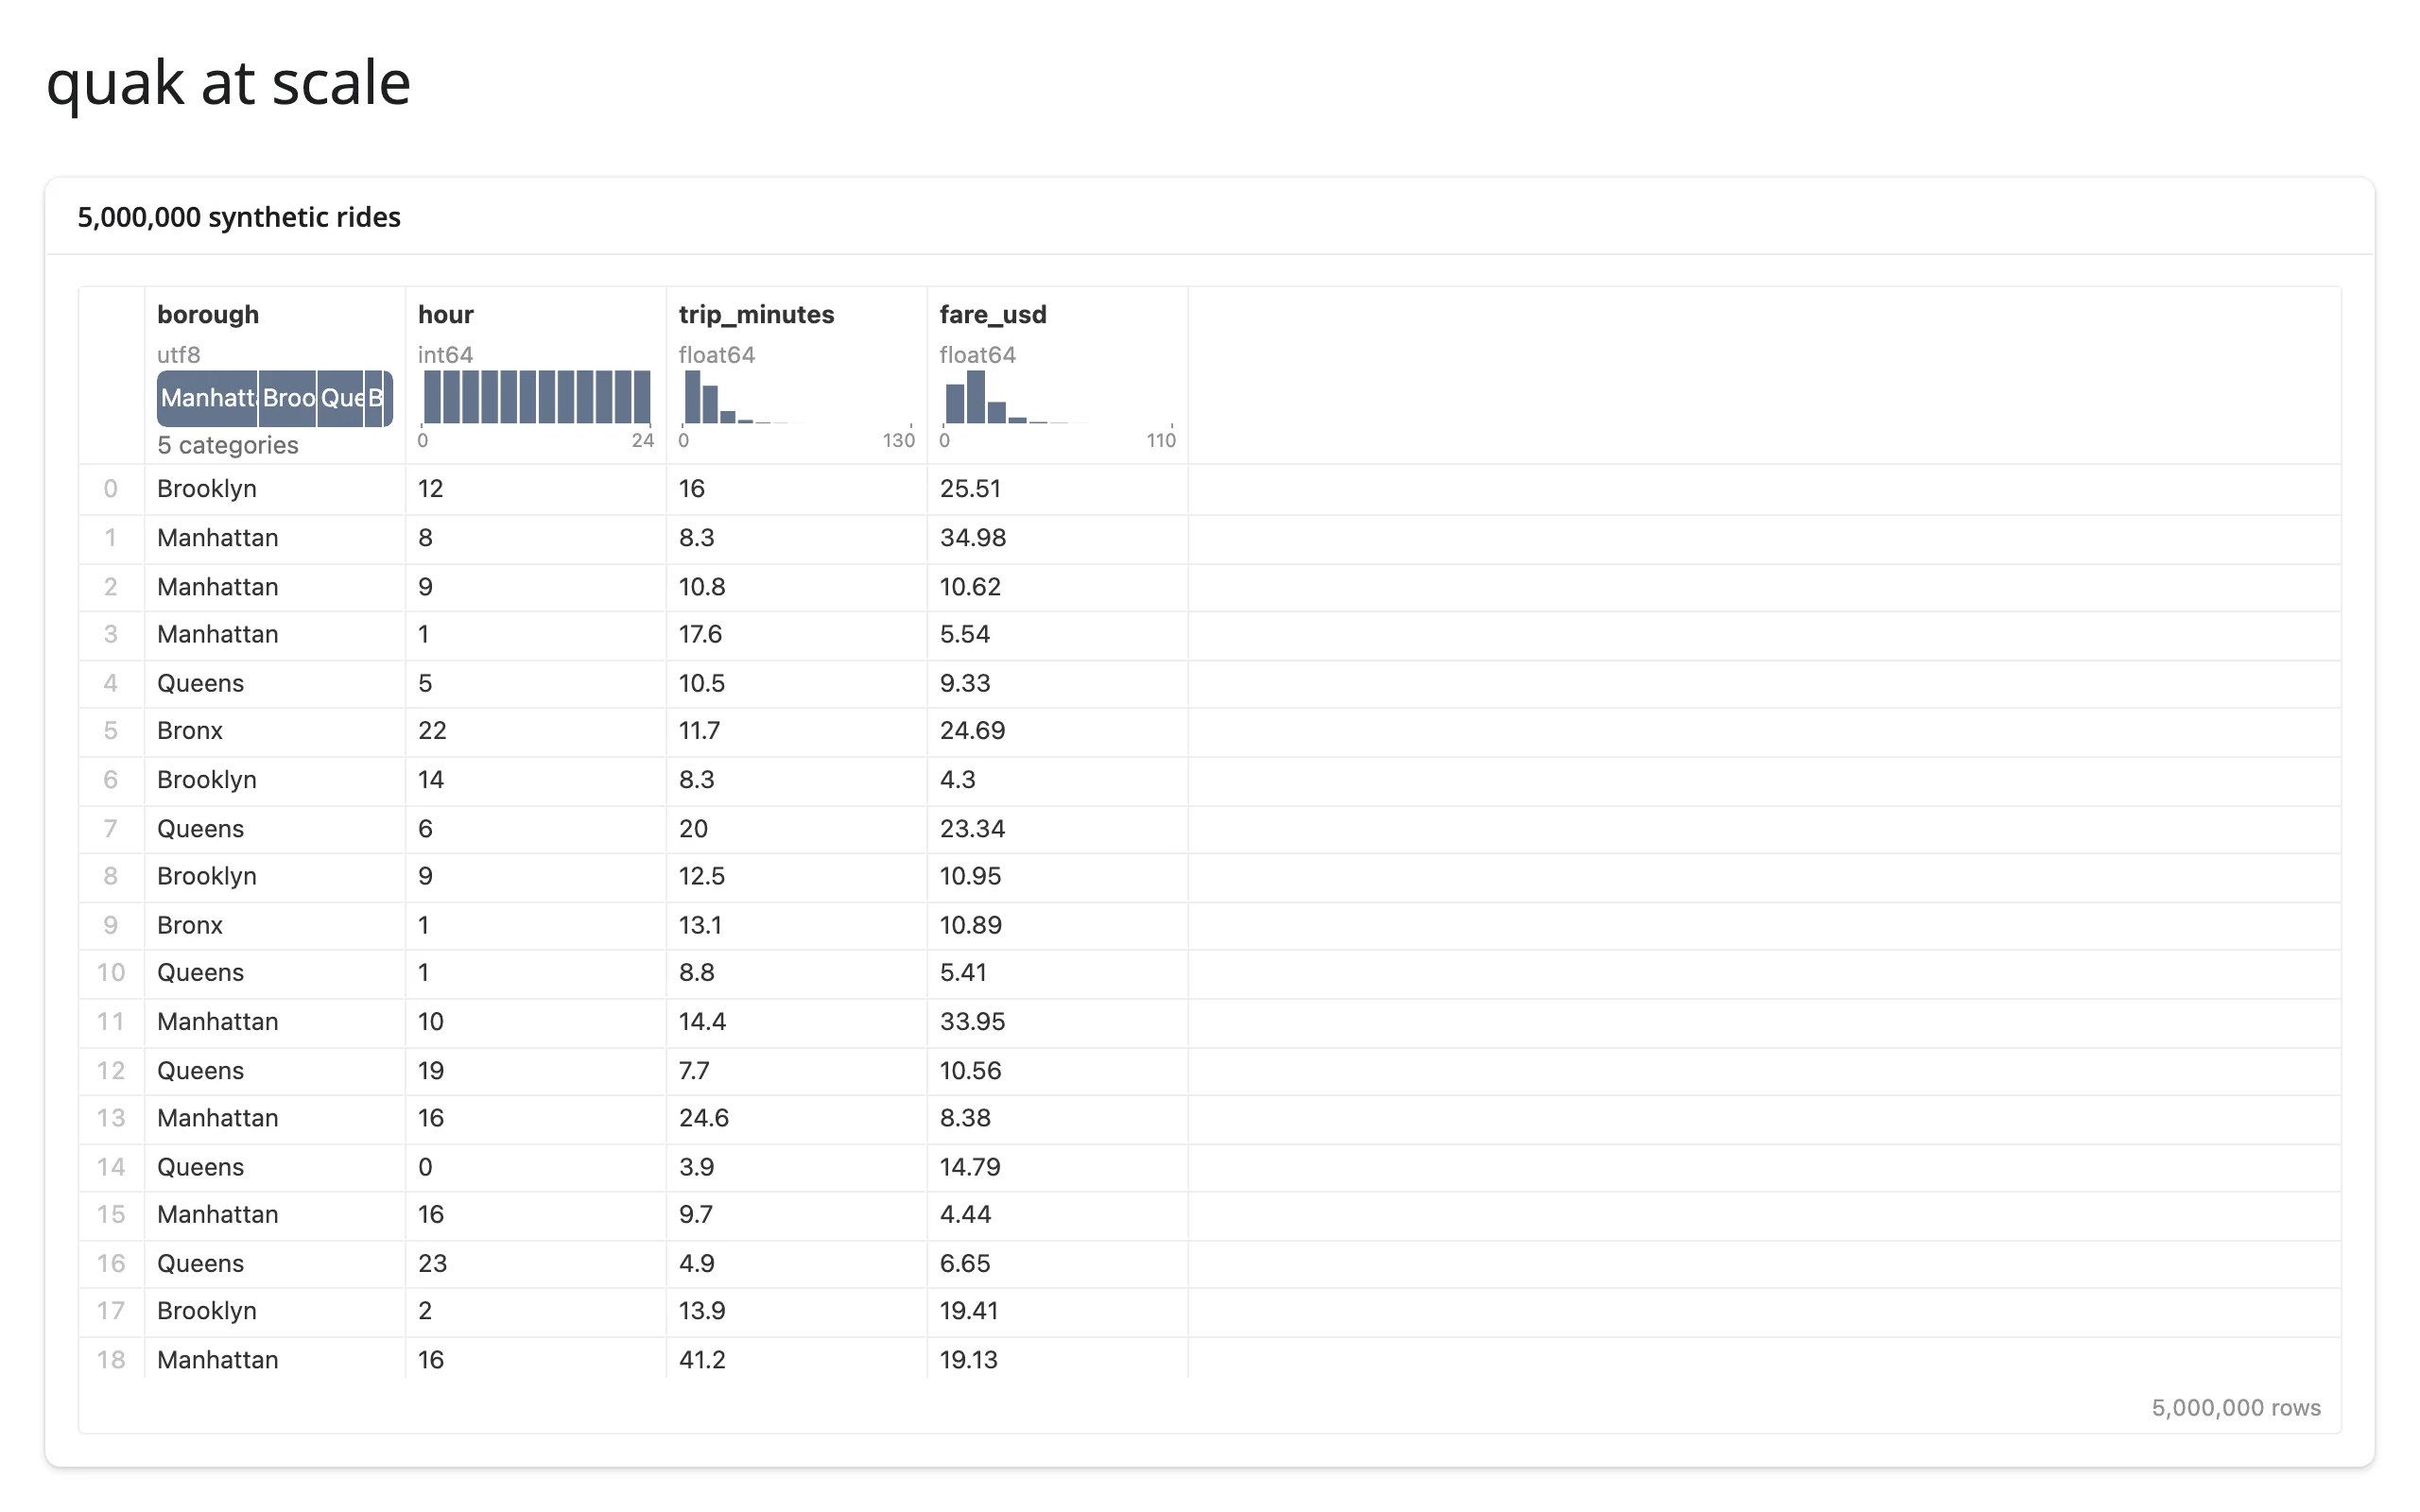
Reacting to user interaction
Accessor reference
| accessor | returns | before any interaction | across re-render | default rate policy |
|---|---|---|---|---|
table.sql() |
str |
cancels (like an unrendered output) during the brief window before the table’s first report | re-seeded from the new table | debounce, 250 ms |
table.data() |
duckdb.DuckDBPyRelation (lazy) |
cancels alongside sql() |
re-seeded, following sql() |
inherits sql()’s |
Both read naturally in a @render.* function, a @reactive.calc, or a @reactive.effect – they behave like input.my_slider(), re-running whatever reads them each time the user interacts. Neither can be read inside the @render_quak function itself, which builds a brand-new table on every call. Both describe the table’s current state, not a memory of past interaction: a re-render always starts them over from the new table’s own query, so there’s no stale value to worry about carrying across renders.
sql(): the query behind the current view
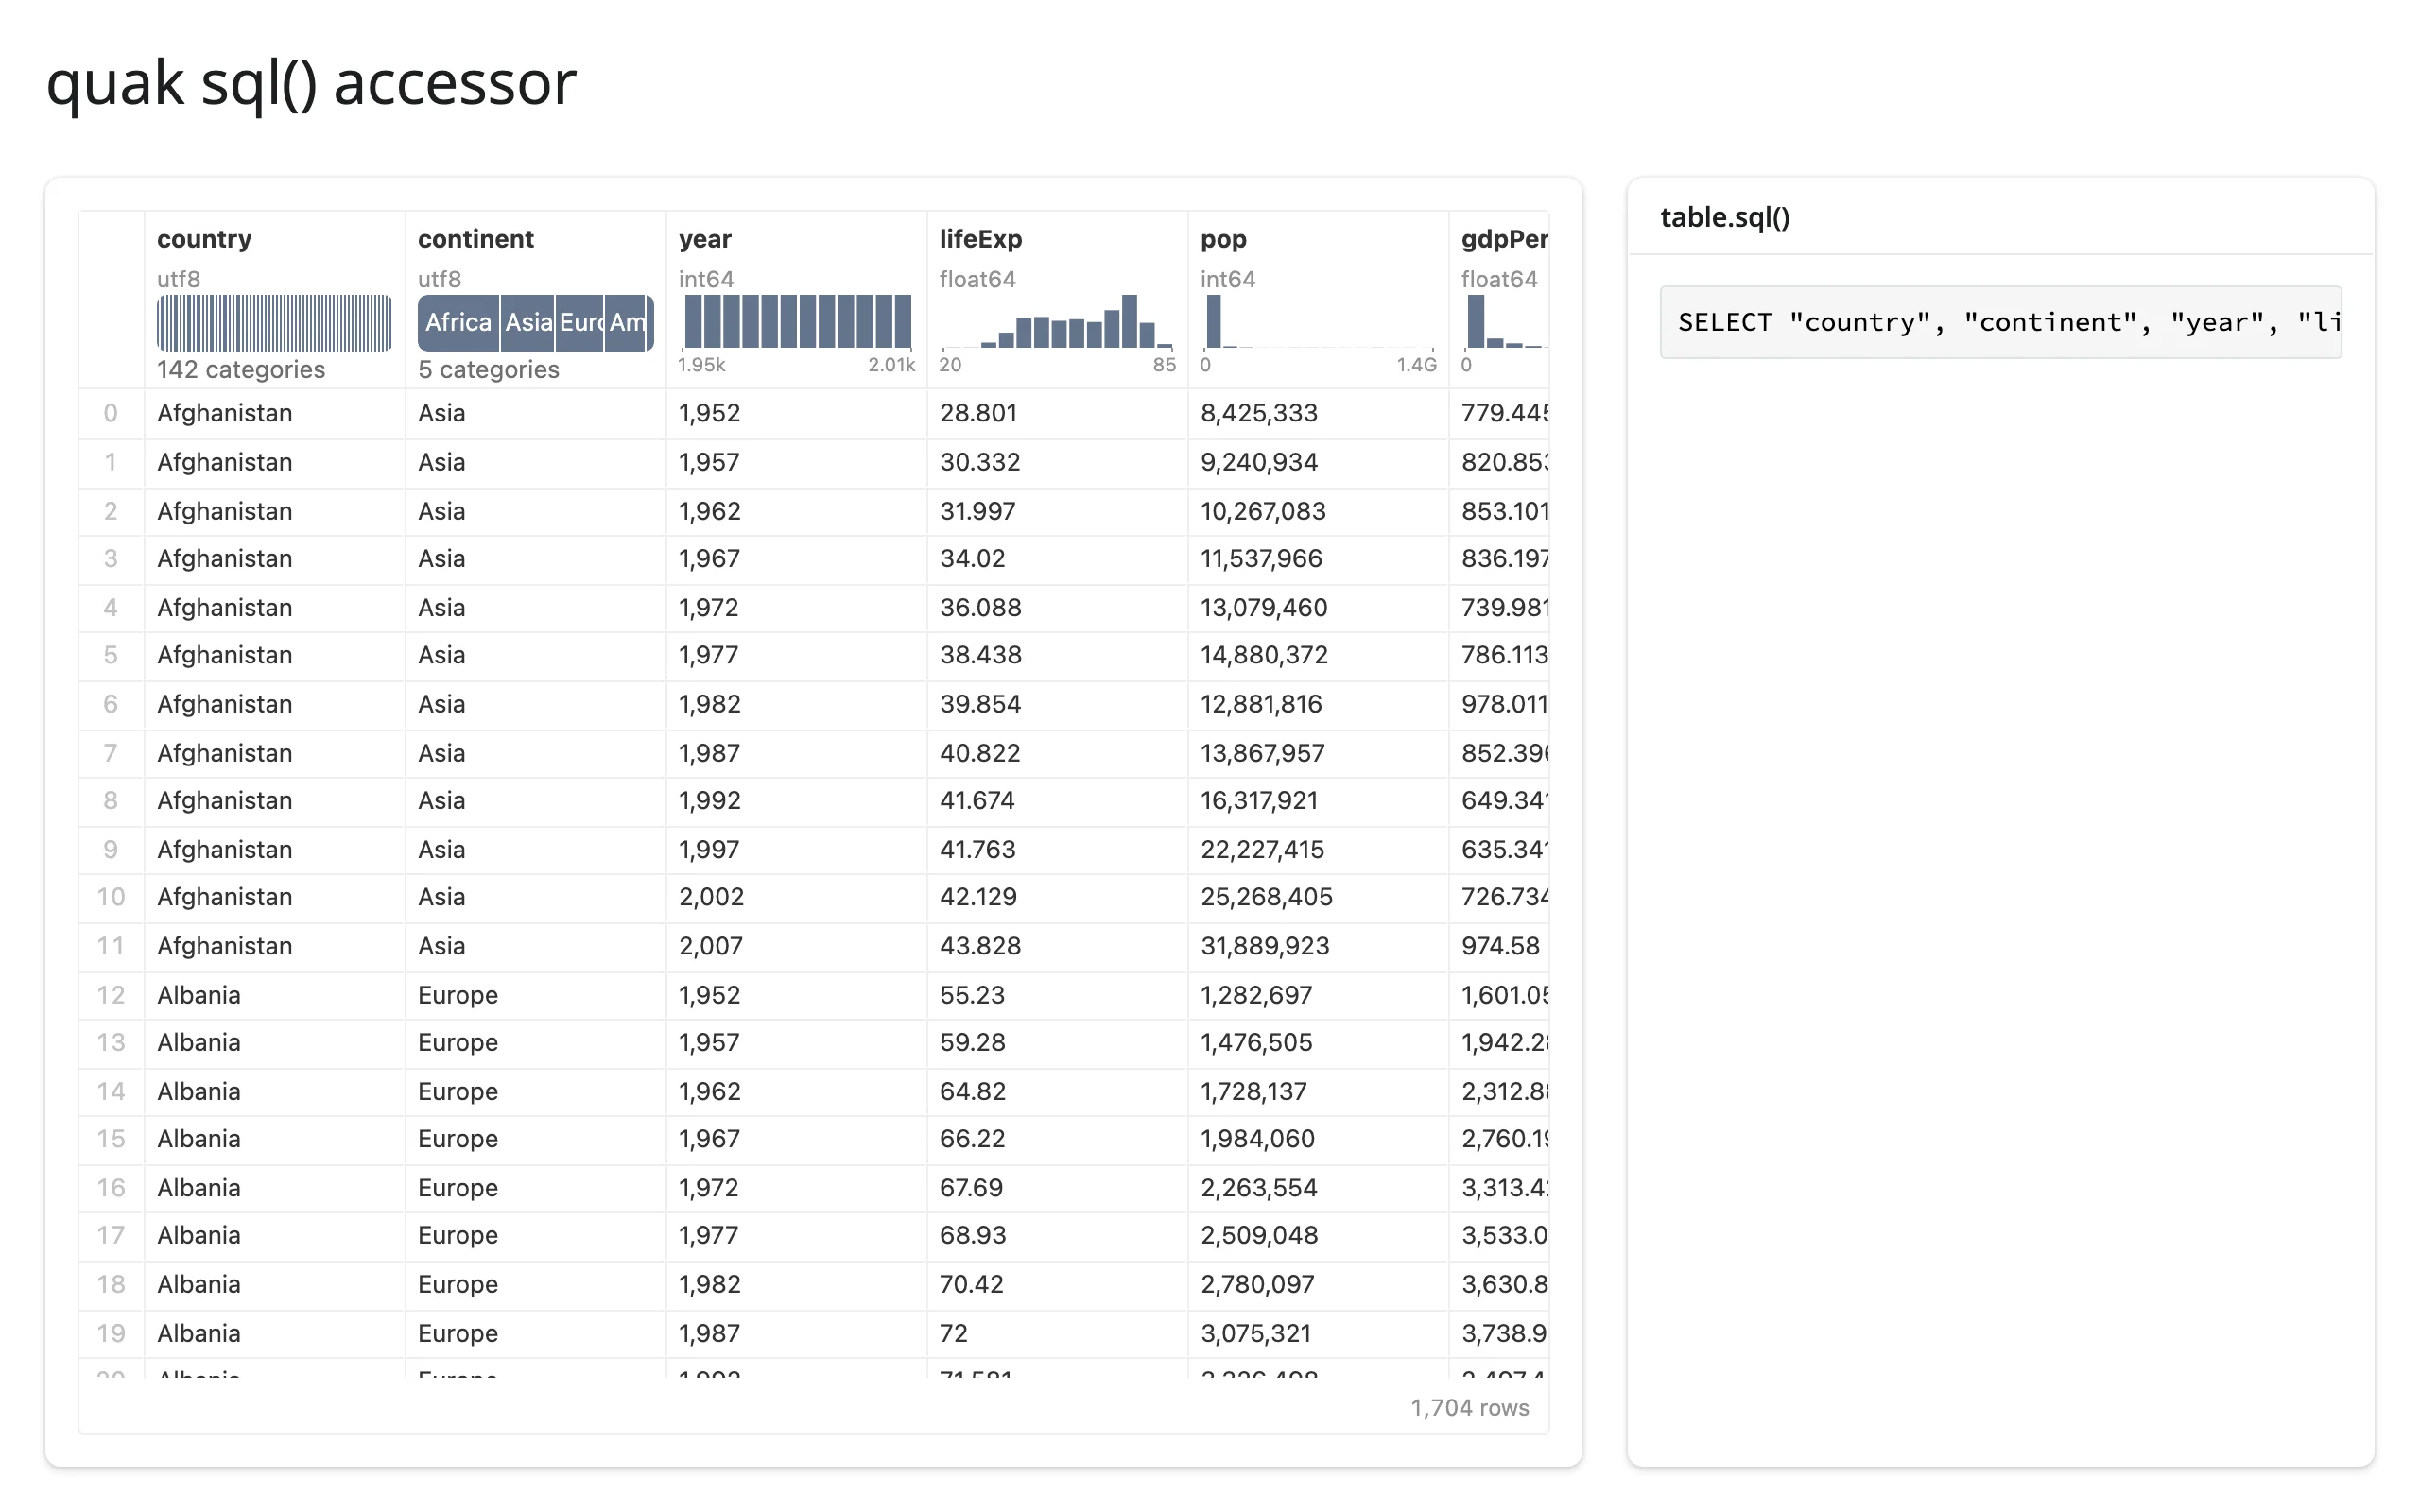
table.sql() is the exact SELECT statement for the table’s current sort and filter – read it to show users what’s currently selected, or to replay the same filter against a different query.
from __future__ import annotations

import plotly.express as px
from shiny.express import render, ui
from shinywidgets import render_quak

ui.page_opts(title="quak sql() accessor", fillable=True)
ui.tags.style("pre { white-space: pre-wrap; overflow-wrap: anywhere; }")

gapminder = px.data.gapminder()

with ui.layout_columns(col_widths=[8, 4]):
    with ui.card(full_screen=True):

        @render_quak
        def table():
            return gapminder

    with ui.card():
        ui.card_header("table.sql()")

        @render.code
        def sql():
            # No req() needed: this cancels on its own while quak's query is
            # still the empty string it syncs during initialization.
            return table.sql()
Sorting by life expectancy, then brushing a range of the lifeExp histogram, updates the published query with an ORDER BY and a WHERE ... BETWEEN ...:
data(): the matching rows, as a DuckDB relation
table.data() runs the published query and hands back a lazy duckdb.DuckDBPyRelation – call .df()/.pl() to materialize it, or .aggregate(...) to compute a summary without pulling every row into Python. It takes a dependency on sql(), so it re-runs on the same schedule.
from __future__ import annotations

import plotly.express as px
from shiny.express import render, ui
from shinywidgets import render_quak

ui.page_opts(title="quak data() accessor", fillable=True)

gapminder = px.data.gapminder()

with ui.layout_columns(col_widths=[8, 4]):
    with ui.card(full_screen=True):

        @render_quak
        def table():
            return gapminder

    with ui.layout_columns(col_widths=12):
        with ui.value_box():
            "Countries x years selected"

            @render.text
            def n_rows():
                return f"{table.data().aggregate('count(*)').fetchall()[0][0]:,}"

        with ui.value_box():
            "Median life expectancy"

            @render.text
            def median_life_exp():
                value = table.data().aggregate("median(lifeExp)").fetchall()[0][0]
                return f"{value:.1f} years"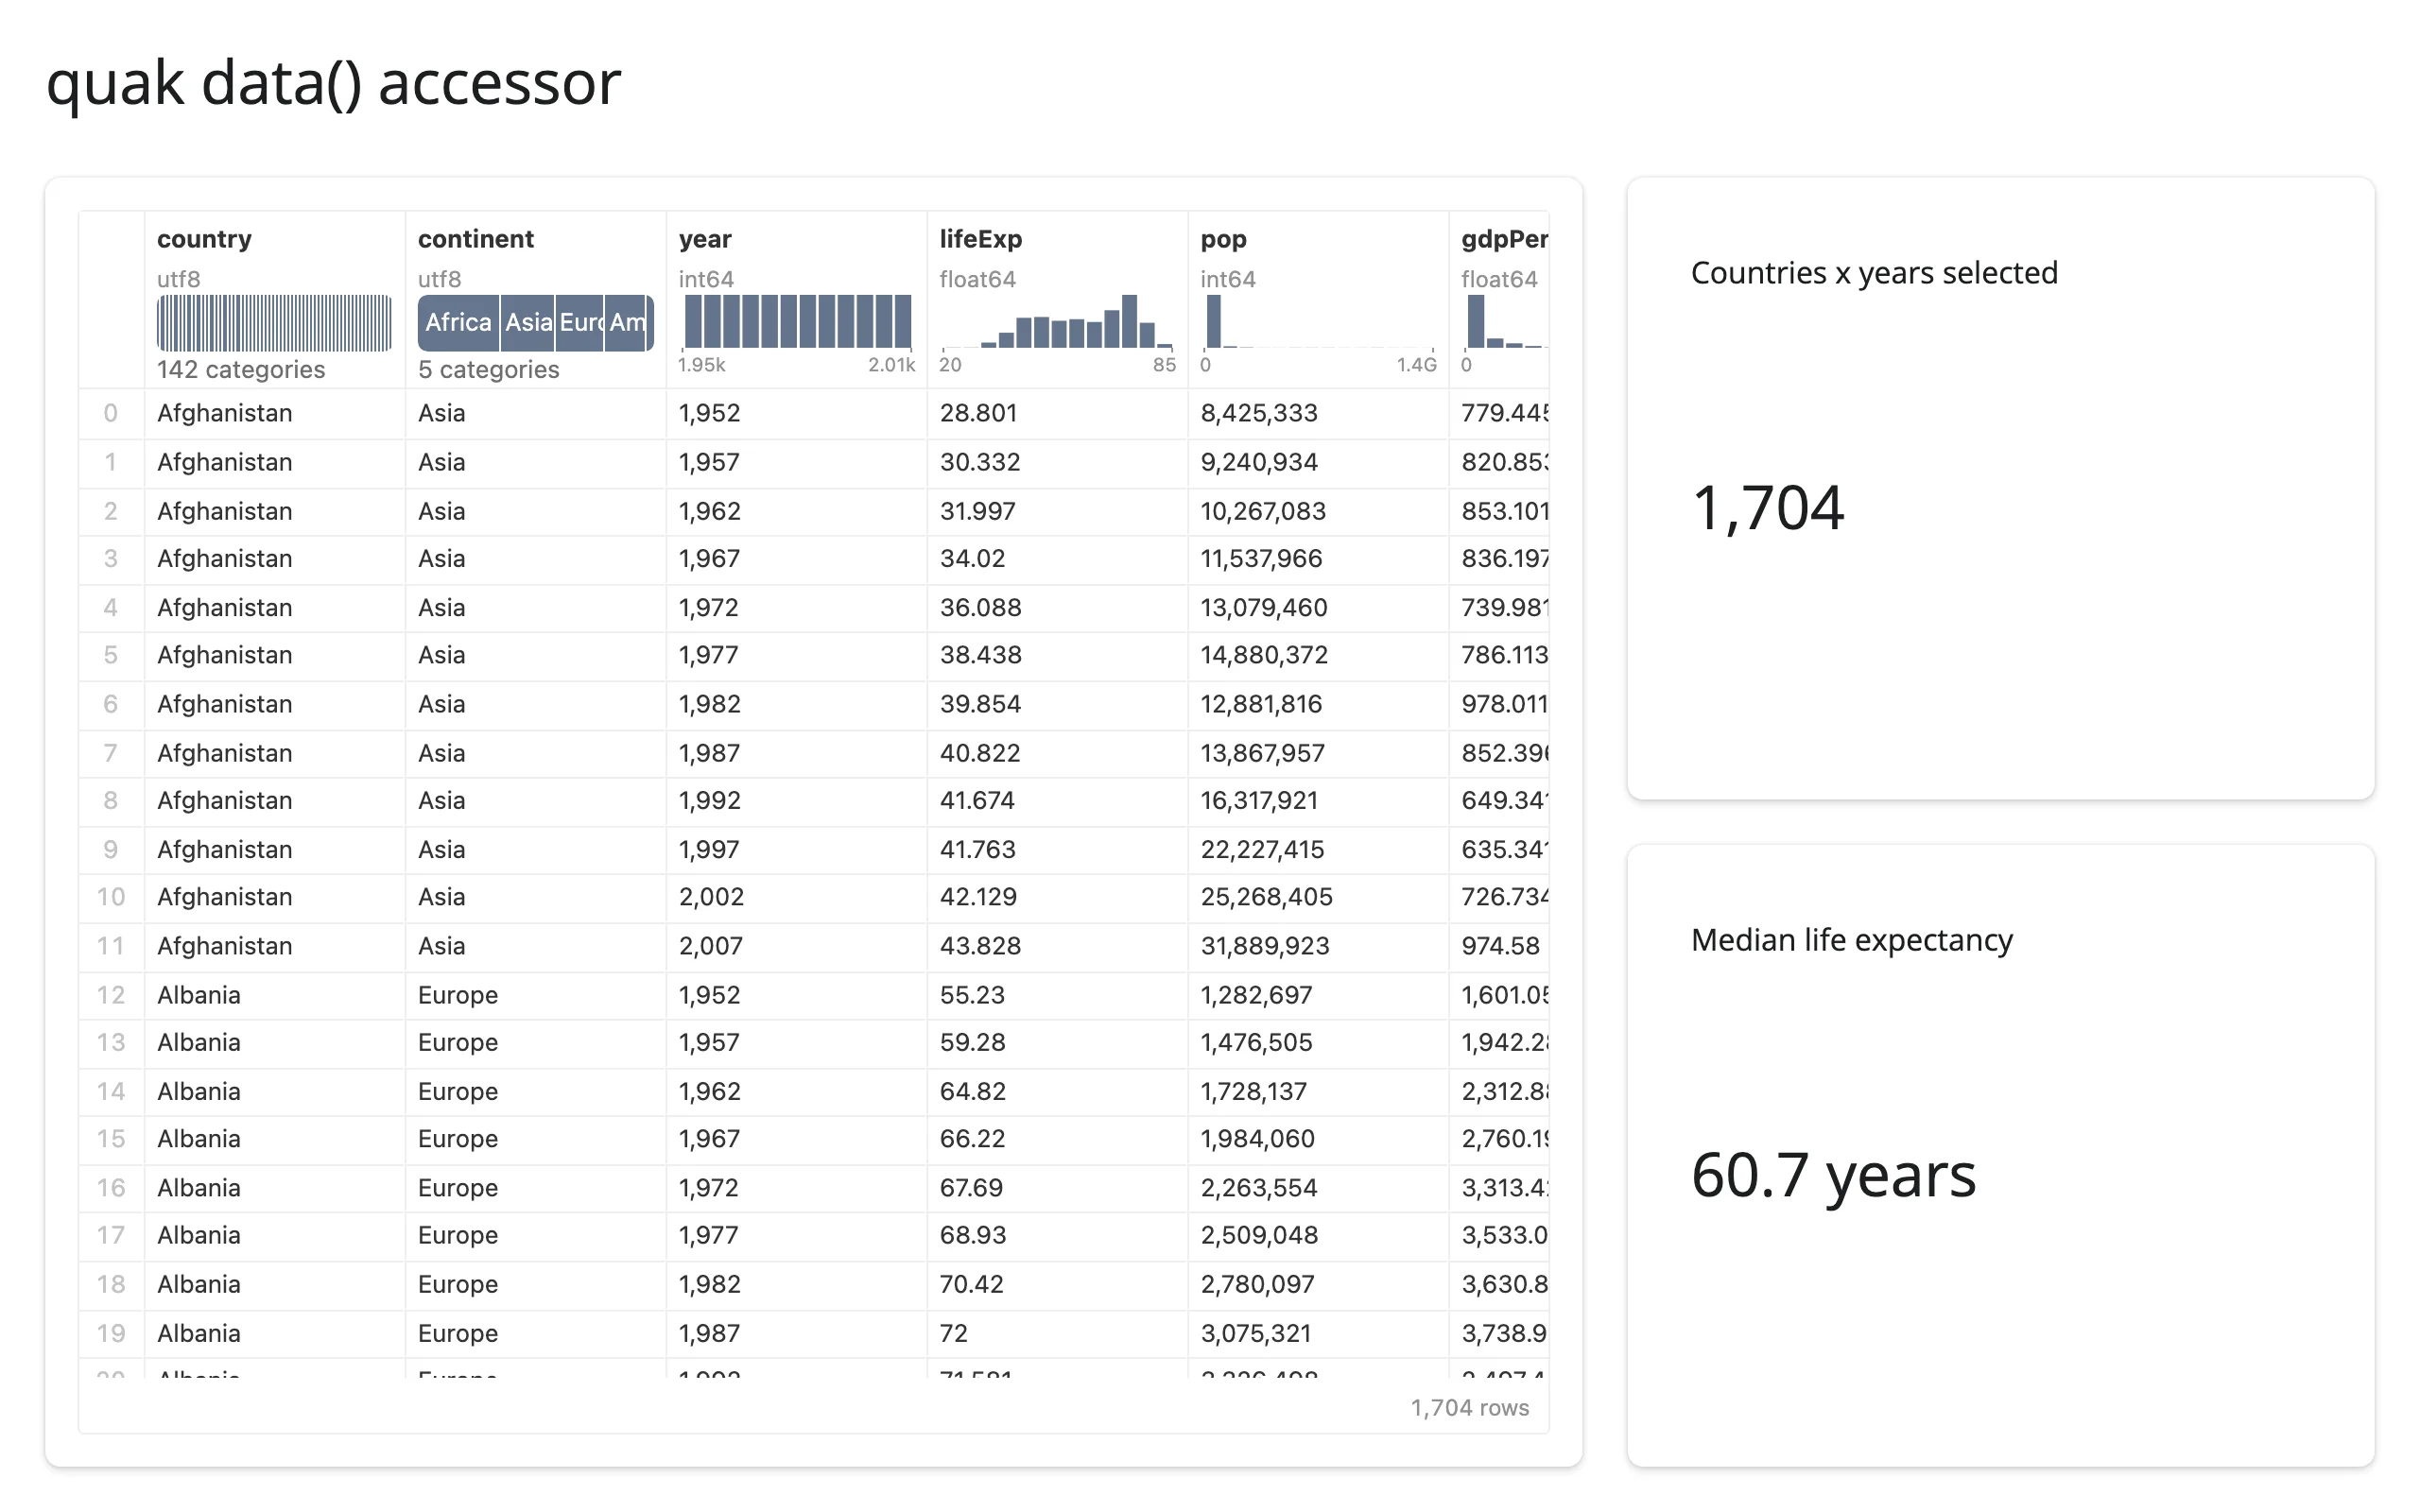
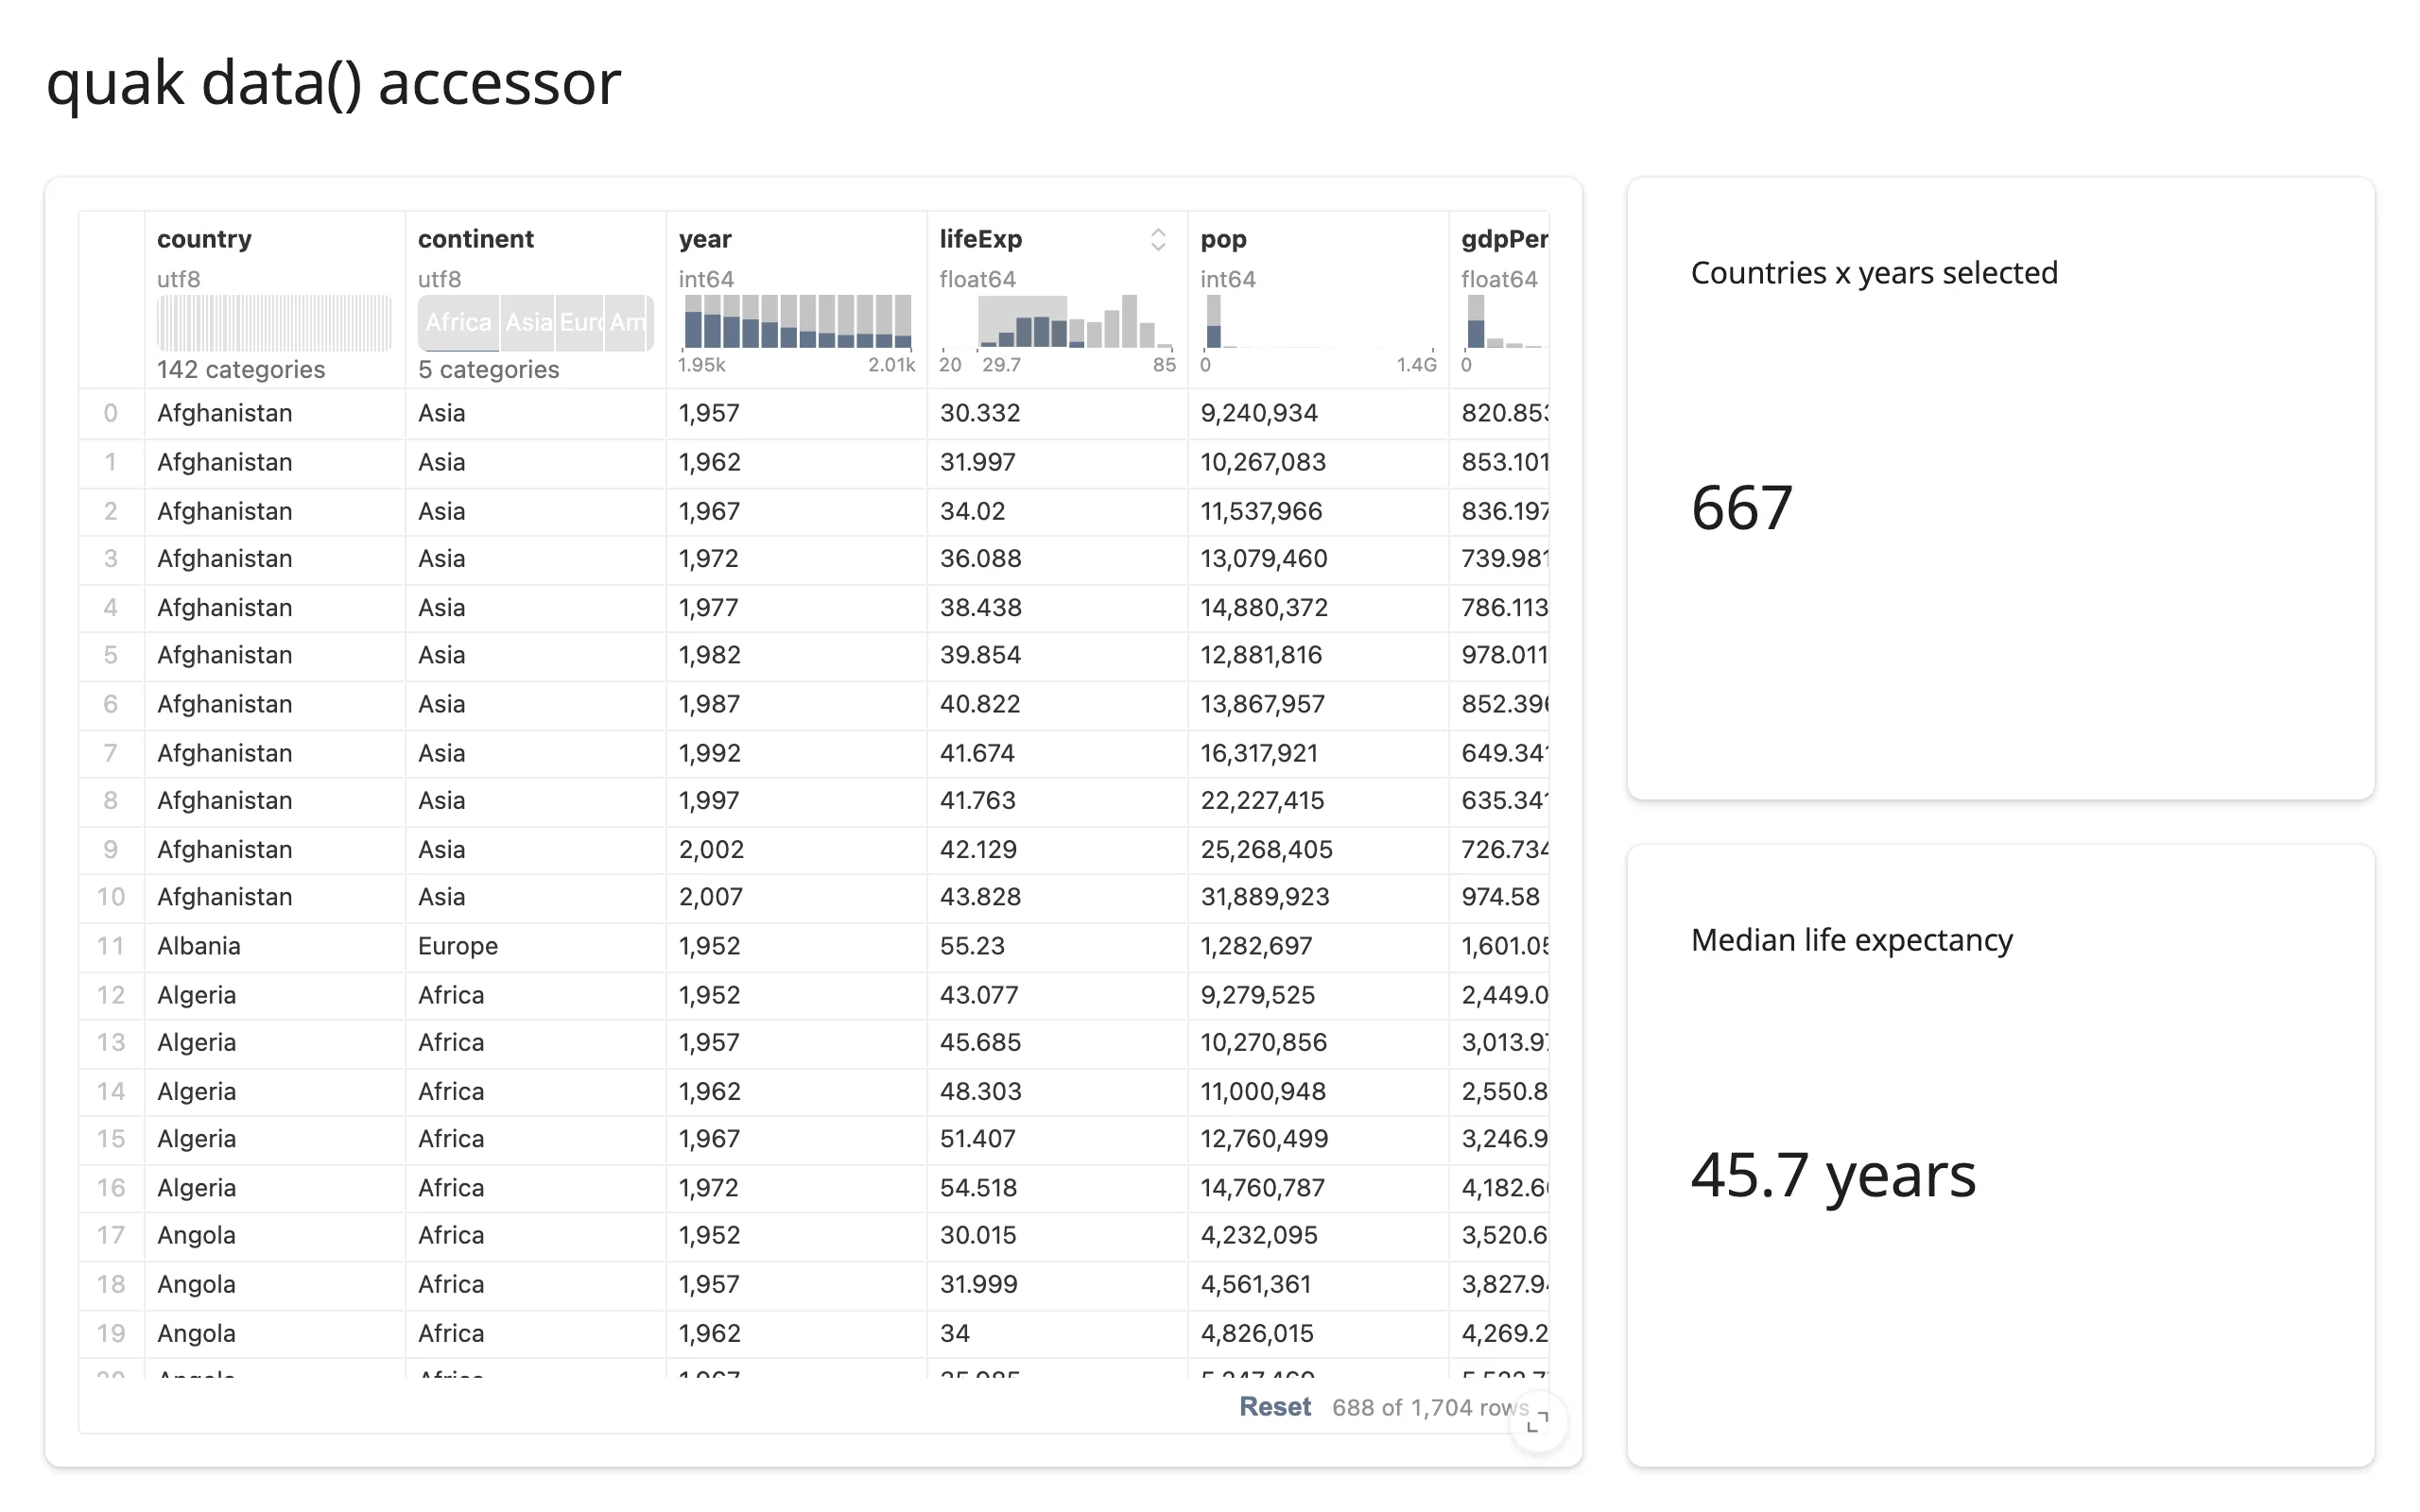
Notice the value box reads 667 selected rows after the same brush that made quak’s own status bar say 688 of 1,704. That’s not a bug in this example – it’s quak’s status-bar count disagreeing with the exact row count of its own published query (see Gotchas). Treat table.data(), not the status bar text, as the source of truth.
Beyond the accessors: table.read(name)
There isn’t much else worth reading. quak’s only other traits are internal (_table_name, _columns, leading underscore and all) and not meant to be read from outside the widget; sql() and data() already cover the table’s entire interactive surface. If a future quak release adds a public trait worth watching, table.read("that_trait") reads it reactively (falling through to reactive_read() on the rendered widget) without an import beyond shinywidgets – prefer it over calling reactive_read(table.widget, "trait") directly.
Rate limiting
A brush drag can fire quak’s sql trait around 20 times before the mouse comes up, and each change to table.sql() potentially re-runs a DuckDB query in table.data(). The accessors debounce at 250 ms by default to collapse that into one update per settled gesture, which is enough for almost every use – the value box and chart examples above both got away with no DuckDB work beyond the final filter. Pass rate_policy="throttle" to render_quak (and/or a smaller rate_delay) if you need periodic snapshots while the user is still dragging, for example to drive a progress indicator; pass rate_delay=0 to disable rate limiting entirely and see every raw update (useful for debugging, not for production, since several of those raw updates carry the no-filter query quak syncs mid-gesture – see Gotchas).
Updating the widget from Python
quak’s sql trait is read-only: setting table.widget.sql = "..." from Python changes nothing in the browser. The only thing worth mutating in place is layout – typically .layout.height, inherited from ipywidgets. Doing that on the already-rendered widget keeps the same quak instance, and so keeps whatever filter or sort the user had in progress; re-running the @render_quak function instead always builds a fresh quak.Widget, which loses it (quak has no way to hand a filter back in on construction).
from __future__ import annotations

import plotly.express as px
import quak
from shiny import reactive
from shiny.express import input, render, ui
from shinywidgets import render_quak

ui.page_opts(title="quak: resize in place vs. re-render")

gapminder = px.data.gapminder()

ui.input_action_button("grow", "Grow the table (in place)")
ui.input_action_button("rerender", "Re-render the table")


@render.code
def sql():
    return table.sql()


with ui.card():
    # A roomy fixed height on the output itself, so toggling the widget's own
    # (smaller) layout.height below is never clipped by the output container.
    @render_quak(height="700px")
    def table():
        # Brush or sort, then click "Re-render": this function re-runs and
        # builds a brand-new quak.Widget, so the filter/sort is gone -- quak
        # has no way to hand a filter back in on construction.
        input.rerender()
        widget = quak.Widget(gapminder)
        widget.layout.height = "250px"
        return widget


@reactive.effect
@reactive.event(input.grow)
def _():
    # Mutating the already-rendered widget keeps the same quak instance, and
    # so keeps whatever the user had brushed or sorted, unlike re-rendering.
    current = table.widget.layout.height
    table.widget.layout.height = "650px" if current != "650px" else "250px"
Brush a filter, then click “Grow the table”: the table grows from 250px to 650px and the filter (visible in the query text and the “688 of 1,704” count) is untouched.
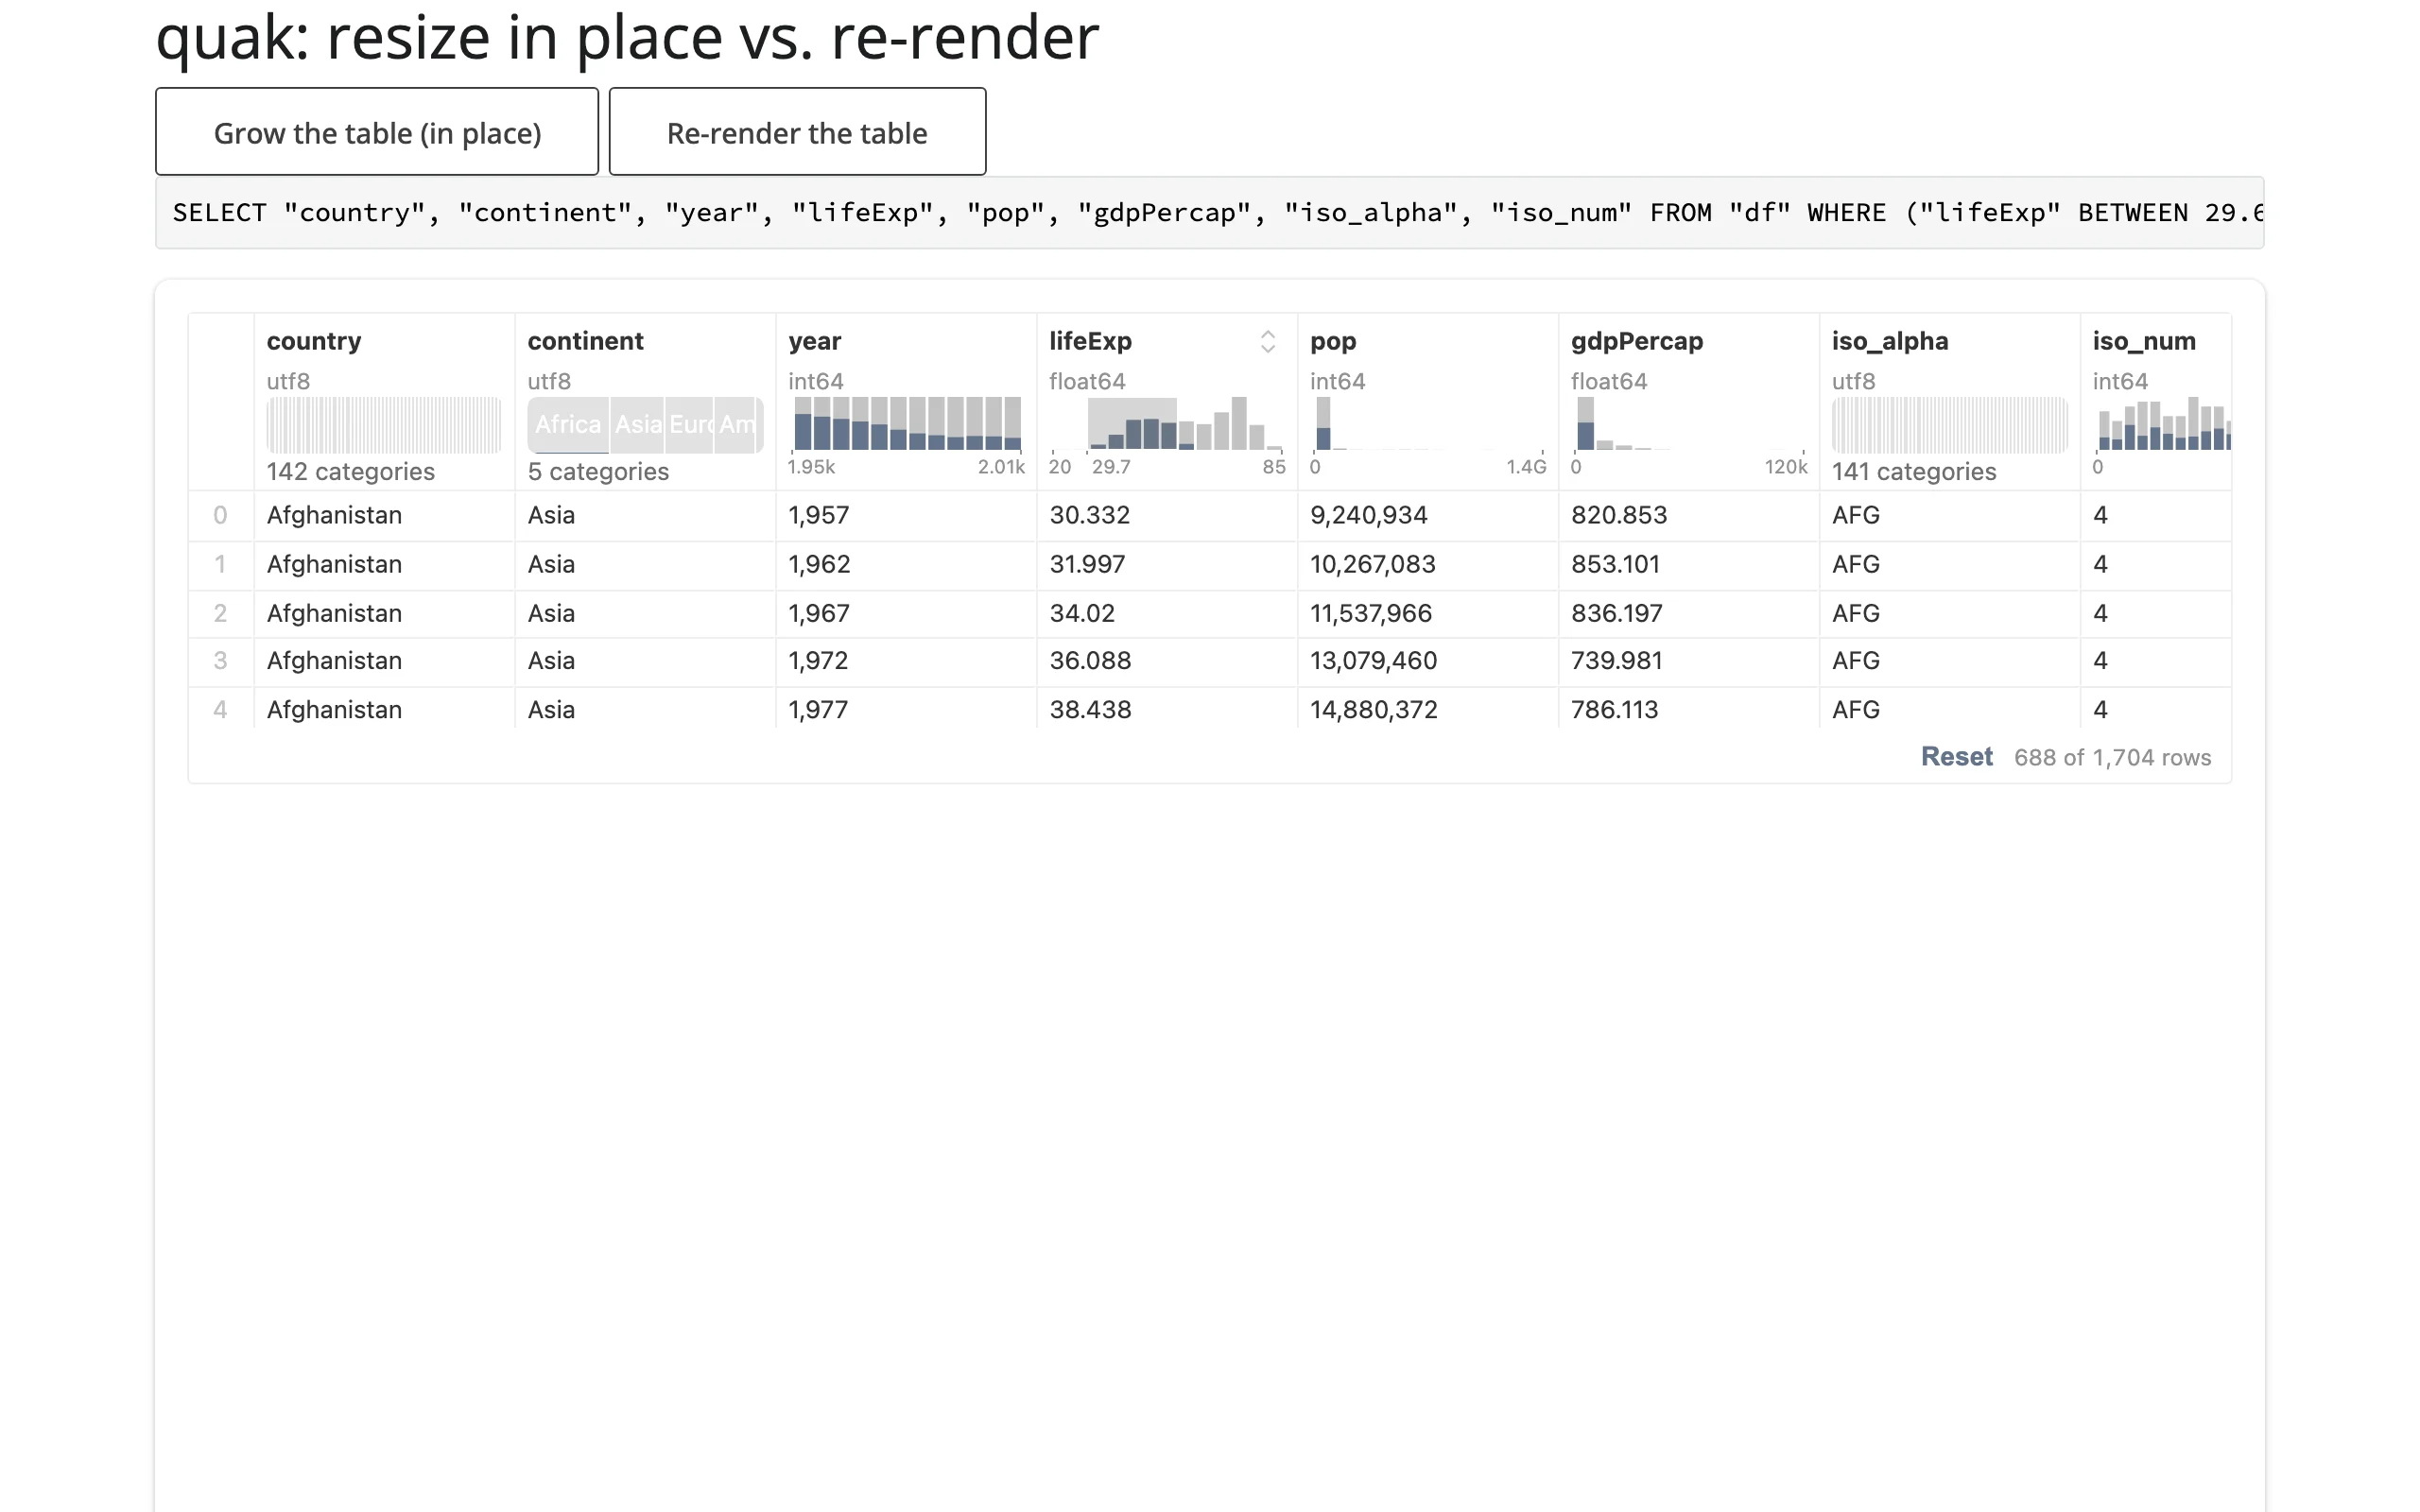
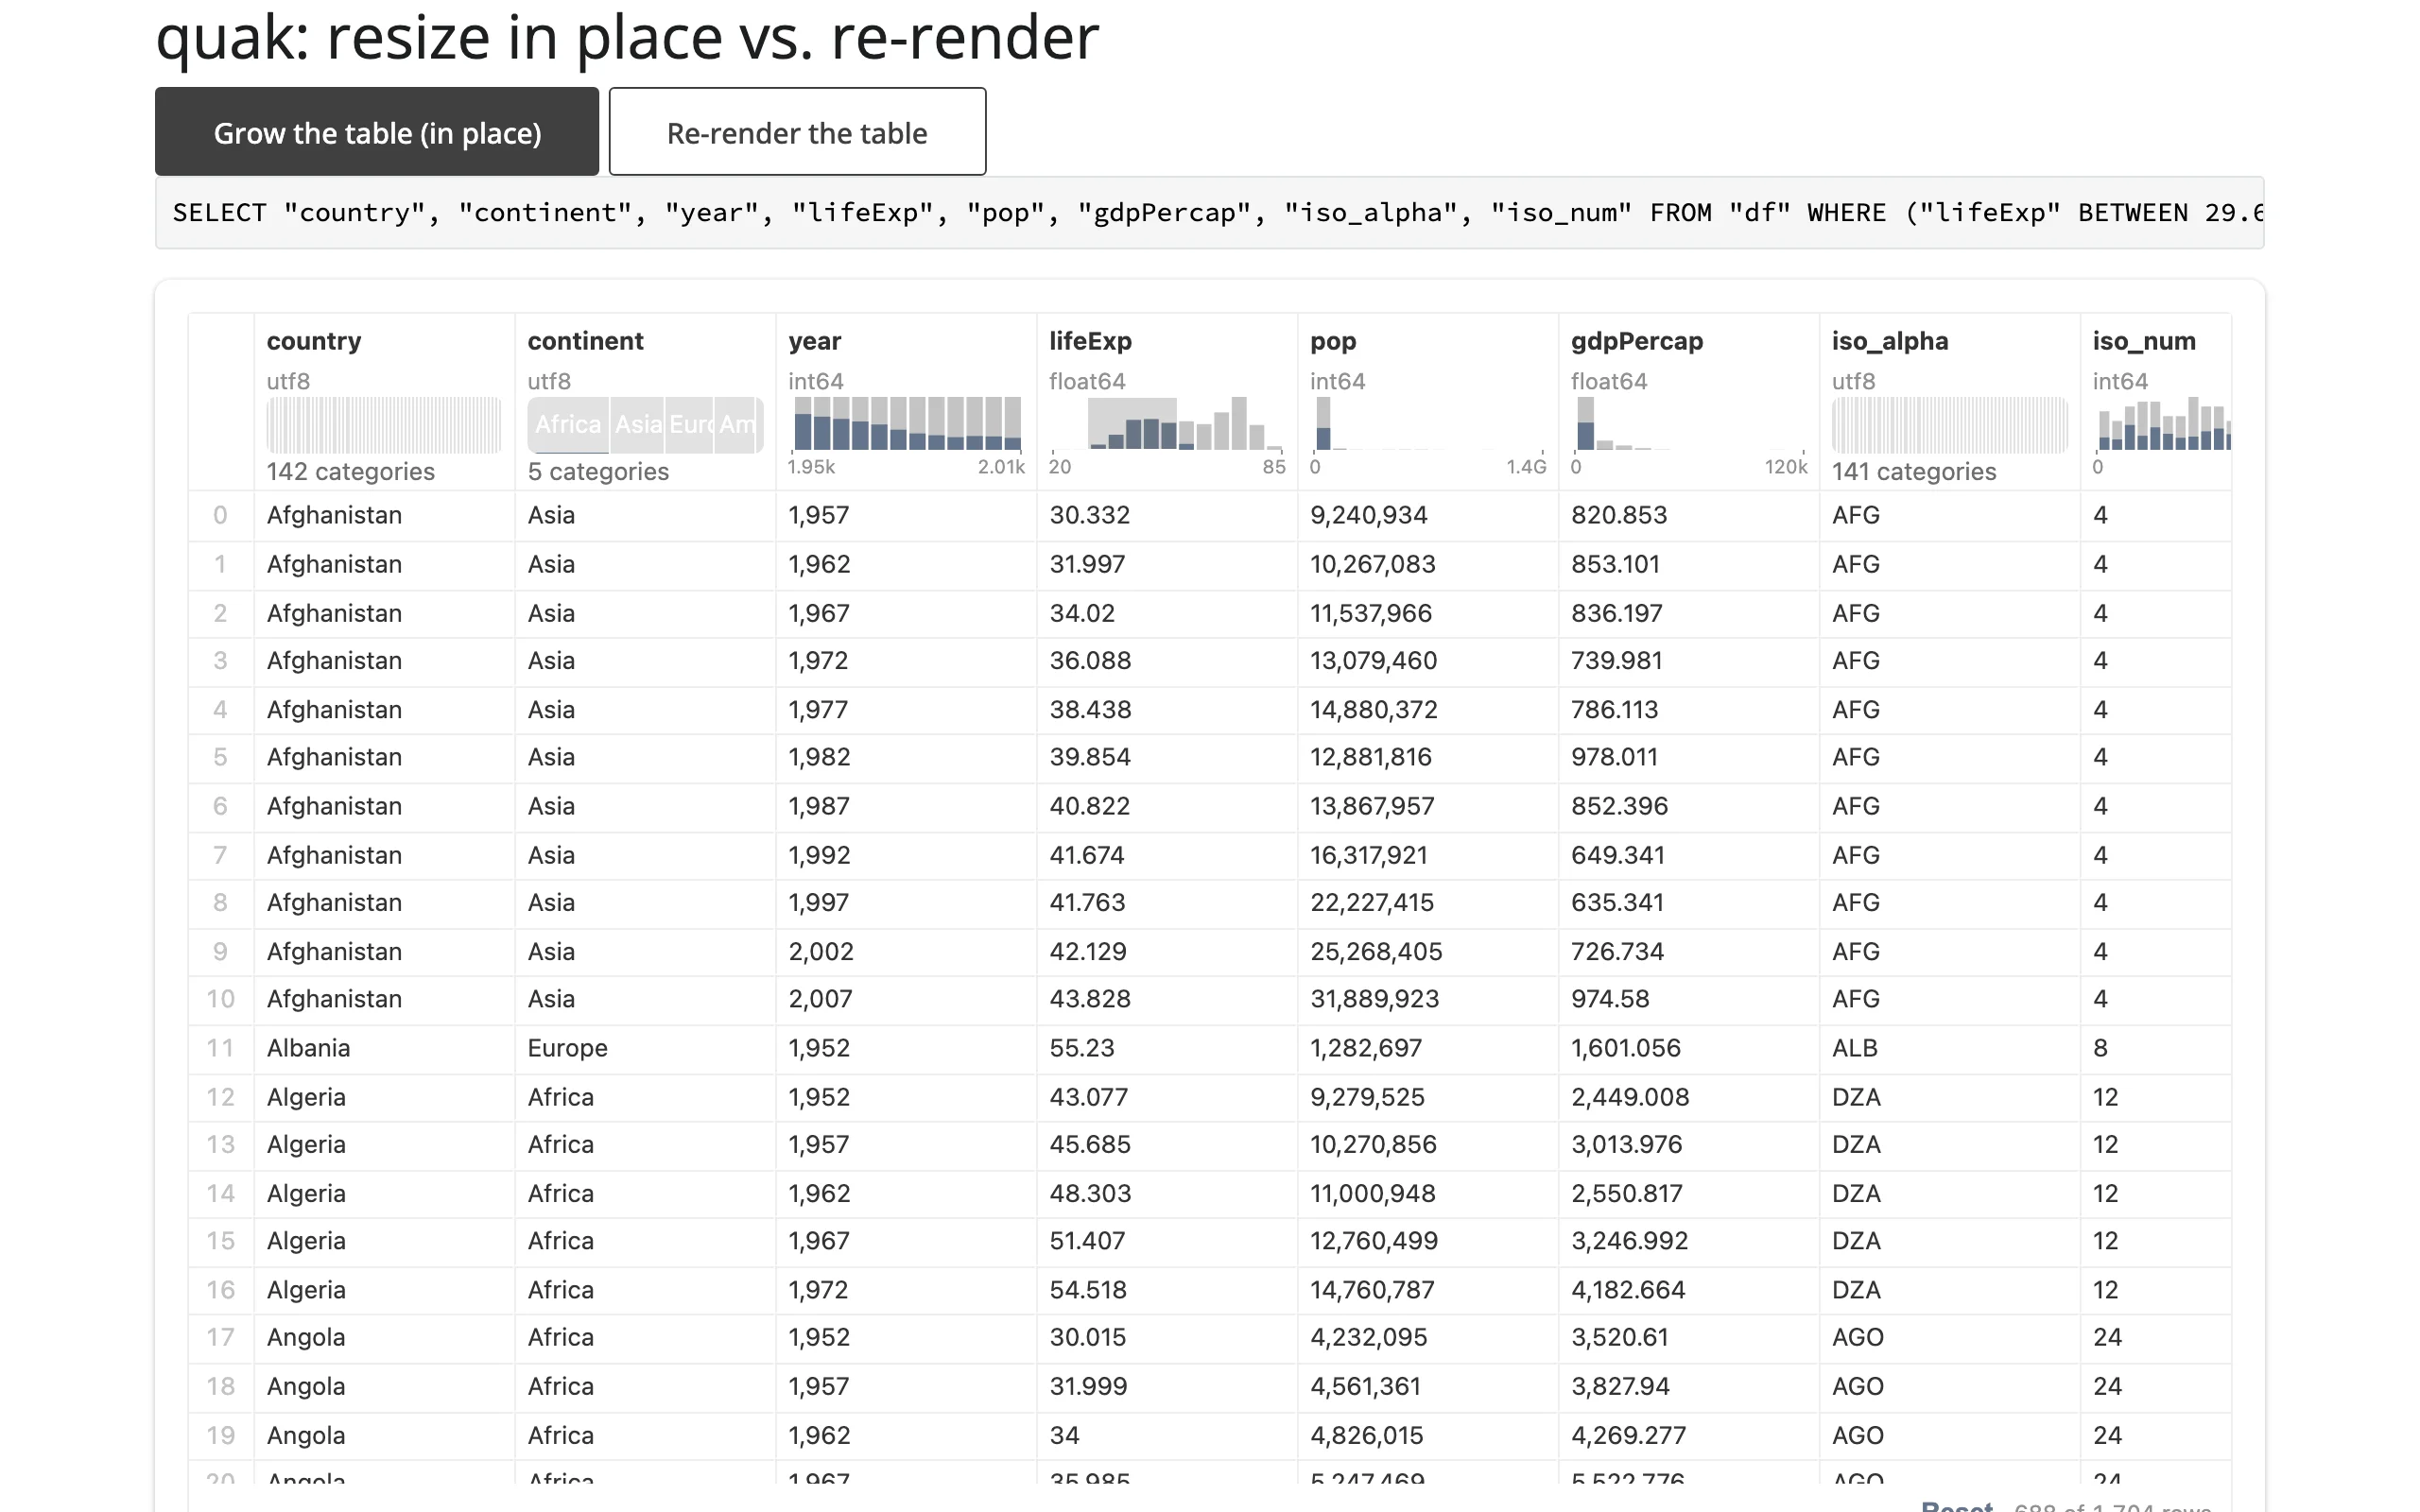
One sizing note this example relies on: when an output fills its container (the default, and what every other example in this guide uses), that fill behavior wins over a manually-set layout.height – the table stretches to the container regardless. Give the output an explicit, roomy height= (as above) when you want layout.height itself to be the thing that visibly changes.
Coordinating multiple views
These three patterns all follow the same shape: read table.data() once, then drive something else from it. Share one @reactive.calc if more than one output needs it, since each .data() call re-runs its query.
Filtered rows -> summary stats
Already shown above in the data() section: two value boxes recomputed from table.data().aggregate(...), reading exactly the filtered rows. See examples/05_accessor_data_summary.py and the screenshots there.
Filtered rows -> a plot of exactly those rows
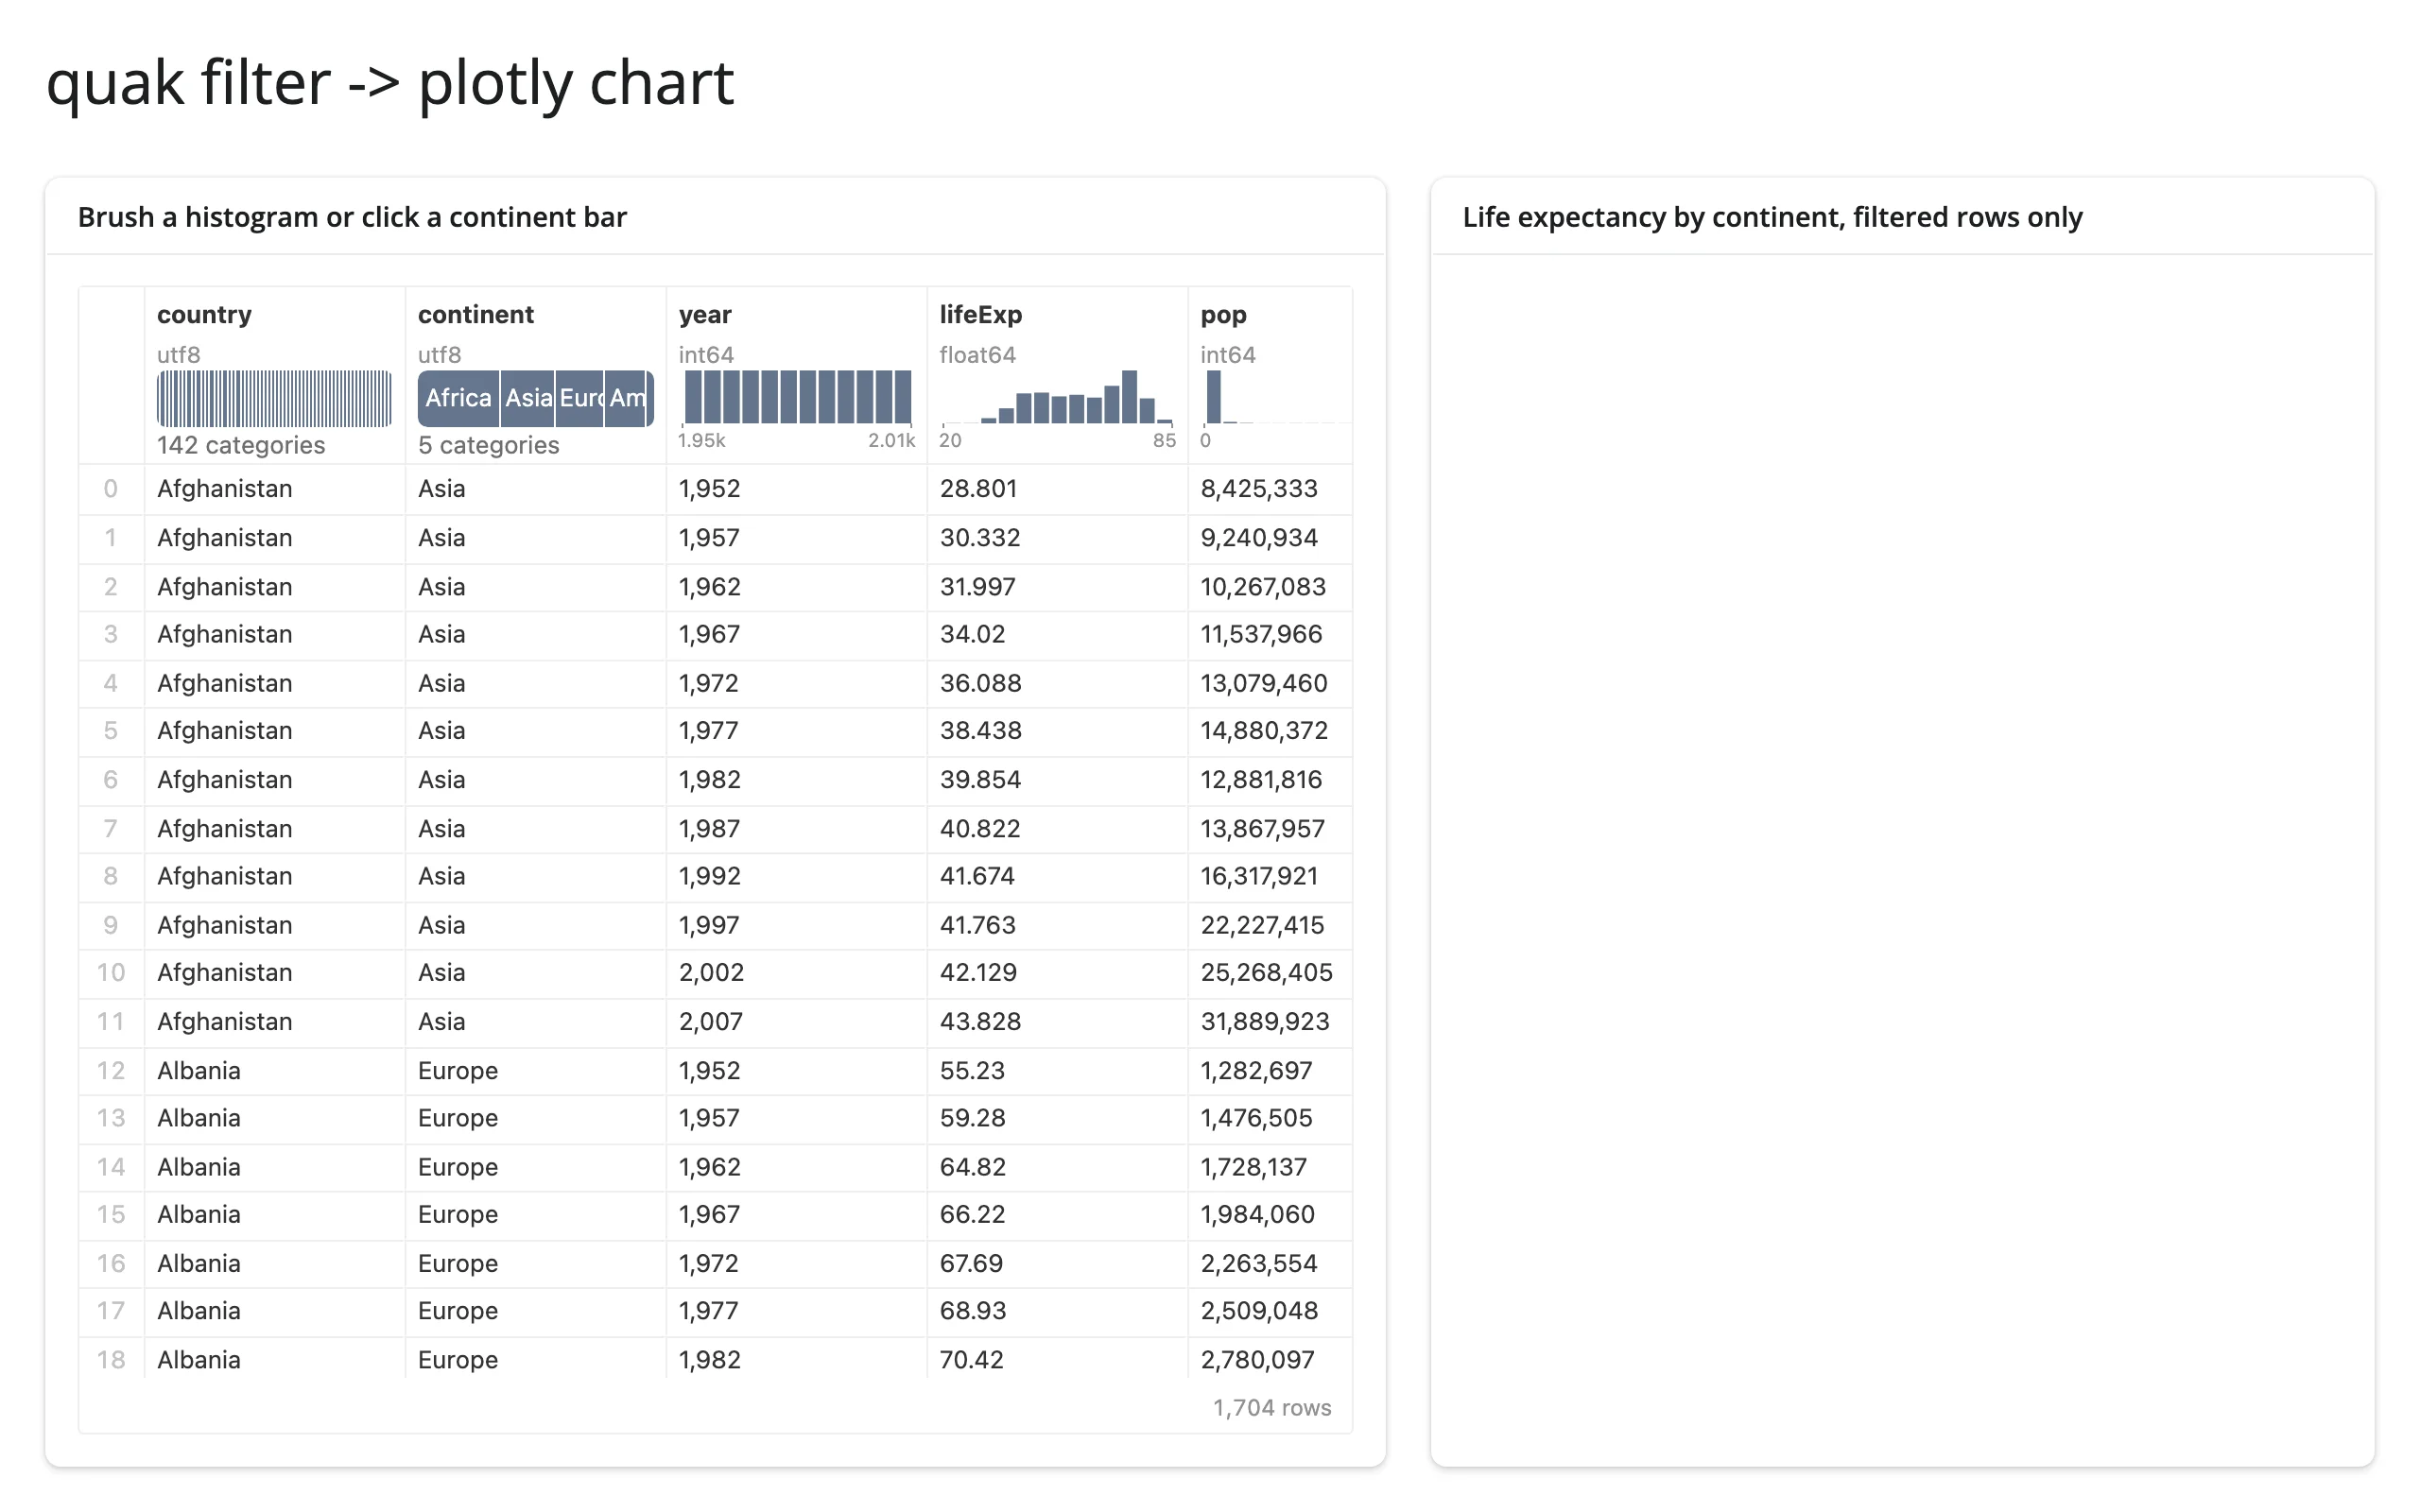
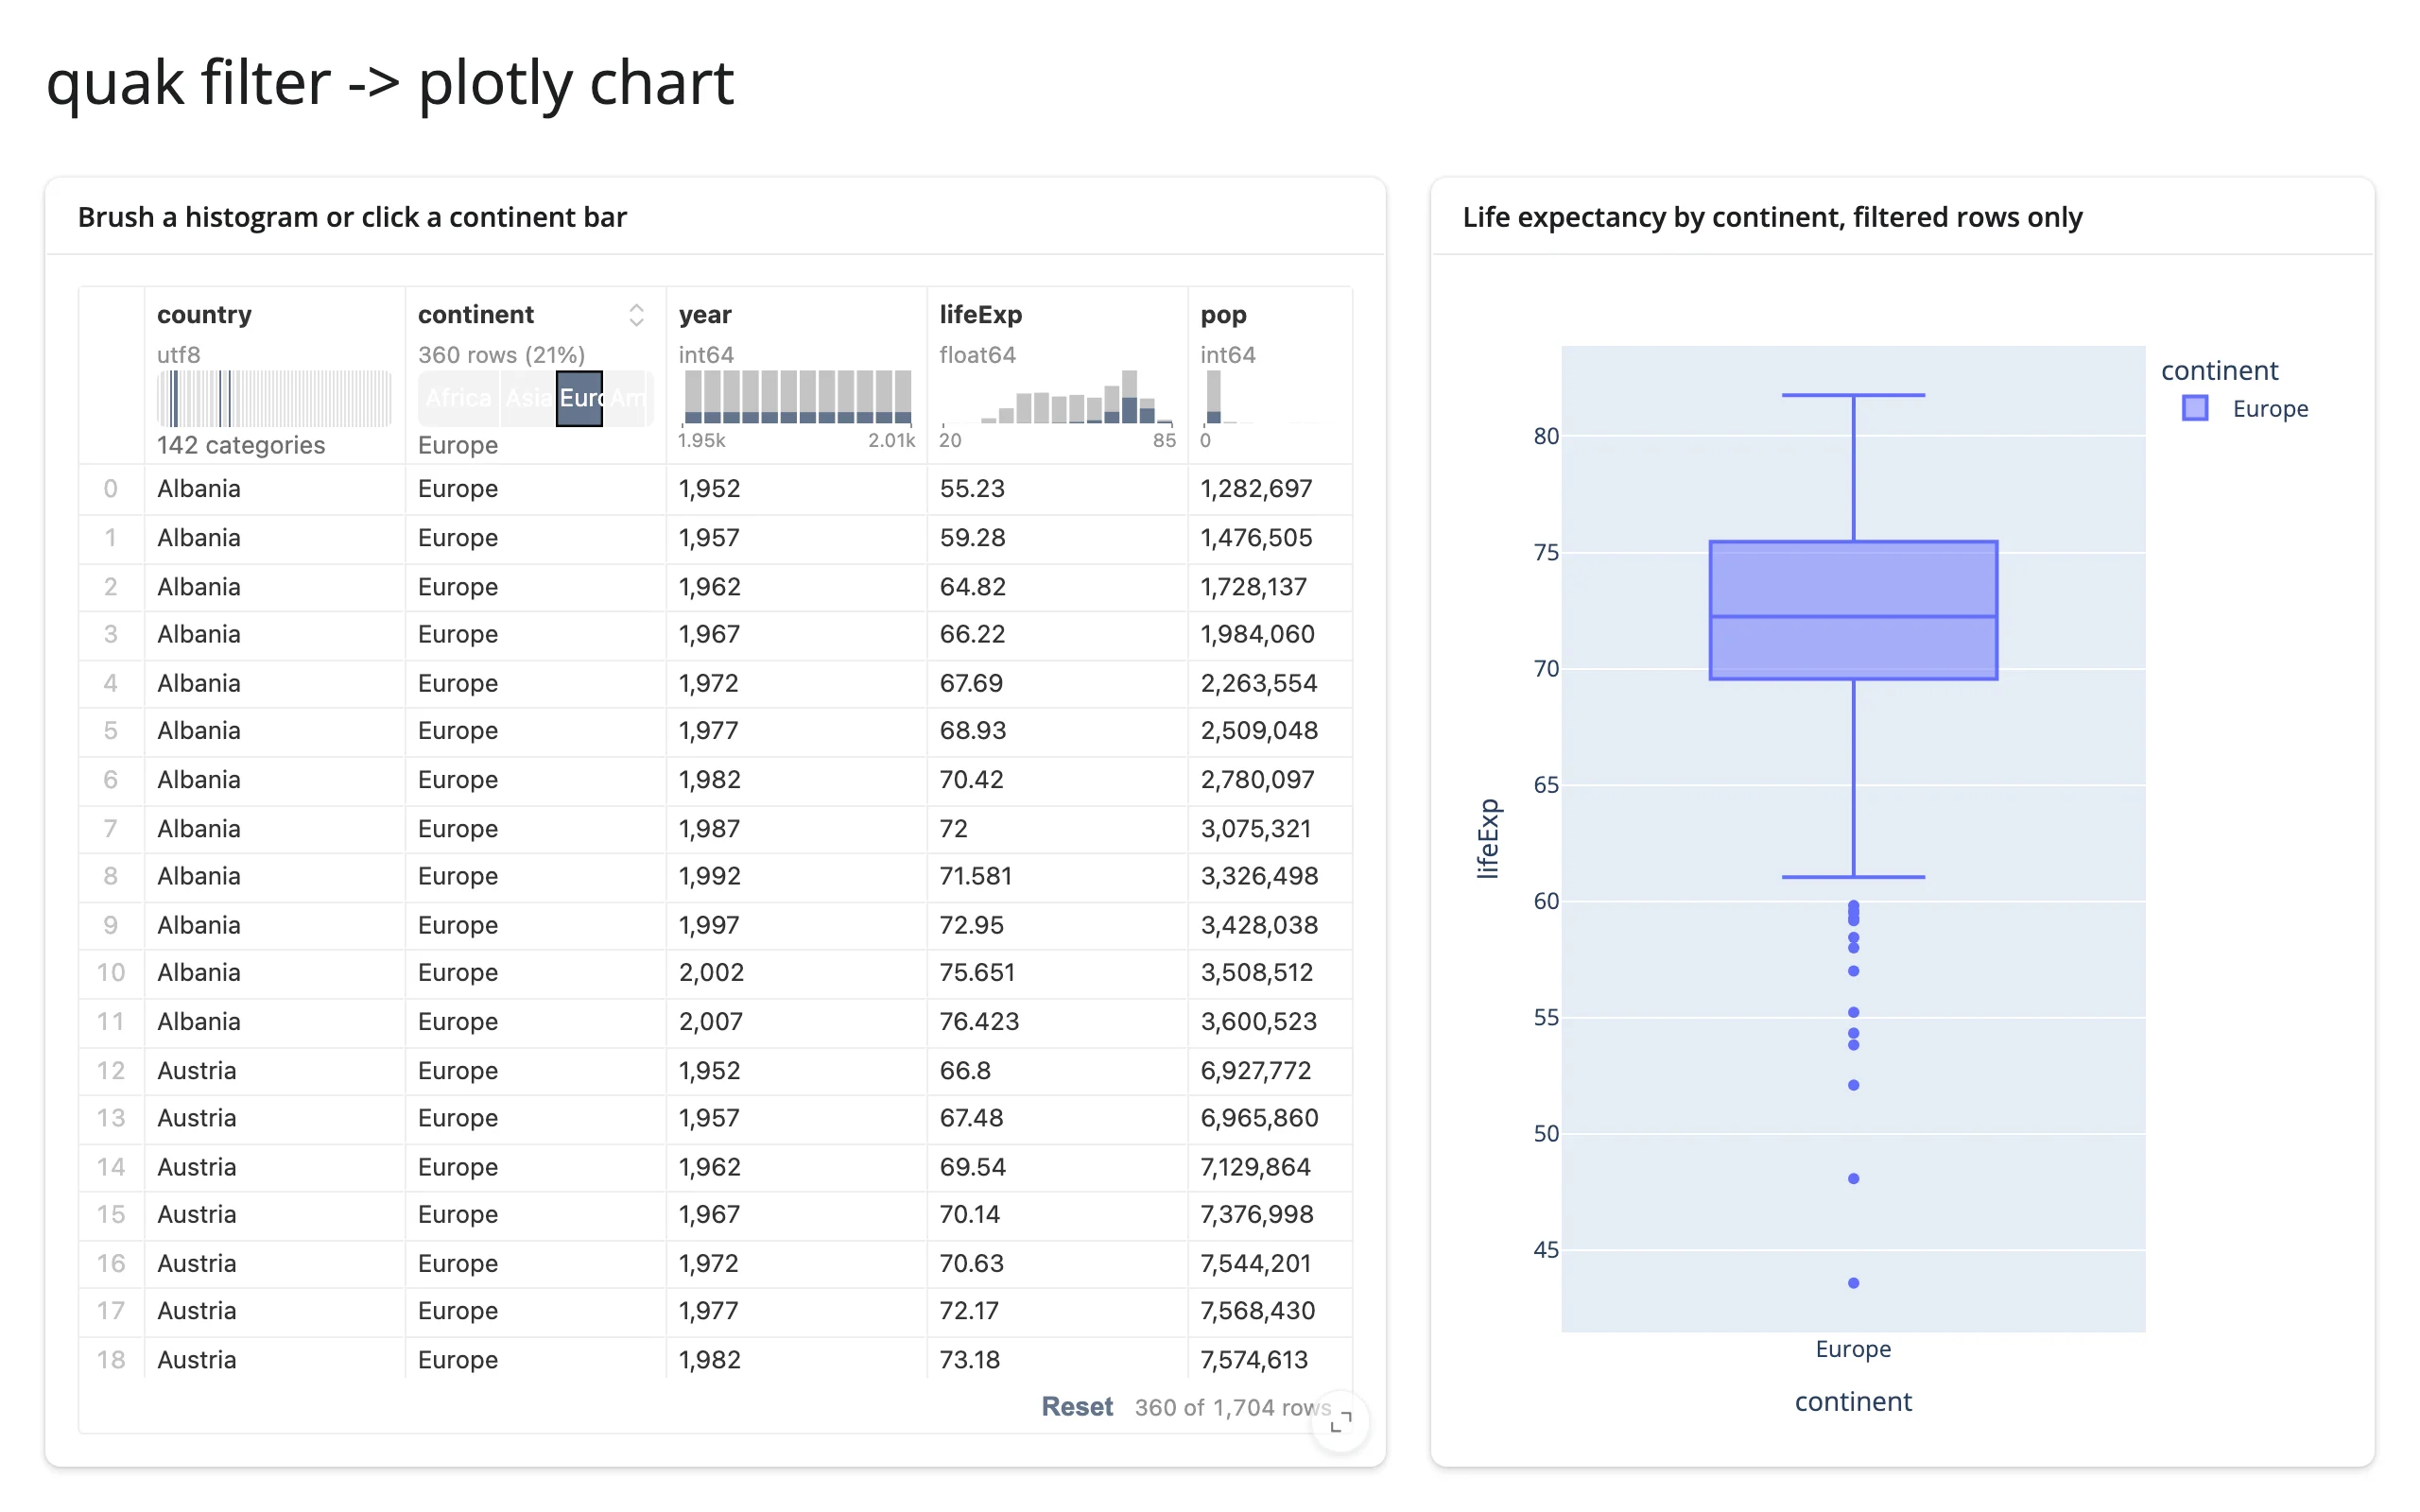
A chart in a neighboring card, built from table.data().df(), always matches what the table shows – useful when a user wants a different view (here, a distribution) of the same selection, not just a row count.
from __future__ import annotations

import plotly.express as px
from shiny.express import render, ui
from shinywidgets import render_plotly, render_quak

ui.page_opts(title="quak filter -> plotly chart", fillable=True)

gapminder = px.data.gapminder()

with ui.layout_columns(col_widths=[7, 5]):
    with ui.card(full_screen=True):
        ui.card_header("Brush a histogram or click a continent bar")

        @render_quak
        def table():
            return gapminder

    with ui.card(full_screen=True):
        ui.card_header("Life expectancy by continent, filtered rows only")

        @render_plotly
        def chart():
            # Re-runs (debounced) whenever table.sql() changes, so the bars
            # always describe exactly the rows quak is showing.
            filtered = table.data().df()
            return px.box(filtered, x="continent", y="lifeExp", color="continent")
Clicking the “Europe” bar in the continent column filters the table to European country-years, and the box plot redraws from exactly those rows:
(Pairs with: plotly.)
Filtered rows -> CSV download
table.data() powers an export just as easily as a chart – the download always matches what’s on screen, not the full dataset. This is also a good example of reading on demand: the accessor is live from the moment the table renders, so the download handler below can read table.data() the instant the user clicks Download, with no warm-up and no earlier read required to “arm” it.
from __future__ import annotations

import plotly.express as px
from shiny import render
from shiny.express import ui
from shinywidgets import render_quak

ui.page_opts(title="quak filter -> CSV download", fillable=True)

gapminder = px.data.gapminder()

with ui.layout_columns(col_widths=[9, 3]):
    with ui.card(full_screen=True):

        @render_quak
        def table():
            return gapminder

    with ui.card():
        ui.card_header("Export")
        "Download exactly the rows currently shown (after sorting/filtering)."

        @render.download_button(filename="gapminder_filtered.csv", label="Download CSV")
        def download():
            # table.data() cancels (like an unrendered output) while quak's
            # query is still settling, so the button is simply unusable until
            # a query exists -- no error handling needed here.
            yield table.data().df().to_csv(index=False)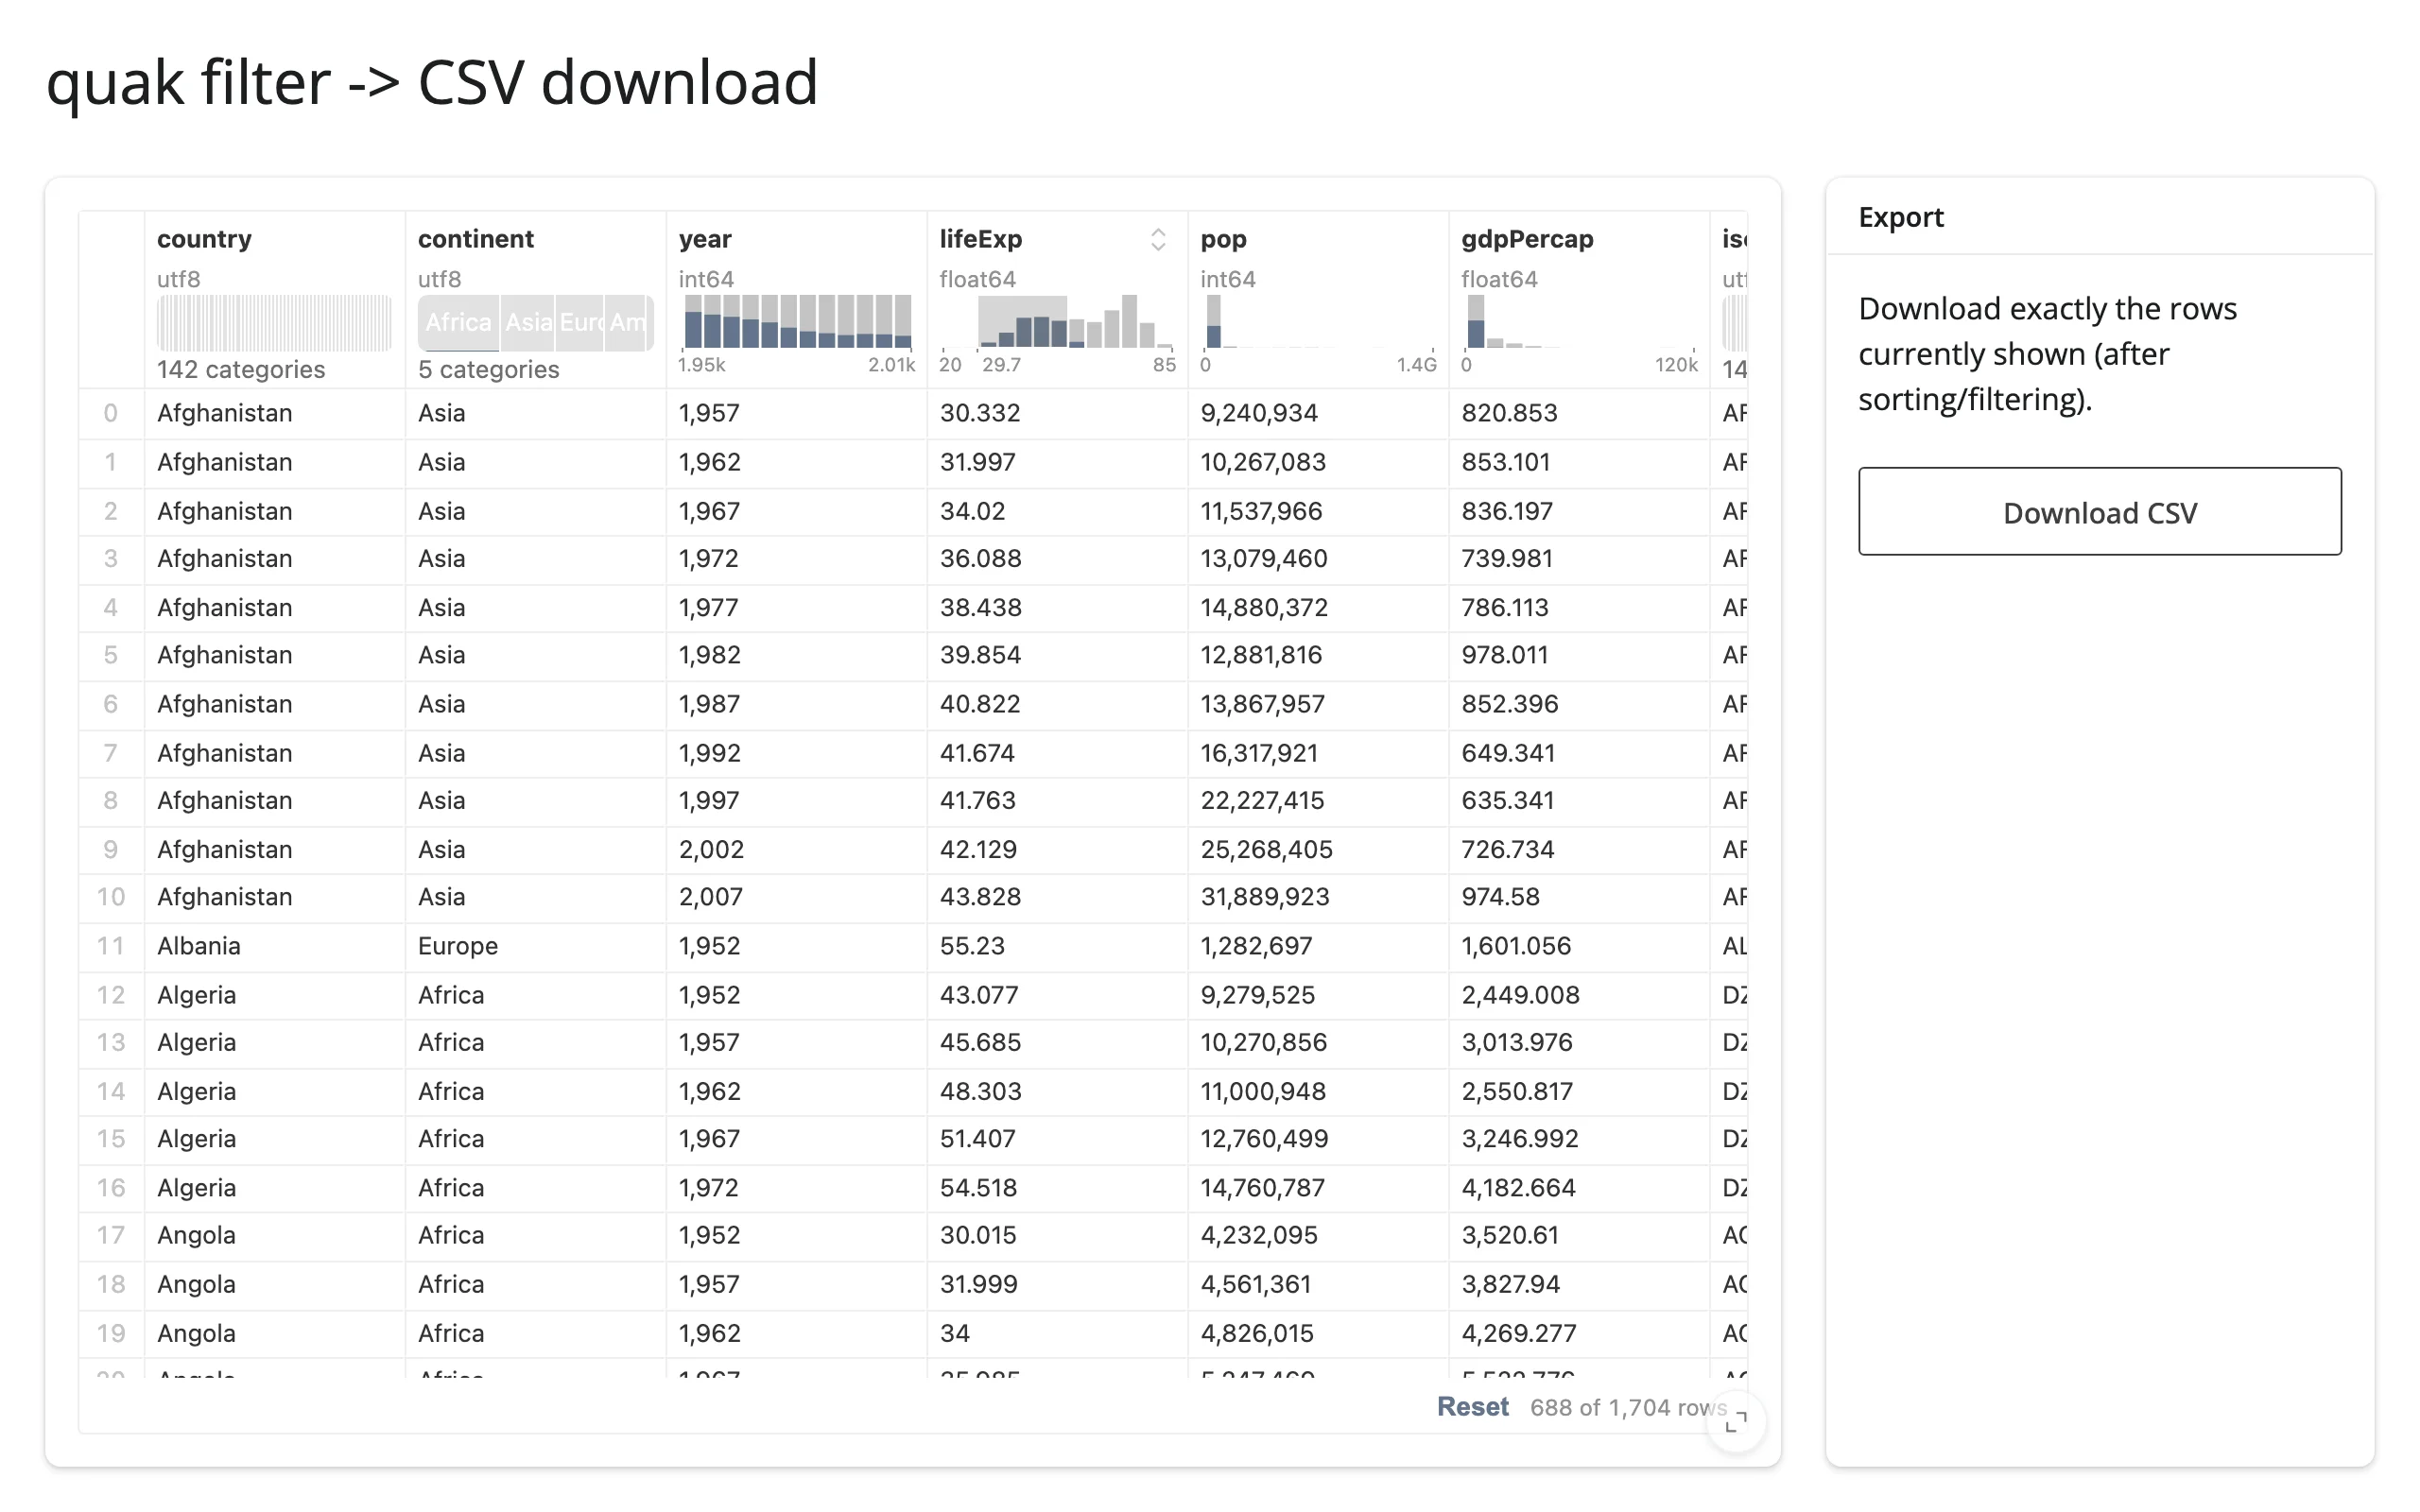
Verified end to end: with the same lifeExp filter as above, the downloaded CSV has exactly 667 data rows – matching table.data()’s count, not quak’s own “688” status-bar text.
Large data
quak’s whole premise is this: your DataFrame never leaves Python. It’s registered in a DuckDB connection quak queries directly, sending only the rows on screen and the per-column histogram bin counts – not the underlying table. examples/03_scale.py renders and crossfilters a 5-million-row table; we didn’t tabulate exact bytes for it this pass (the architecture guarantees cost scales with what’s on screen, not row count, which is why a table of 5 million rows renders about as fast as a table of 5 thousand). This is the “only send what’s visible” approach from Large data & performance.
Layout and sizing
render_quak fills its container by default, same as every other @render_* output – put it in a ui.card(full_screen=True) inside a fillable page and it grows and shrinks with the card. Pass an explicit height= (to render_quak or output_widget) to opt out and get a fixed size instead.
from __future__ import annotations

import plotly.express as px
from shiny.express import ui
from shinywidgets import render_quak

ui.page_opts(title="quak layout and sizing", fillable=True)

gapminder = px.data.gapminder()

with ui.layout_columns(col_widths=[6, 6]):
    with ui.card(full_screen=True):
        ui.card_header("Fills its card (default)")

        @render_quak
        def fills():
            return gapminder

    with ui.card():
        ui.card_header('height="250px"')

        @render_quak(height="250px")
        def fixed():
            return gapminder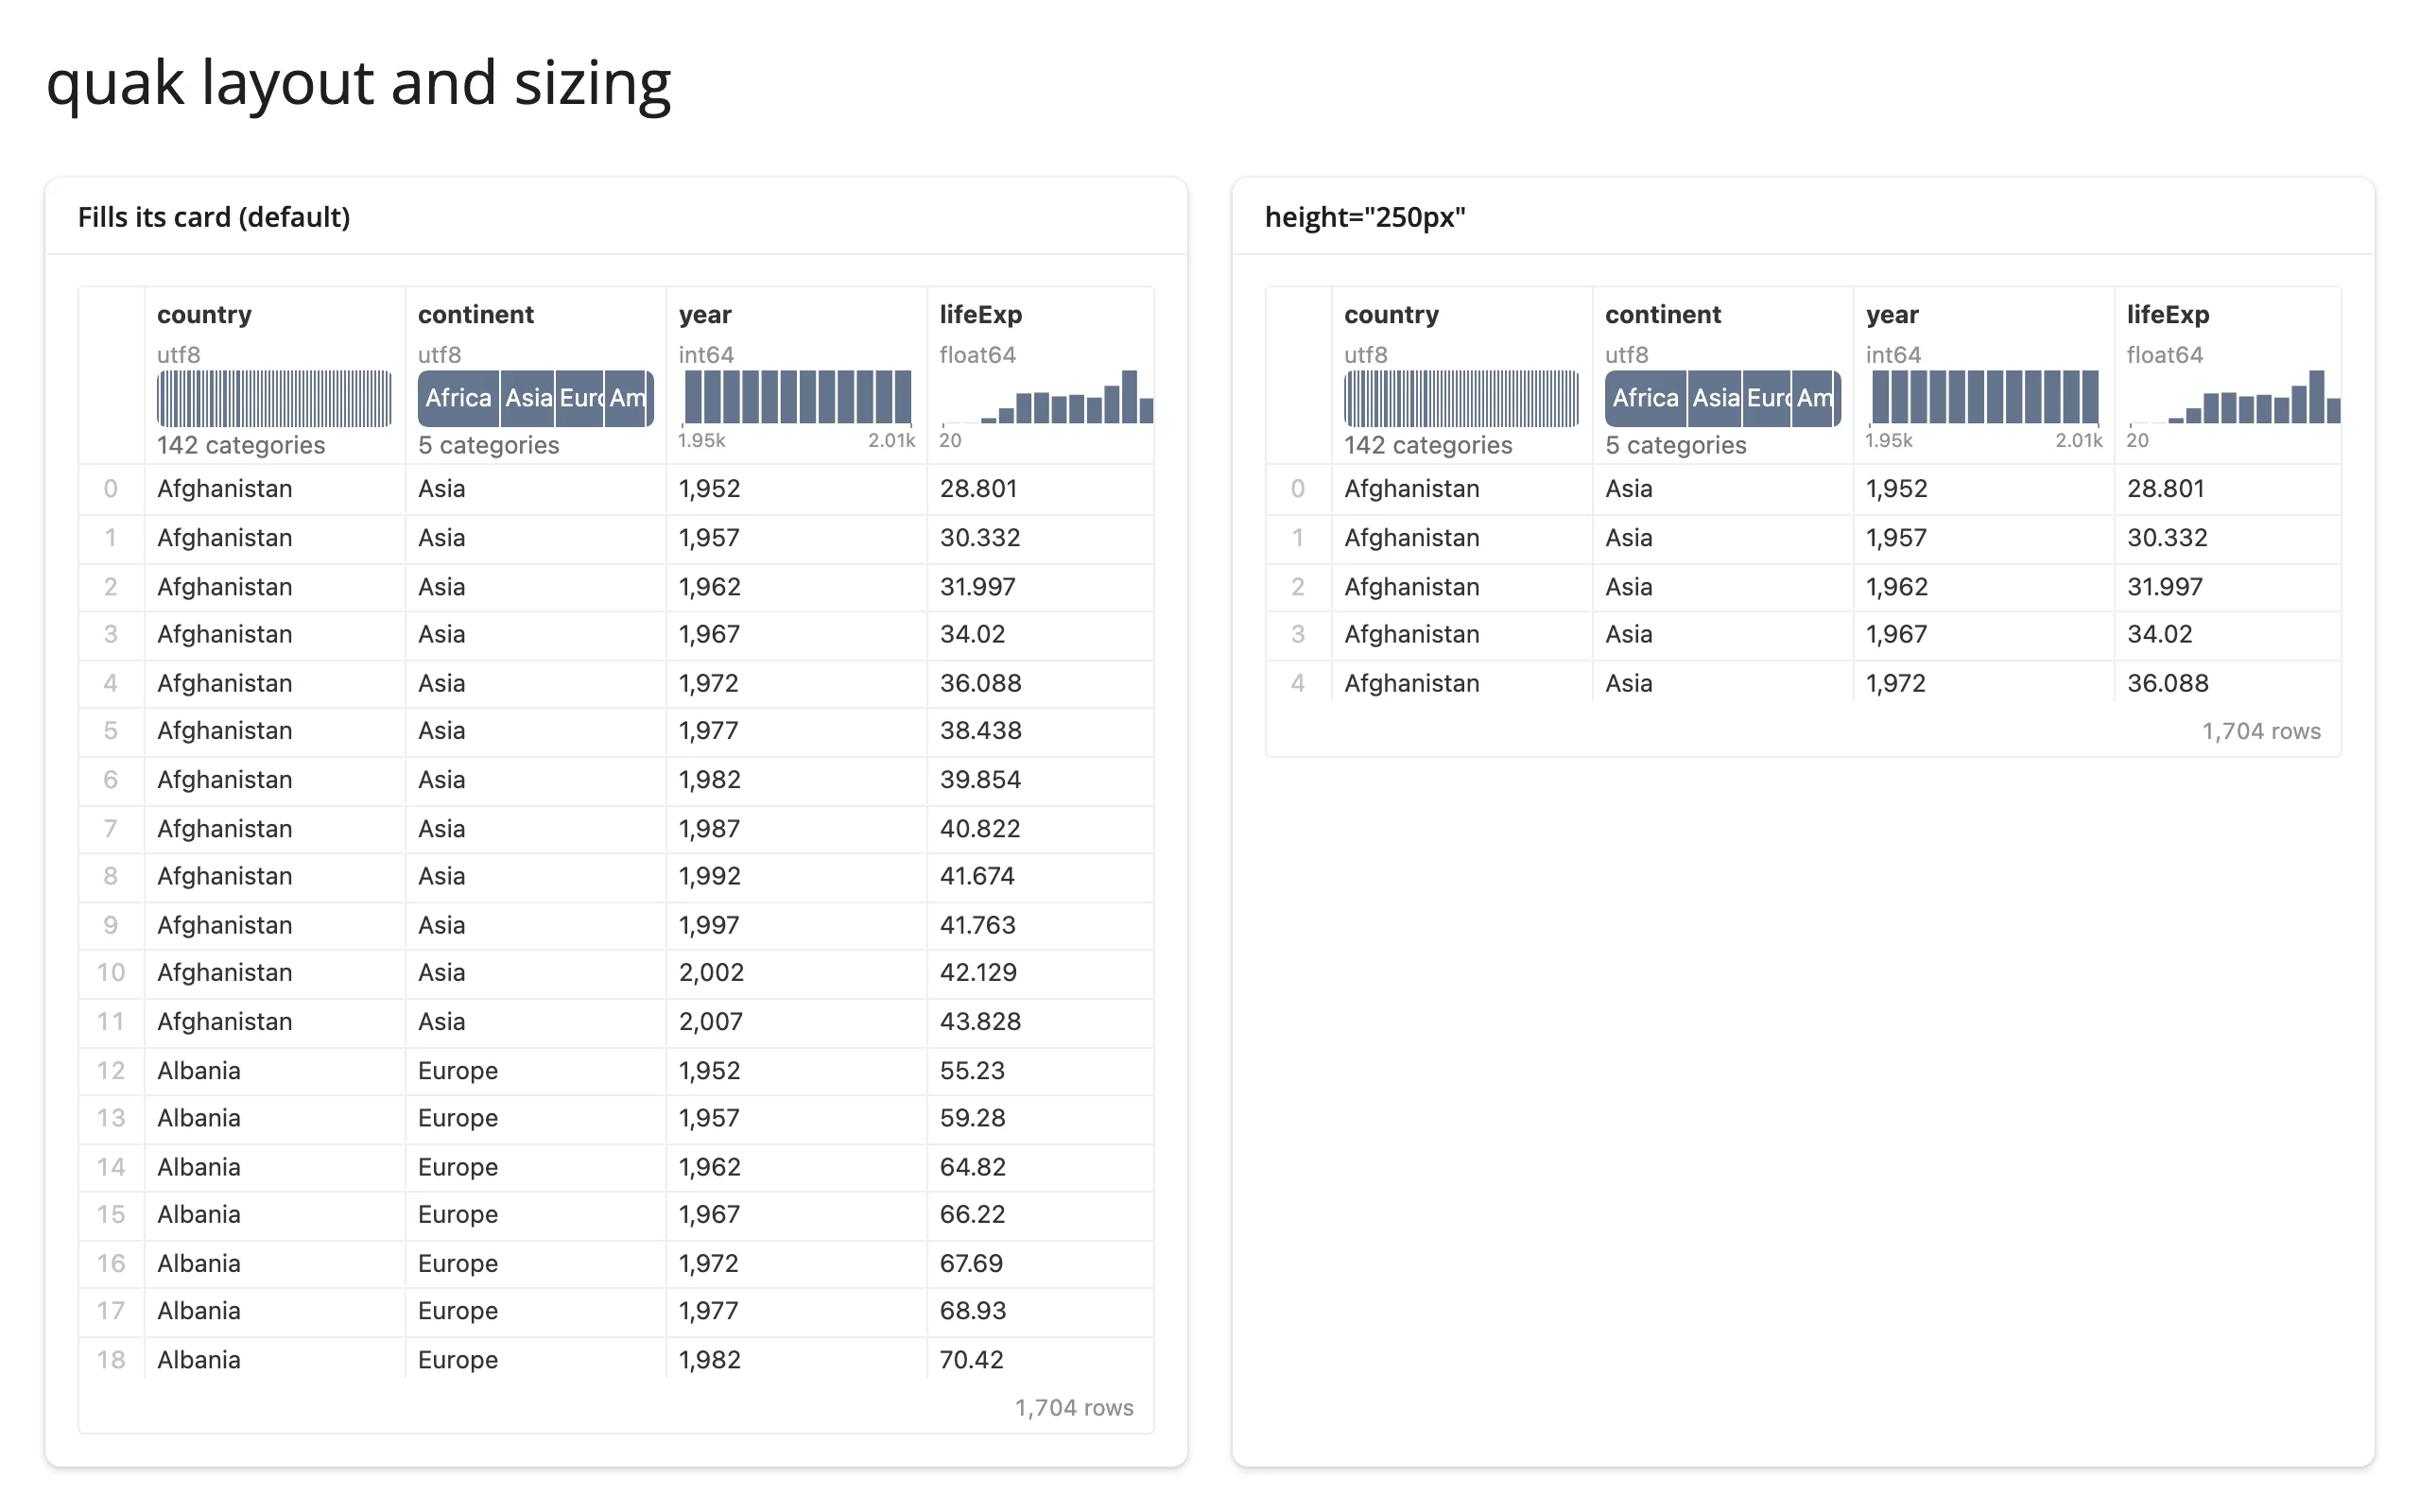
Scrolling to load more rows works at any height – quak’s own scroll listener only loads rows within about 380px of the bottom, which a tall filling container would never reach; shinywidgets patches around that so scrolling keeps loading rows regardless of how tall the table is.
Gotchas and limitations
Security: the DuckDB connection is locked down by default
quak’s browser code sends raw SQL strings to the server over the widget’s comm, and the server runs them against the connection’s .query(). Without restrictions, that lets any visitor send a query like select * from read_csv('/etc/hosts') and read arbitrary files the server process can reach. render_quak locks the widget’s connection down before display (SET enable_external_access = false; SET lock_configuration = true), verified below to block exactly that query while leaving normal SELECTs against the registered data untouched – so, by default, nothing in this guide’s examples needs to change to be safe to deploy.
Pass allow_unrestricted_connection=True to opt out, for a local, single-user app where you’d rather quak’s SQL reach the filesystem (or you’ve already locked the connection’s configuration yourself – a connection whose configuration is already locked is left untouched, since locking it is what the renderer would have done anyway):
from __future__ import annotations

import plotly.express as px
from shiny.express import ui
from shinywidgets import render_quak

ui.page_opts(title="quak with an unrestricted connection (local use only)", fillable=True)

gapminder = px.data.gapminder()

with ui.card(full_screen=True):

    @render_quak(allow_unrestricted_connection=True)
    def table():
        # render_quak() locks down the table's DuckDB connection by default
        # (see Gotchas): a visitor's browser can query the data but can't
        # read server files or change the connection's settings. Opting out
        # here leaves the connection exactly as quak builds it -- only do
        # this for a local, single-user app, never one you deploy.
        return gapminder
The lockdown is permanent for the connection it’s applied to (DuckDB can’t undo it) and reaches every cursor on the same database, not just the one it was set on. That matters if you pass quak.Widget(con) with a connection built from your own code (rather than letting render_quak build one for you from a DataFrame, as every other example in this guide does): if that connection is shared with other code in your app, do any server-side file reads (read_parquet(), etc.) on it before the first render, or pass allow_unrestricted_connection=True for it.
Even locked down, a visitor can still send expensive queries, which block the Python process while they run – there’s no statement timeout.
Other gotchas
sqlis read-only and briefly empty at startup. Settingtable.widget.sql = ...from Python has no effect; use the accessor to read, and change what’s displayed by re-rendering. The accessor cancels (noreq()needed) during the brief window before the browser’s first report.- quak’s own status-bar row count can disagree with the exact count of its published query. Brushing a numeric histogram in this guide’s examples consistently produced a status bar reading “688 of 1,704 rows” while the exact
count(*)of the same publishedsql()was 667 – reproduced every time, independent of shinywidgets. Trusttable.data(), not the status-bar text, for anything that needs to be exactly right (an upstream quak quirk, matching a finding from an earlier evaluation of this widget). - Several column types crash or render oddly, upstream. A
timedelta/duration column throwsUnsupported type: INTERVALand blanks the whole table; anint64column with values above 2^53 throwsBigInt exceeds integer number representationand also blanks the table (both reproduced directly on current quak 0.3.5). Cast durations to seconds and oversized integers to strings or floats before rendering. - A bare
duckdb.DuckDBPyConnectionqueries a table nameddfby default. Passing a connection whose data lives under a different table name renders a blank table with a DuckDBCatalog Erroron the Python side (no error surfaces in the UI). Constructquak.Widget(con, table="your_table_name")yourself instead of returning the bare connection. - A manually-set
layout.heightis overridden while the output is filling its container. See “Updating the widget from Python” above – give the output a fixedheight=if you want to resize the widget itself from Python. - Shiny Express auto-displays non-
Nonetop-level expressions, which bitesDuckDBPyConnection.register()(it returns the connection, for chaining) – discard its return value, or Express tries to render the connection object as page content and the app fails to start. Not a quak issue, but easy to hit while wiring one up (seeexamples/02_duckdb_relation.py). - No Python 3.15 wheels yet. quak depends on duckdb, which hasn’t published
cp315wheels; stick to Python 3.10-3.14.
Gallery candidates
template_explorer.py
A clean starting point: a table plus a live row count and query text, both reading from the accessors. Adapt by swapping in your own DataFrame.
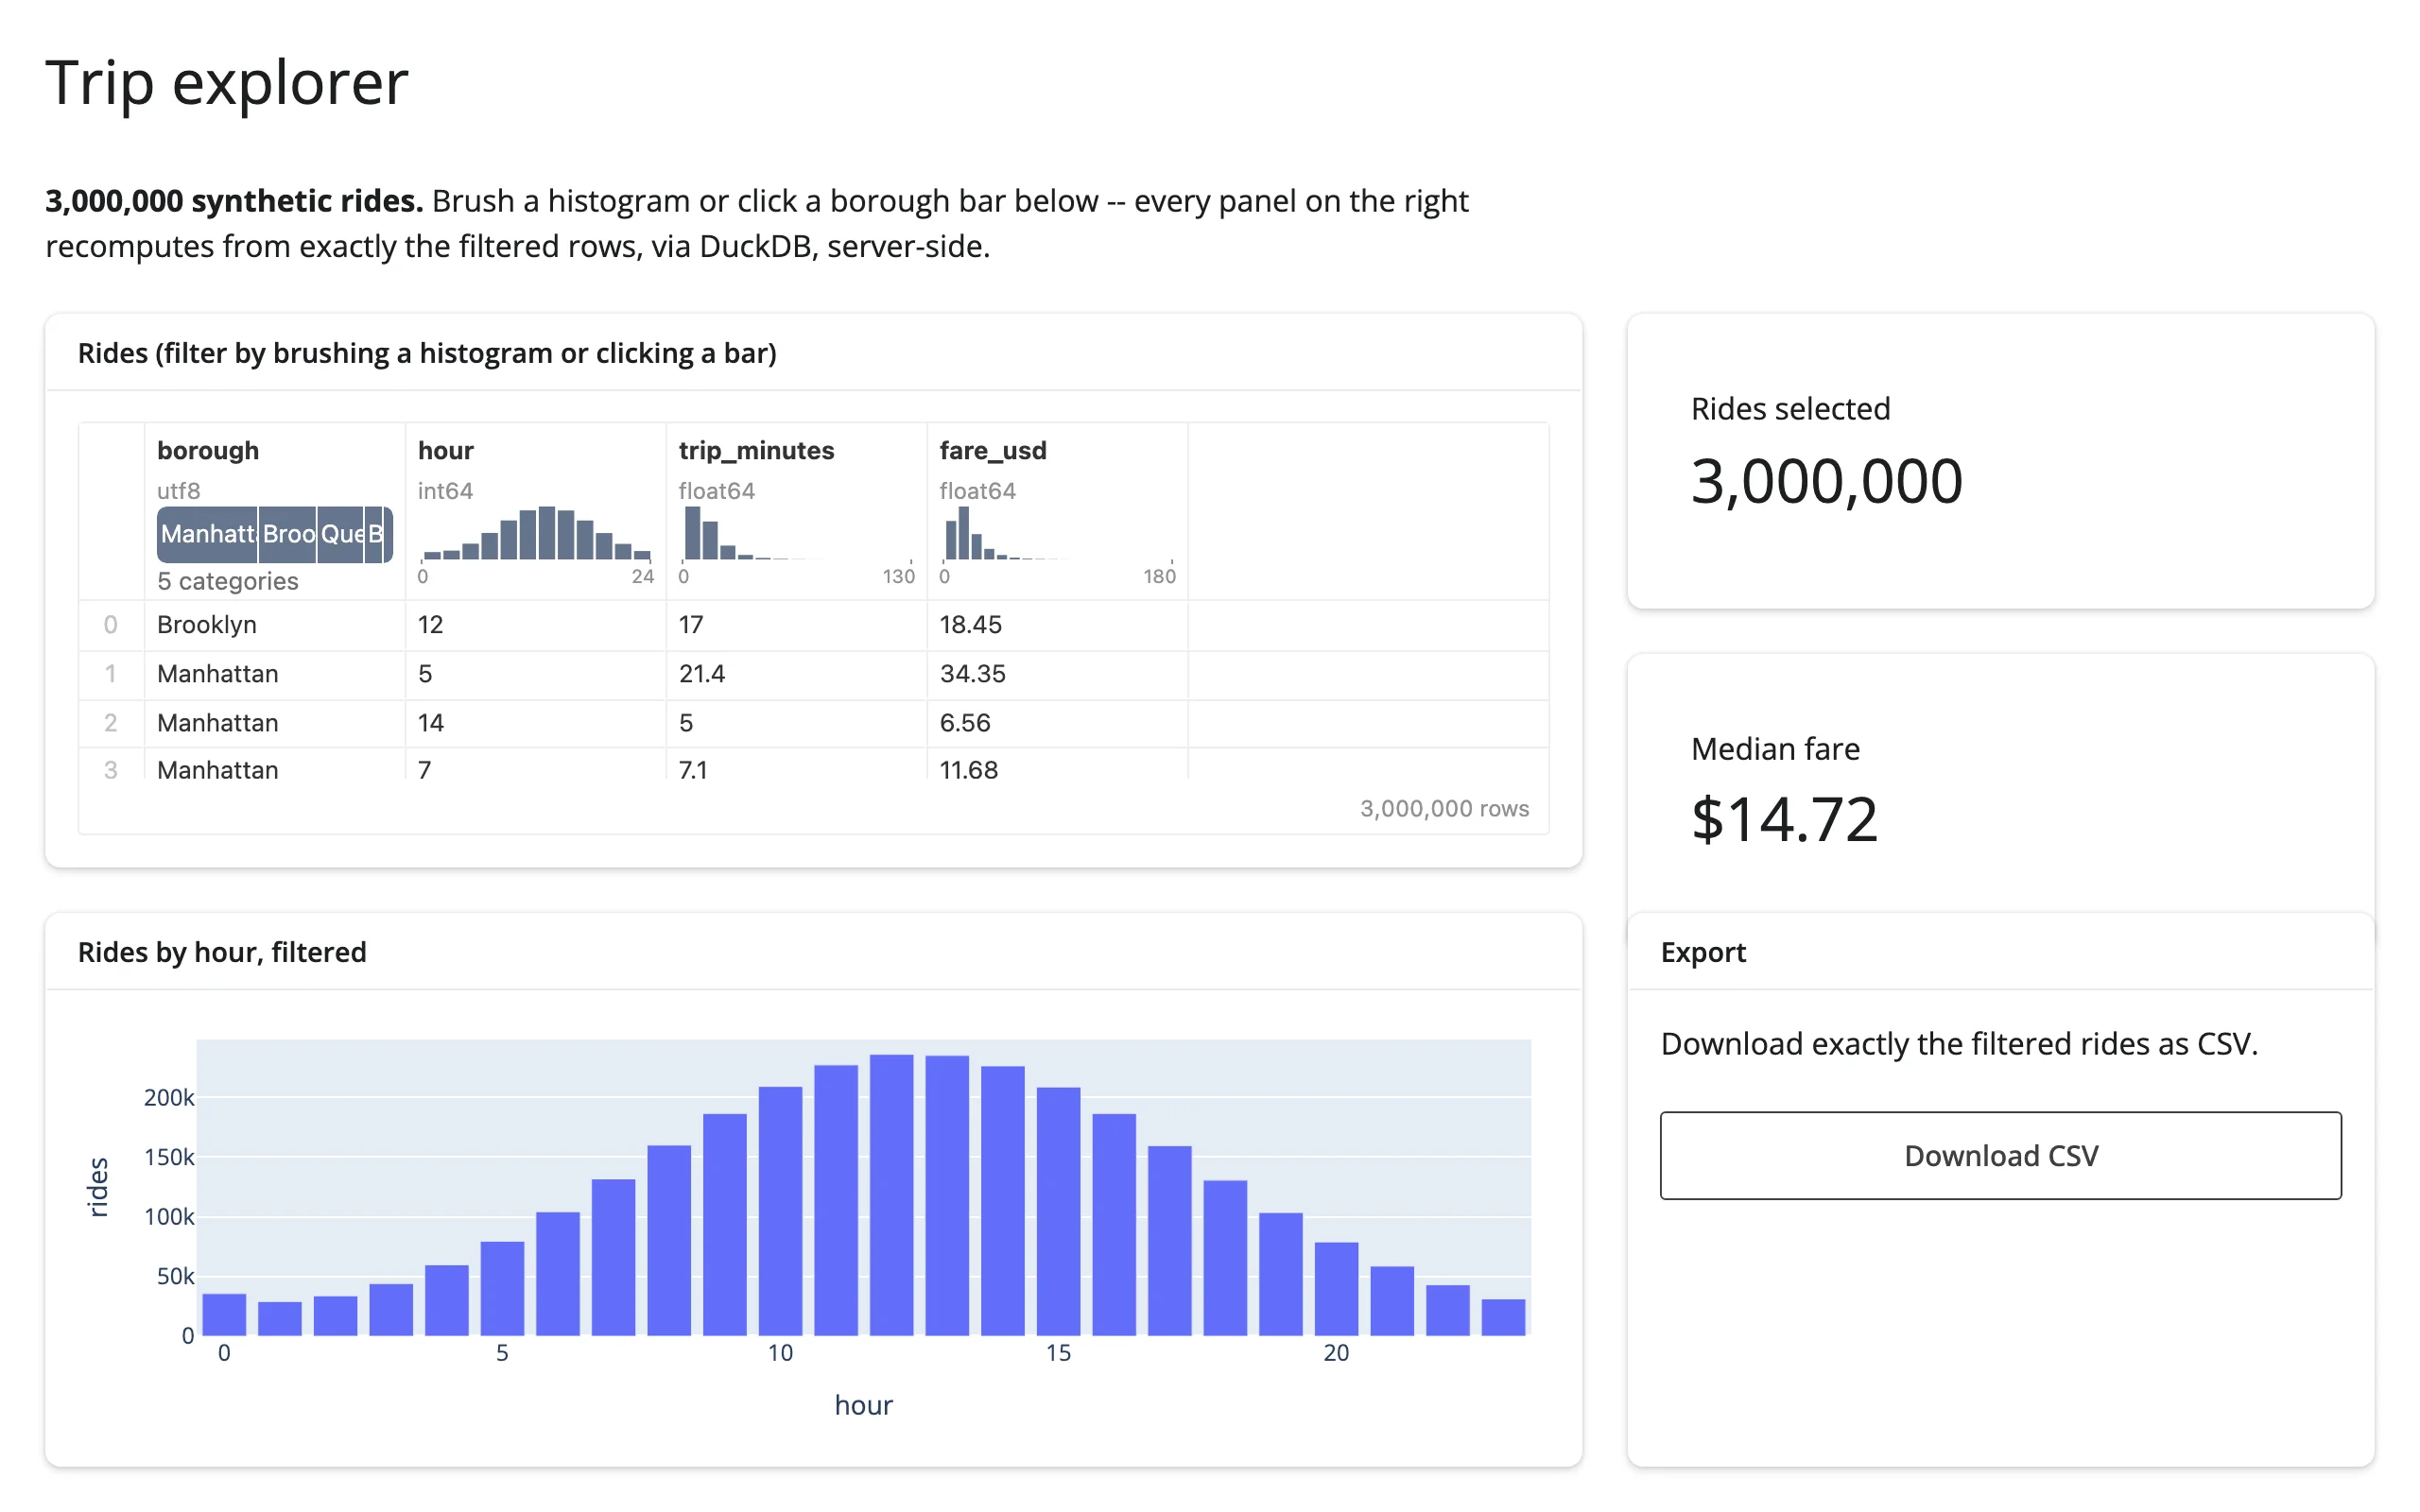
showcase_trip_explorer.py
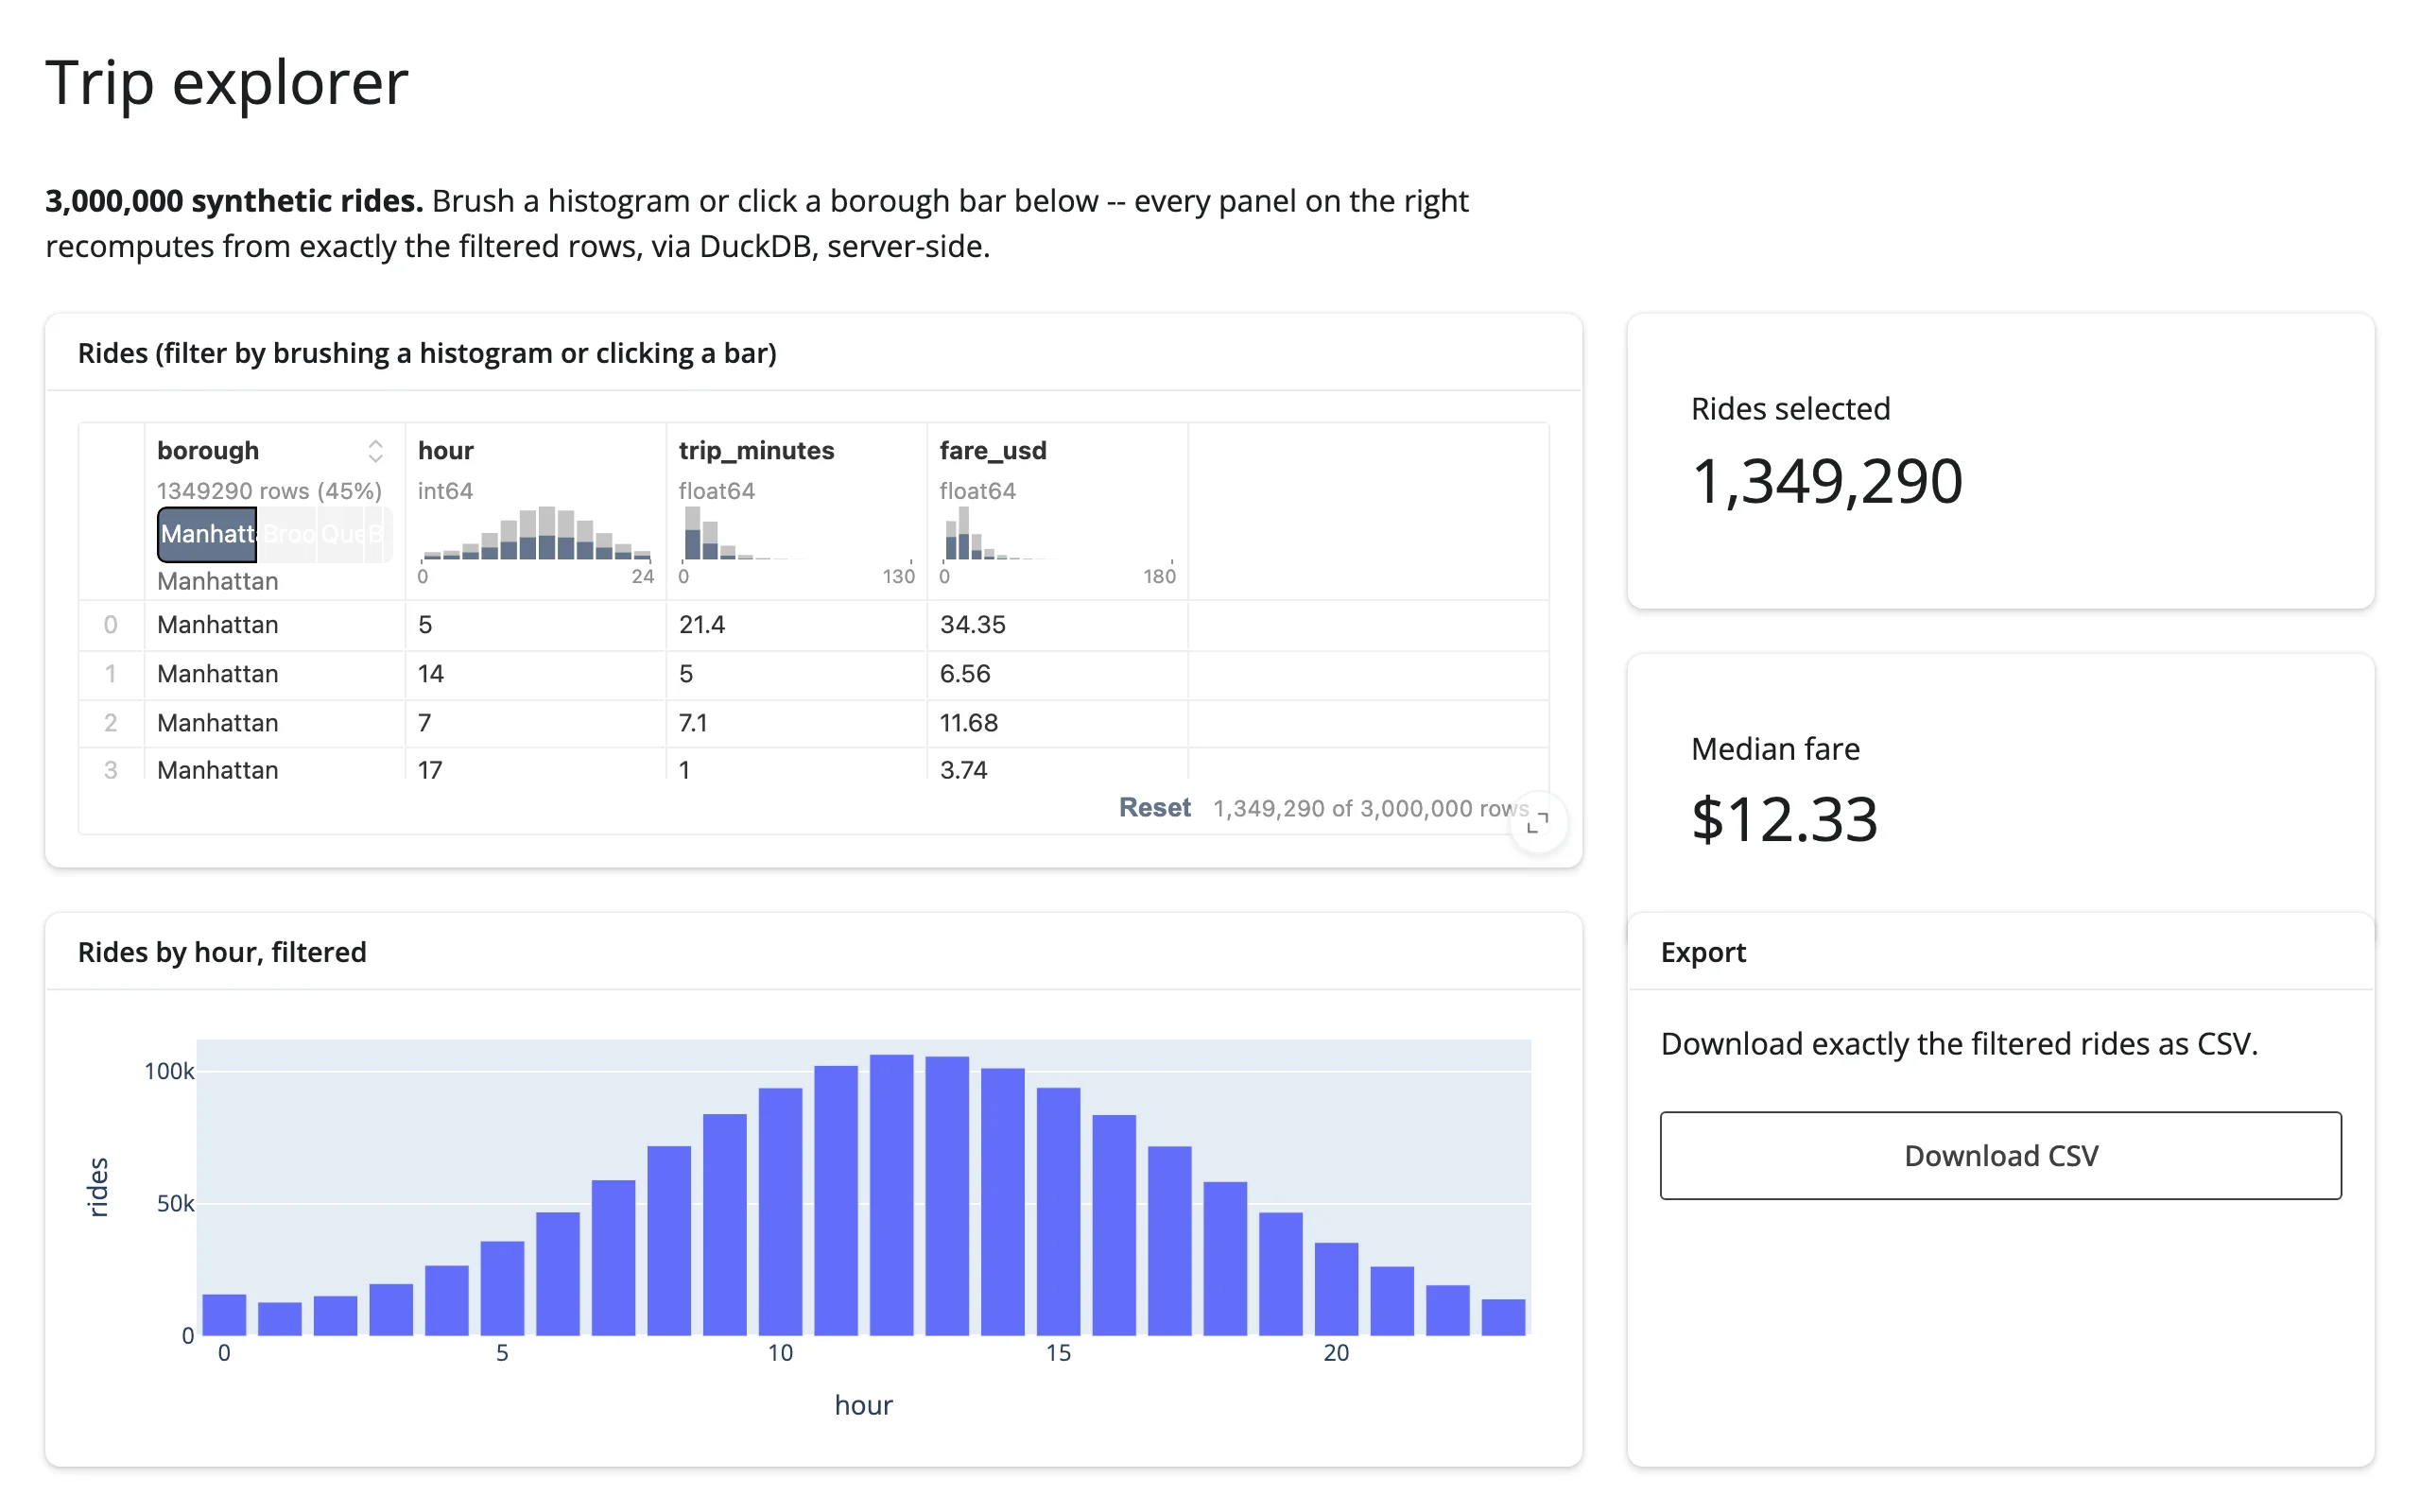
Three million synthetic rides, with value boxes, a plotly chart of ride volume by hour, and a CSV download, all recomputed from table.data() as the user brushes or clicks. Demonstrates every pattern in “Coordinating multiple views” together, at scale.
Learn more
- quak on GitHub – source, and the README’s own demos
- Mosaic – the linked-views framework quak’s crossfiltering is built on; see the mosaic guide for building a multi-view dashboard the same way
- Related guides in this roster: mosaic, perspective, itables, reactable, ipydatagrid