ipycanvas
ipycanvas is a Python binding to the browser’s HTML5 Canvas 2D drawing API, built by the same Jupyter widgets maintainers behind ipyleaflet and ipywidgets itself. Where most widgets in this roster wrap an existing visualization library, ipycanvas is the raw surface: rectangles, circles, paths, text, gradients, and pixel buffers, drawn with plain method calls on a Canvas object. Draw commands are batched over a binary comm channel, so even thousands of shapes or a full-resolution image land quickly.
@render_ipycanvas renders a Canvas, MultiCanvas, RoughCanvas, or MultiRoughCanvas (requires pip install 'shinywidgets[ipycanvas]'). The canvas’s width/height are drawing-buffer pixels, not layout sizes: shinywidgets fills the output’s container and centers the canvas within it (shrinking to fit, aspect preserved), never stretching the bitmap. The decorated function’s .widget attribute is a live handle to the rendered canvas – draw on it from anywhere (a reactive.effect, a button handler, an asyncio task) and the browser updates in place, without re-rendering.
Unlike the other widgets in this roster, ipycanvas has no reactive accessors: there’s no single “selection” or “viewport” concept to expose. Instead, its interaction model is raw browser events – on_mouse_down, on_mouse_move, on_key_down, and friends – each a plain Python callback. This guide’s “Reacting to user interaction” section teaches the one recipe that turns those callbacks into Shiny reactive values, which is really all you need.
Reach for ipycanvas when you need the canvas itself: freehand sketch pads, pixel editors, cellular automata and particle simulations, click-to-annotate tools, or any visualization that doesn’t fit an existing charting library. For charts, maps, or tables, use a dedicated widget elsewhere in this roster instead; for another browser-drawing surface with a different shape (dataframe-producing scatter/line sketches), see drawdata.
Installation
pip install 'shinywidgets[ipycanvas]'ipycanvas is pure Python with no native dependencies, so this resolves on every Python version shinywidgets supports.
Quick start
A Canvas is a drawing surface sized in buffer pixels. Draw on it once at render time with the same method calls you’d use in a Jupyter notebook:
from ipycanvas import Canvas
from shiny.express import ui
from shinywidgets import render_ipycanvas

ui.page_opts(title="ipycanvas quickstart", fillable=True)

with ui.card(full_screen=True):

    @render_ipycanvas
    def canvas():
        c = Canvas(width=400, height=250)
        c.fill_style = "#f4f1ea"
        c.fill_rect(0, 0, 400, 250)
        c.fill_style = "steelblue"
        c.fill_rect(20, 20, 140, 90)
        c.fill_style = "#e67e22"
        c.fill_circle(260, 90, 55)
        c.font = "20px sans-serif"
        c.fill_style = "#222"
        c.fill_text("Hello from Python", 20, 160)
        return c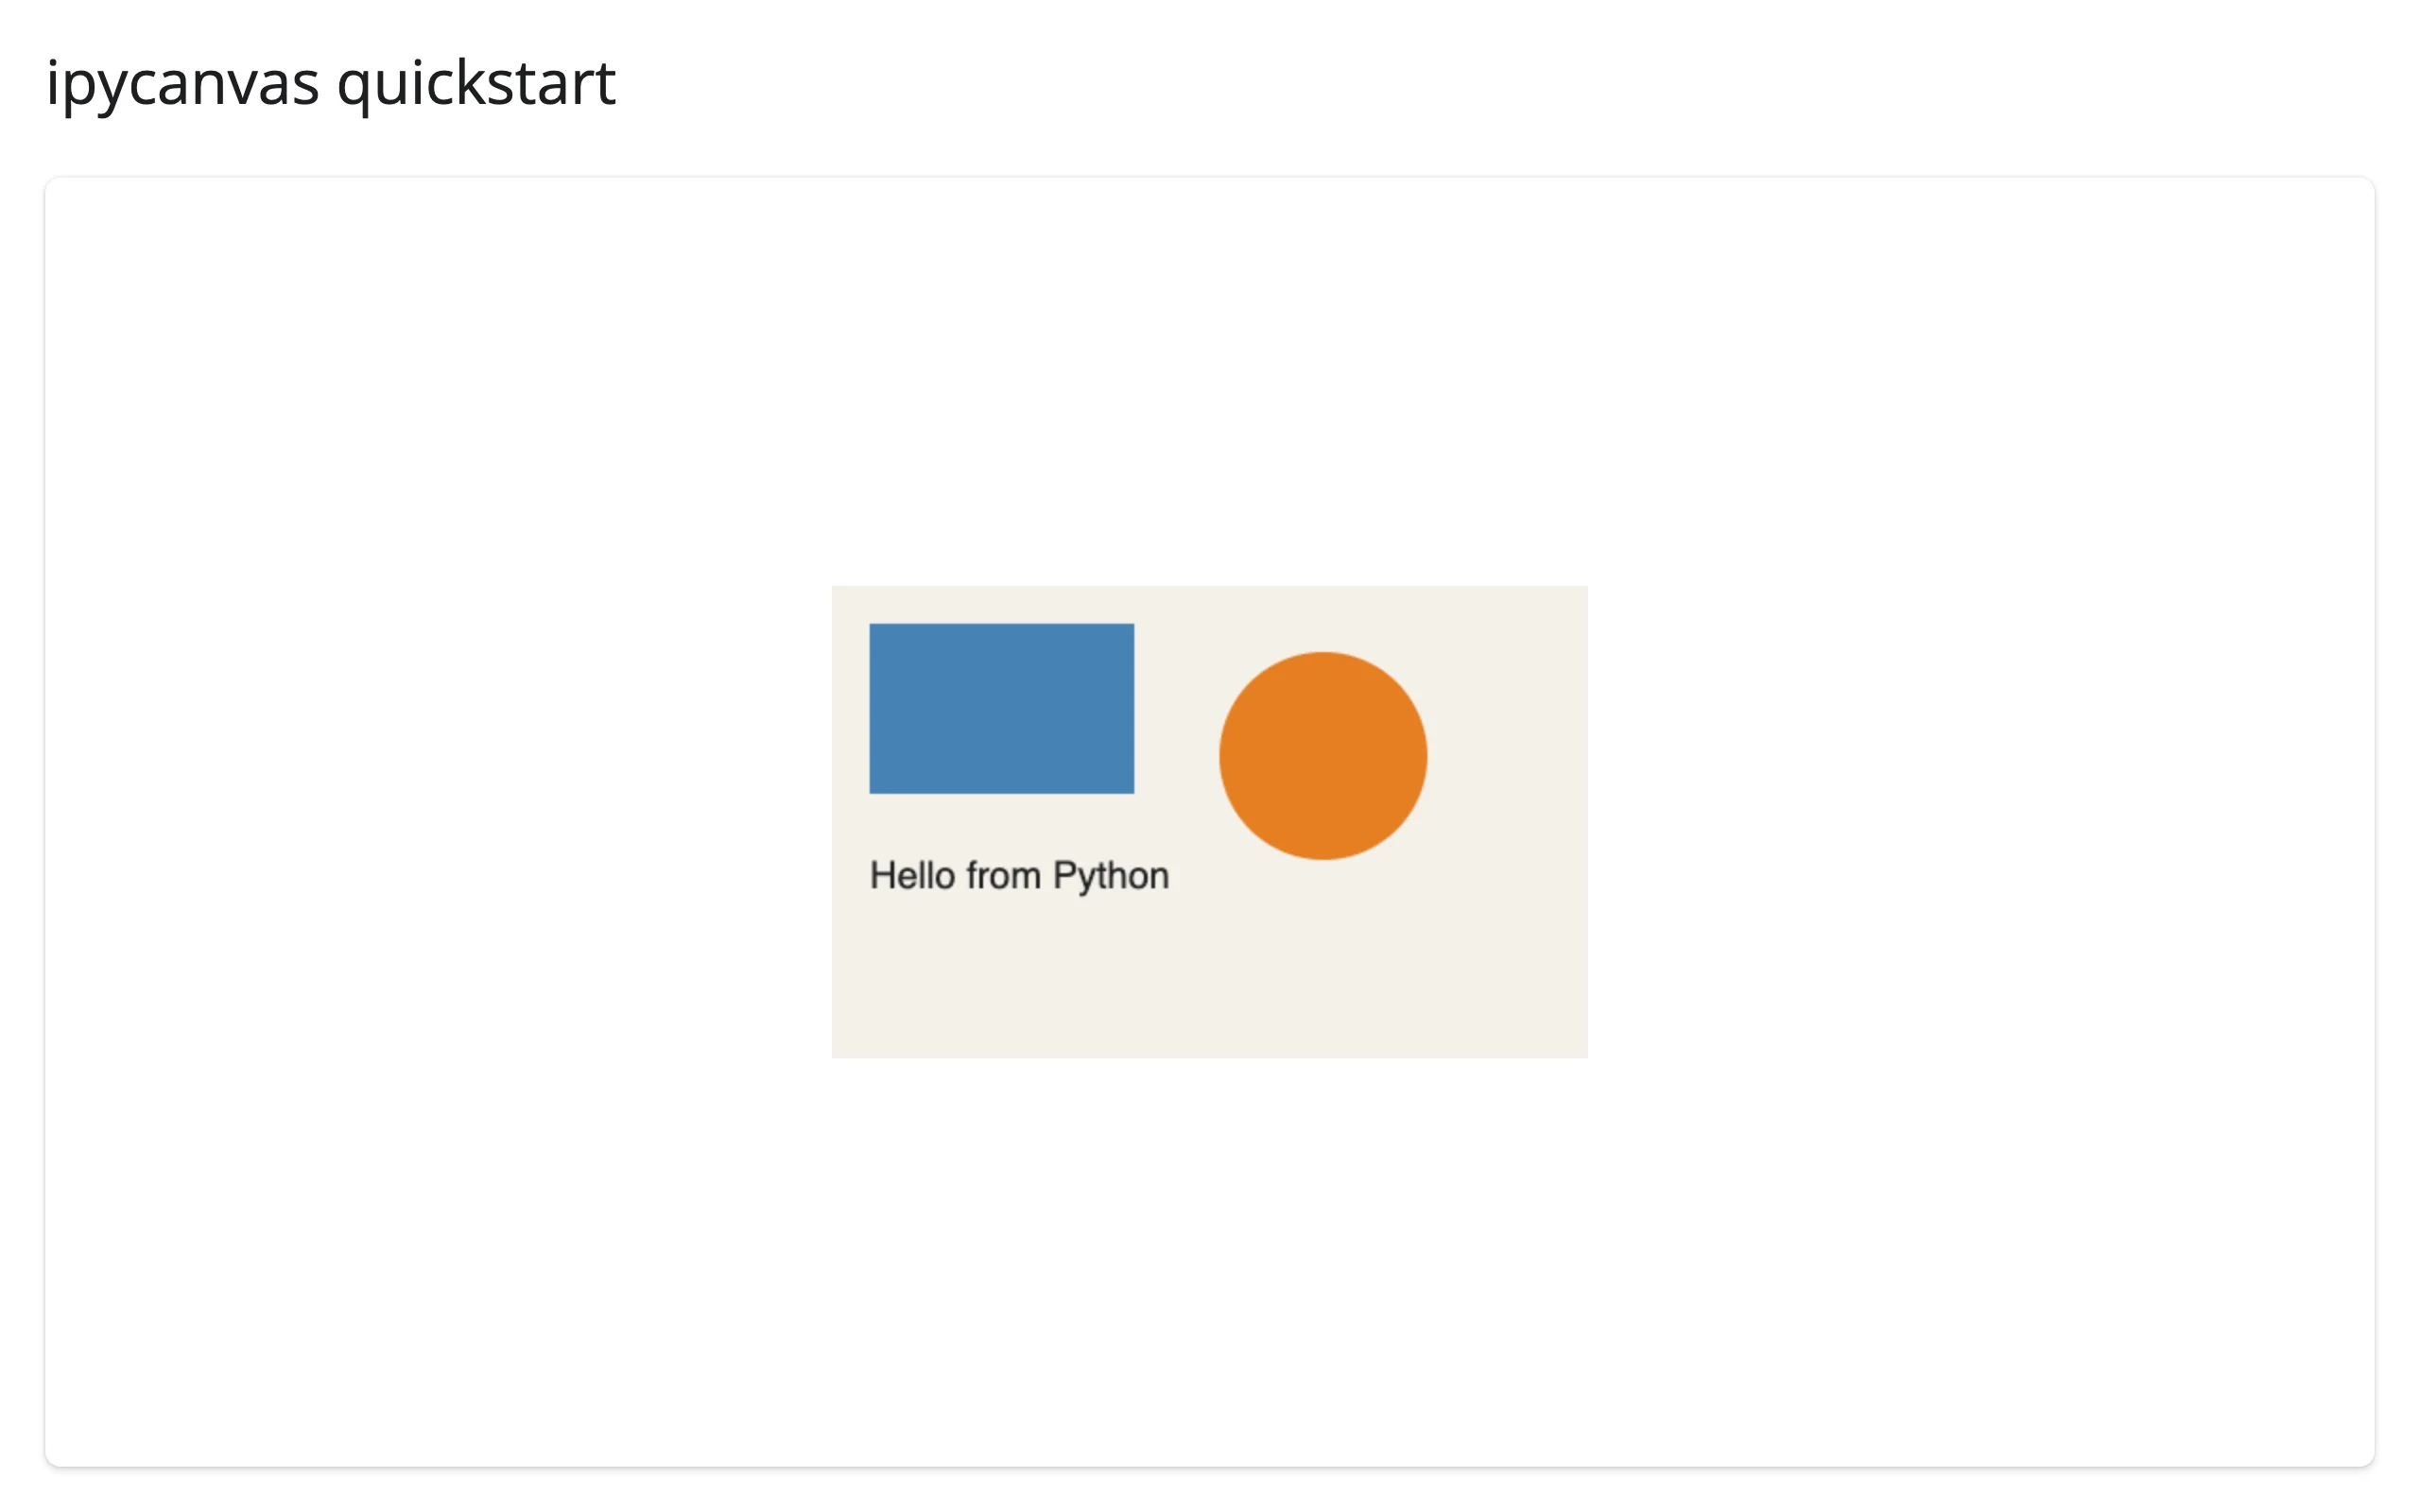
In a filling layout (ui.card(full_screen=True), no explicit output_widget(height=)), the canvas keeps its 400x250 buffer size and centers itself in the available space – it never stretches to fill.
What you can build
A full 2D drawing API, from Python
Every canvas method (fill_rect, stroke_circle, stroke_line, fill_text, gradients, clip, transforms, …) is a direct call – there’s no scene graph or re-render step. That makes ipycanvas a general-purpose drawing surface for things a charting library won’t do out of the box, like a hand-rolled bar chart with exact pixel control:
        for i, (_, row) in enumerate(top.iterrows()):
            y = 10 + i * (BAR_H + 10)
            width = 260 * row["gdpPercap"] / MAX_GDP
            c.fill_style = "#2c7fb8"
            c.fill_rect(150, y, width, BAR_H)
            c.stroke_style = "#1c4f73"
            c.stroke_rect(150, y, width, BAR_H)
            c.fill_style = "#222"
            c.text_align = "right"
            c.fill_text(row["country"], 140, y + BAR_H / 2 + 5)
            c.text_align = "left"
            c.fill_text(f"${row['gdpPercap']:,.0f}", 150 + width + 8, y + BAR_H / 2 + 5)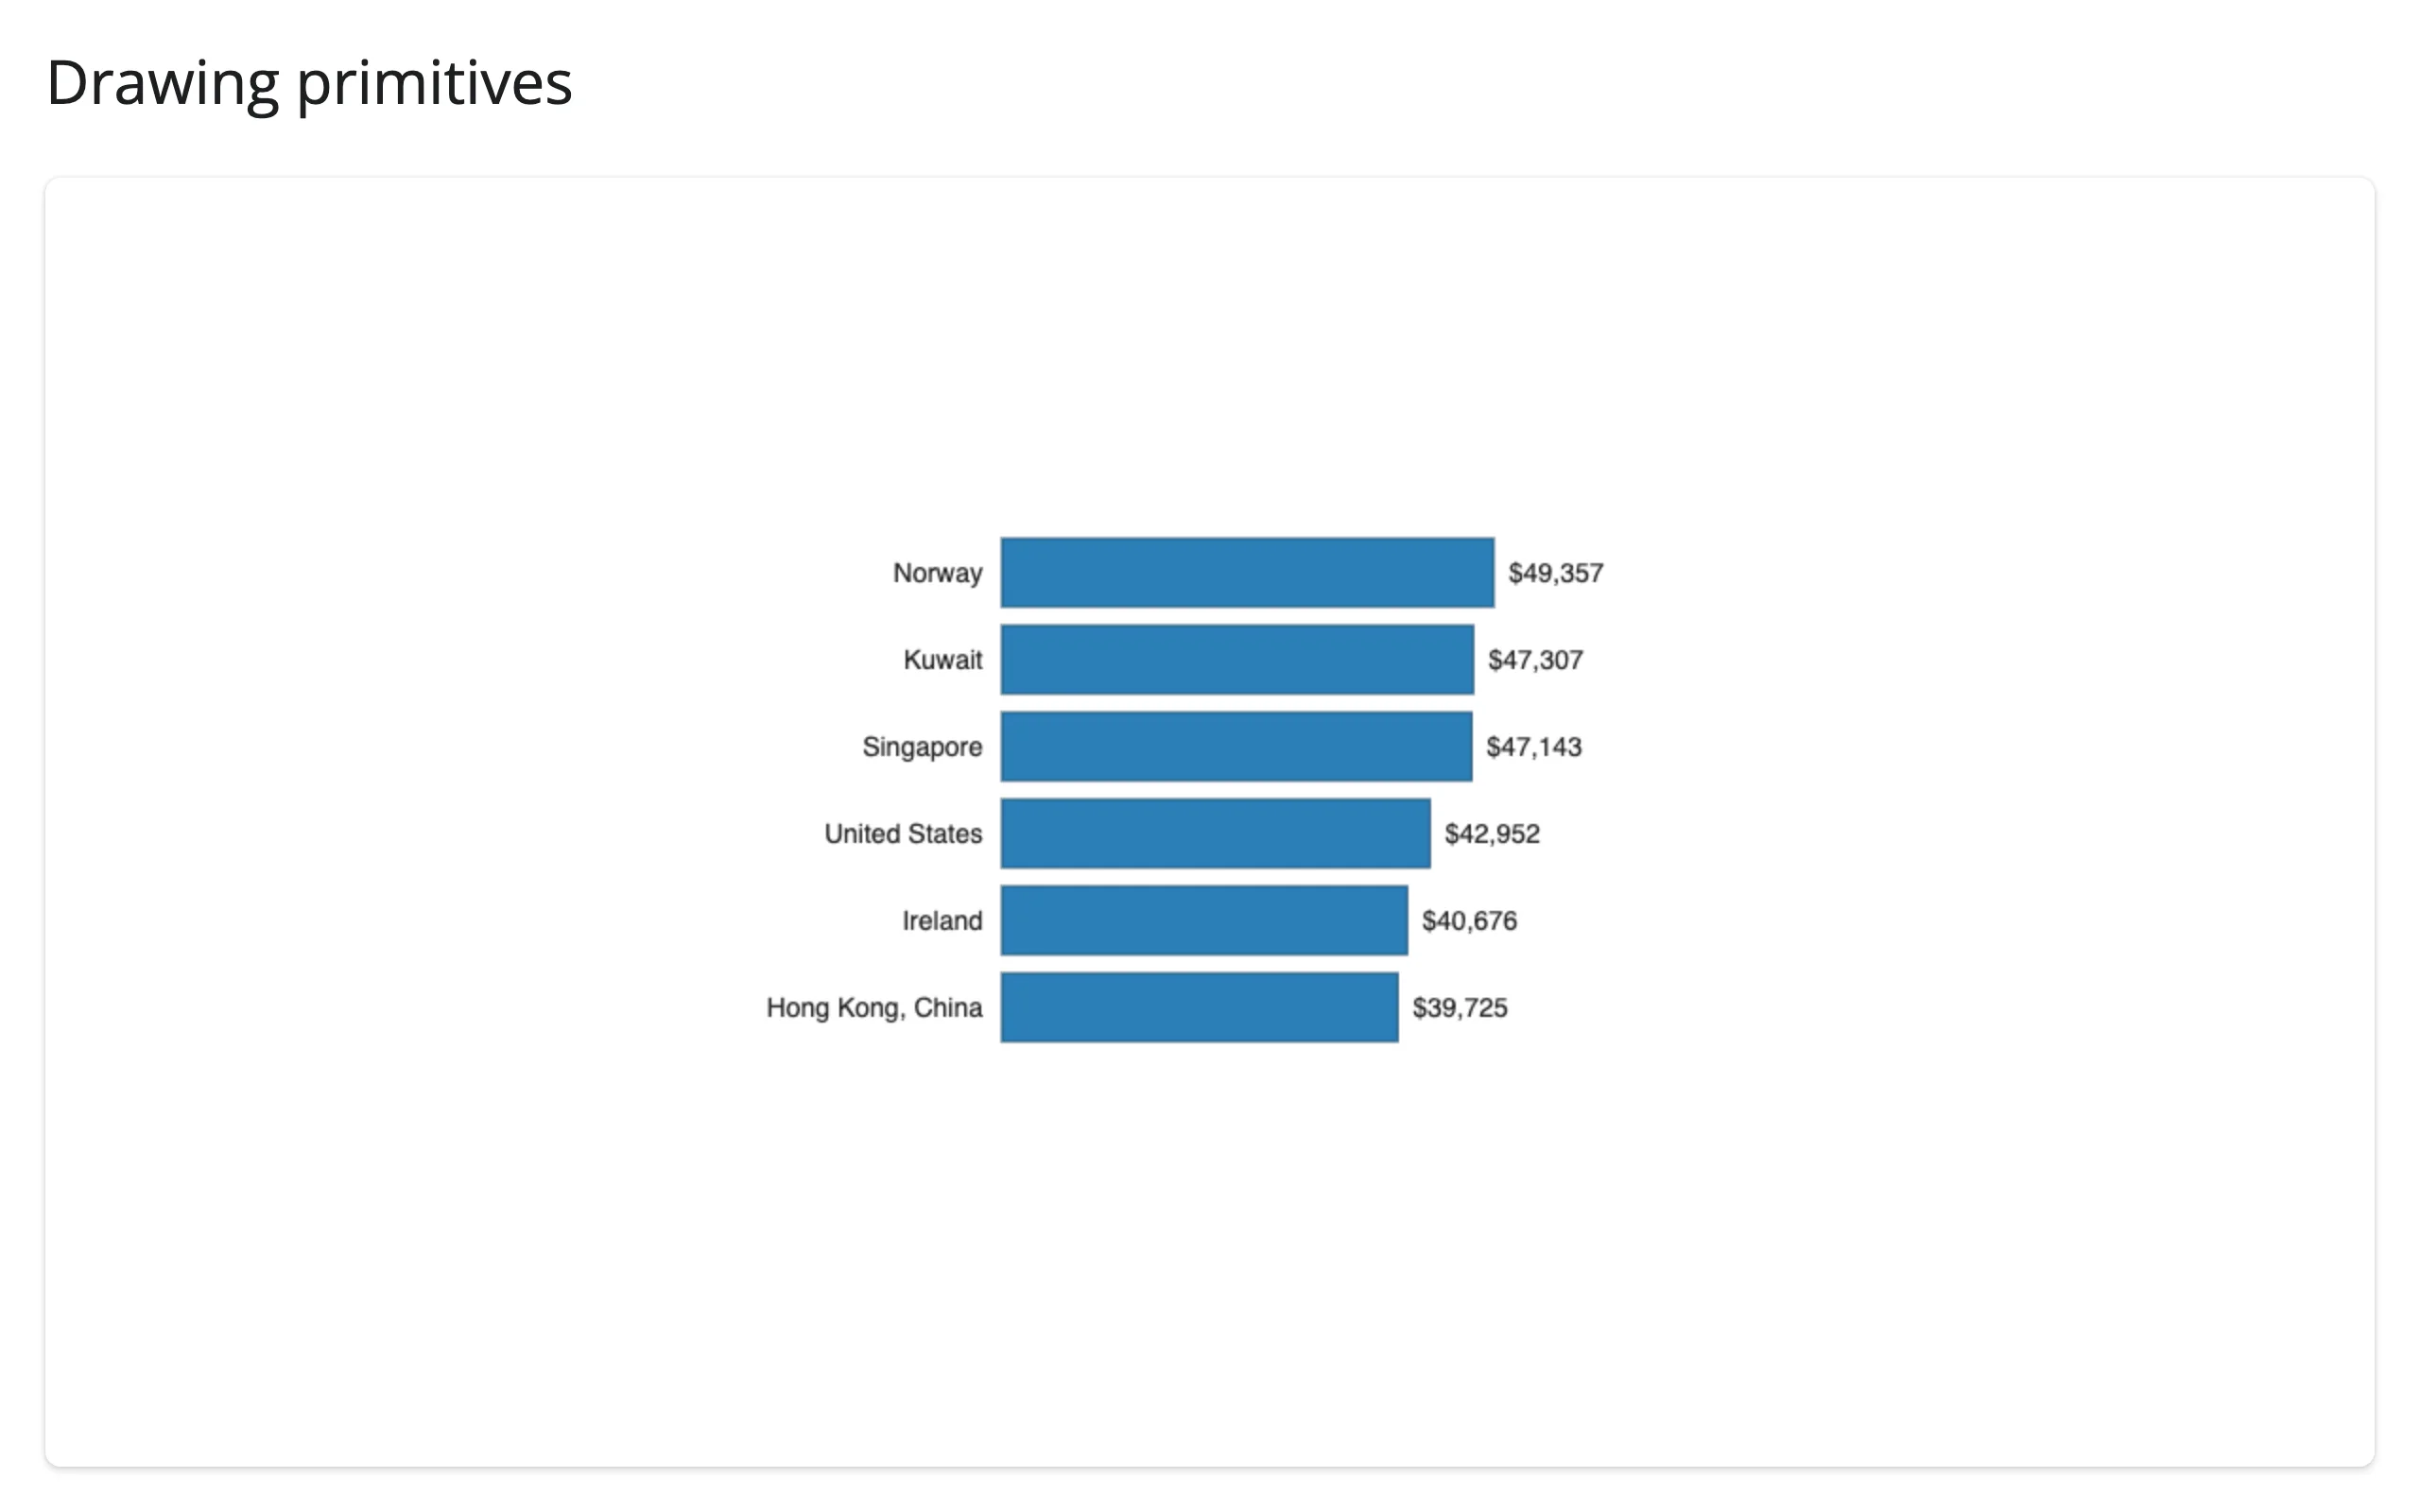
MultiCanvas gives you layers for free
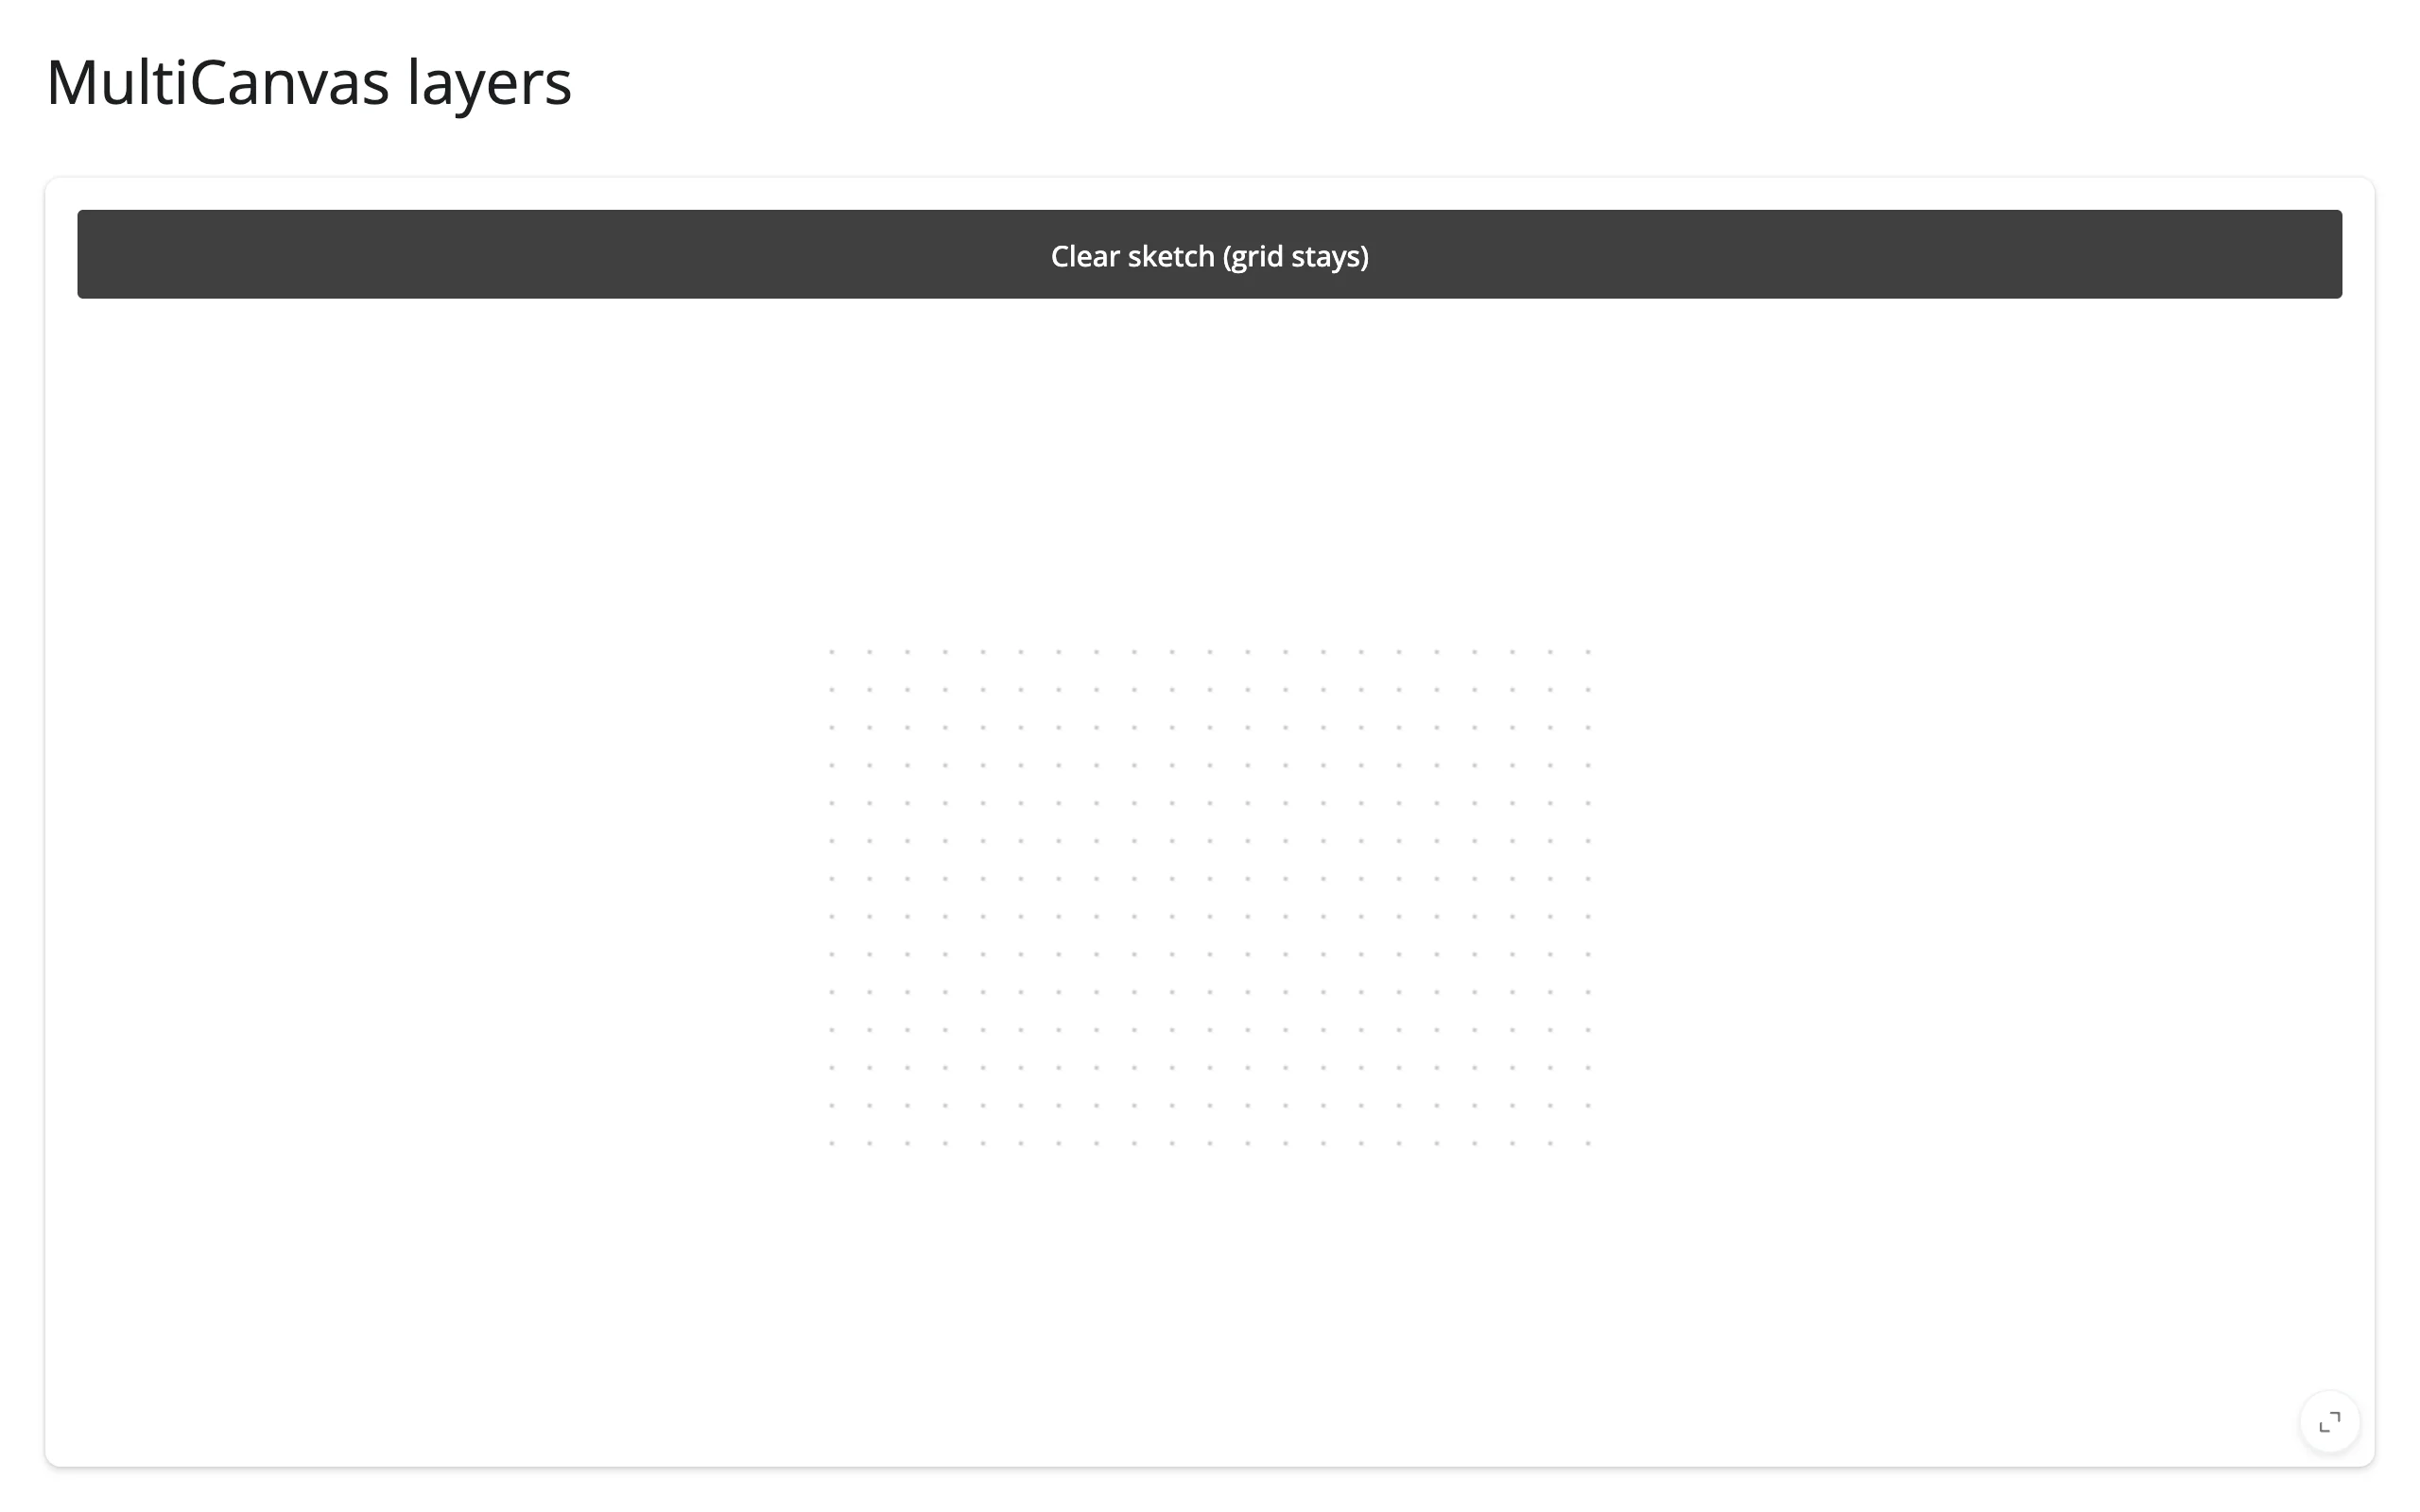
A MultiCanvas(n, width=, height=) is n independently-addressable canvases (mc[0], mc[1], …) composited into a single element. Put a background that never changes on one layer and foreground ink on another – clearing the ink never touches the background:
    @render_ipycanvas
    def mc():
        canvas = MultiCanvas(2, width=W, height=H)
        grid, ink = canvas[0], canvas[1]

        # Layer 0: a dot grid, drawn once -- it's never touched again
        grid.fill_style = "#ccc"
        for x in range(10, W, 20):
            for y in range(10, H, 20):
                grid.fill_circle(x, y, 1.2)

        # Layer 1: a few "sticky note" shapes
        ink.fill_style = "#f1c40f"
        ink.fill_rect(40, 40, 90, 90)
        ink.fill_style = "#e74c3c"
        ink.fill_rect(160, 90, 90, 90)
        ink.fill_style = "#2ecc71"
        ink.fill_rect(260, 50, 90, 90)
        return canvas

    @reactive.effect
    @reactive.event(input.clear)
    def _():
        canvas = mc.widget
        if canvas is not None:
canvas[1].clear() # only the ink layer is erased| Before | After clearing layer 1 |
|---|---|
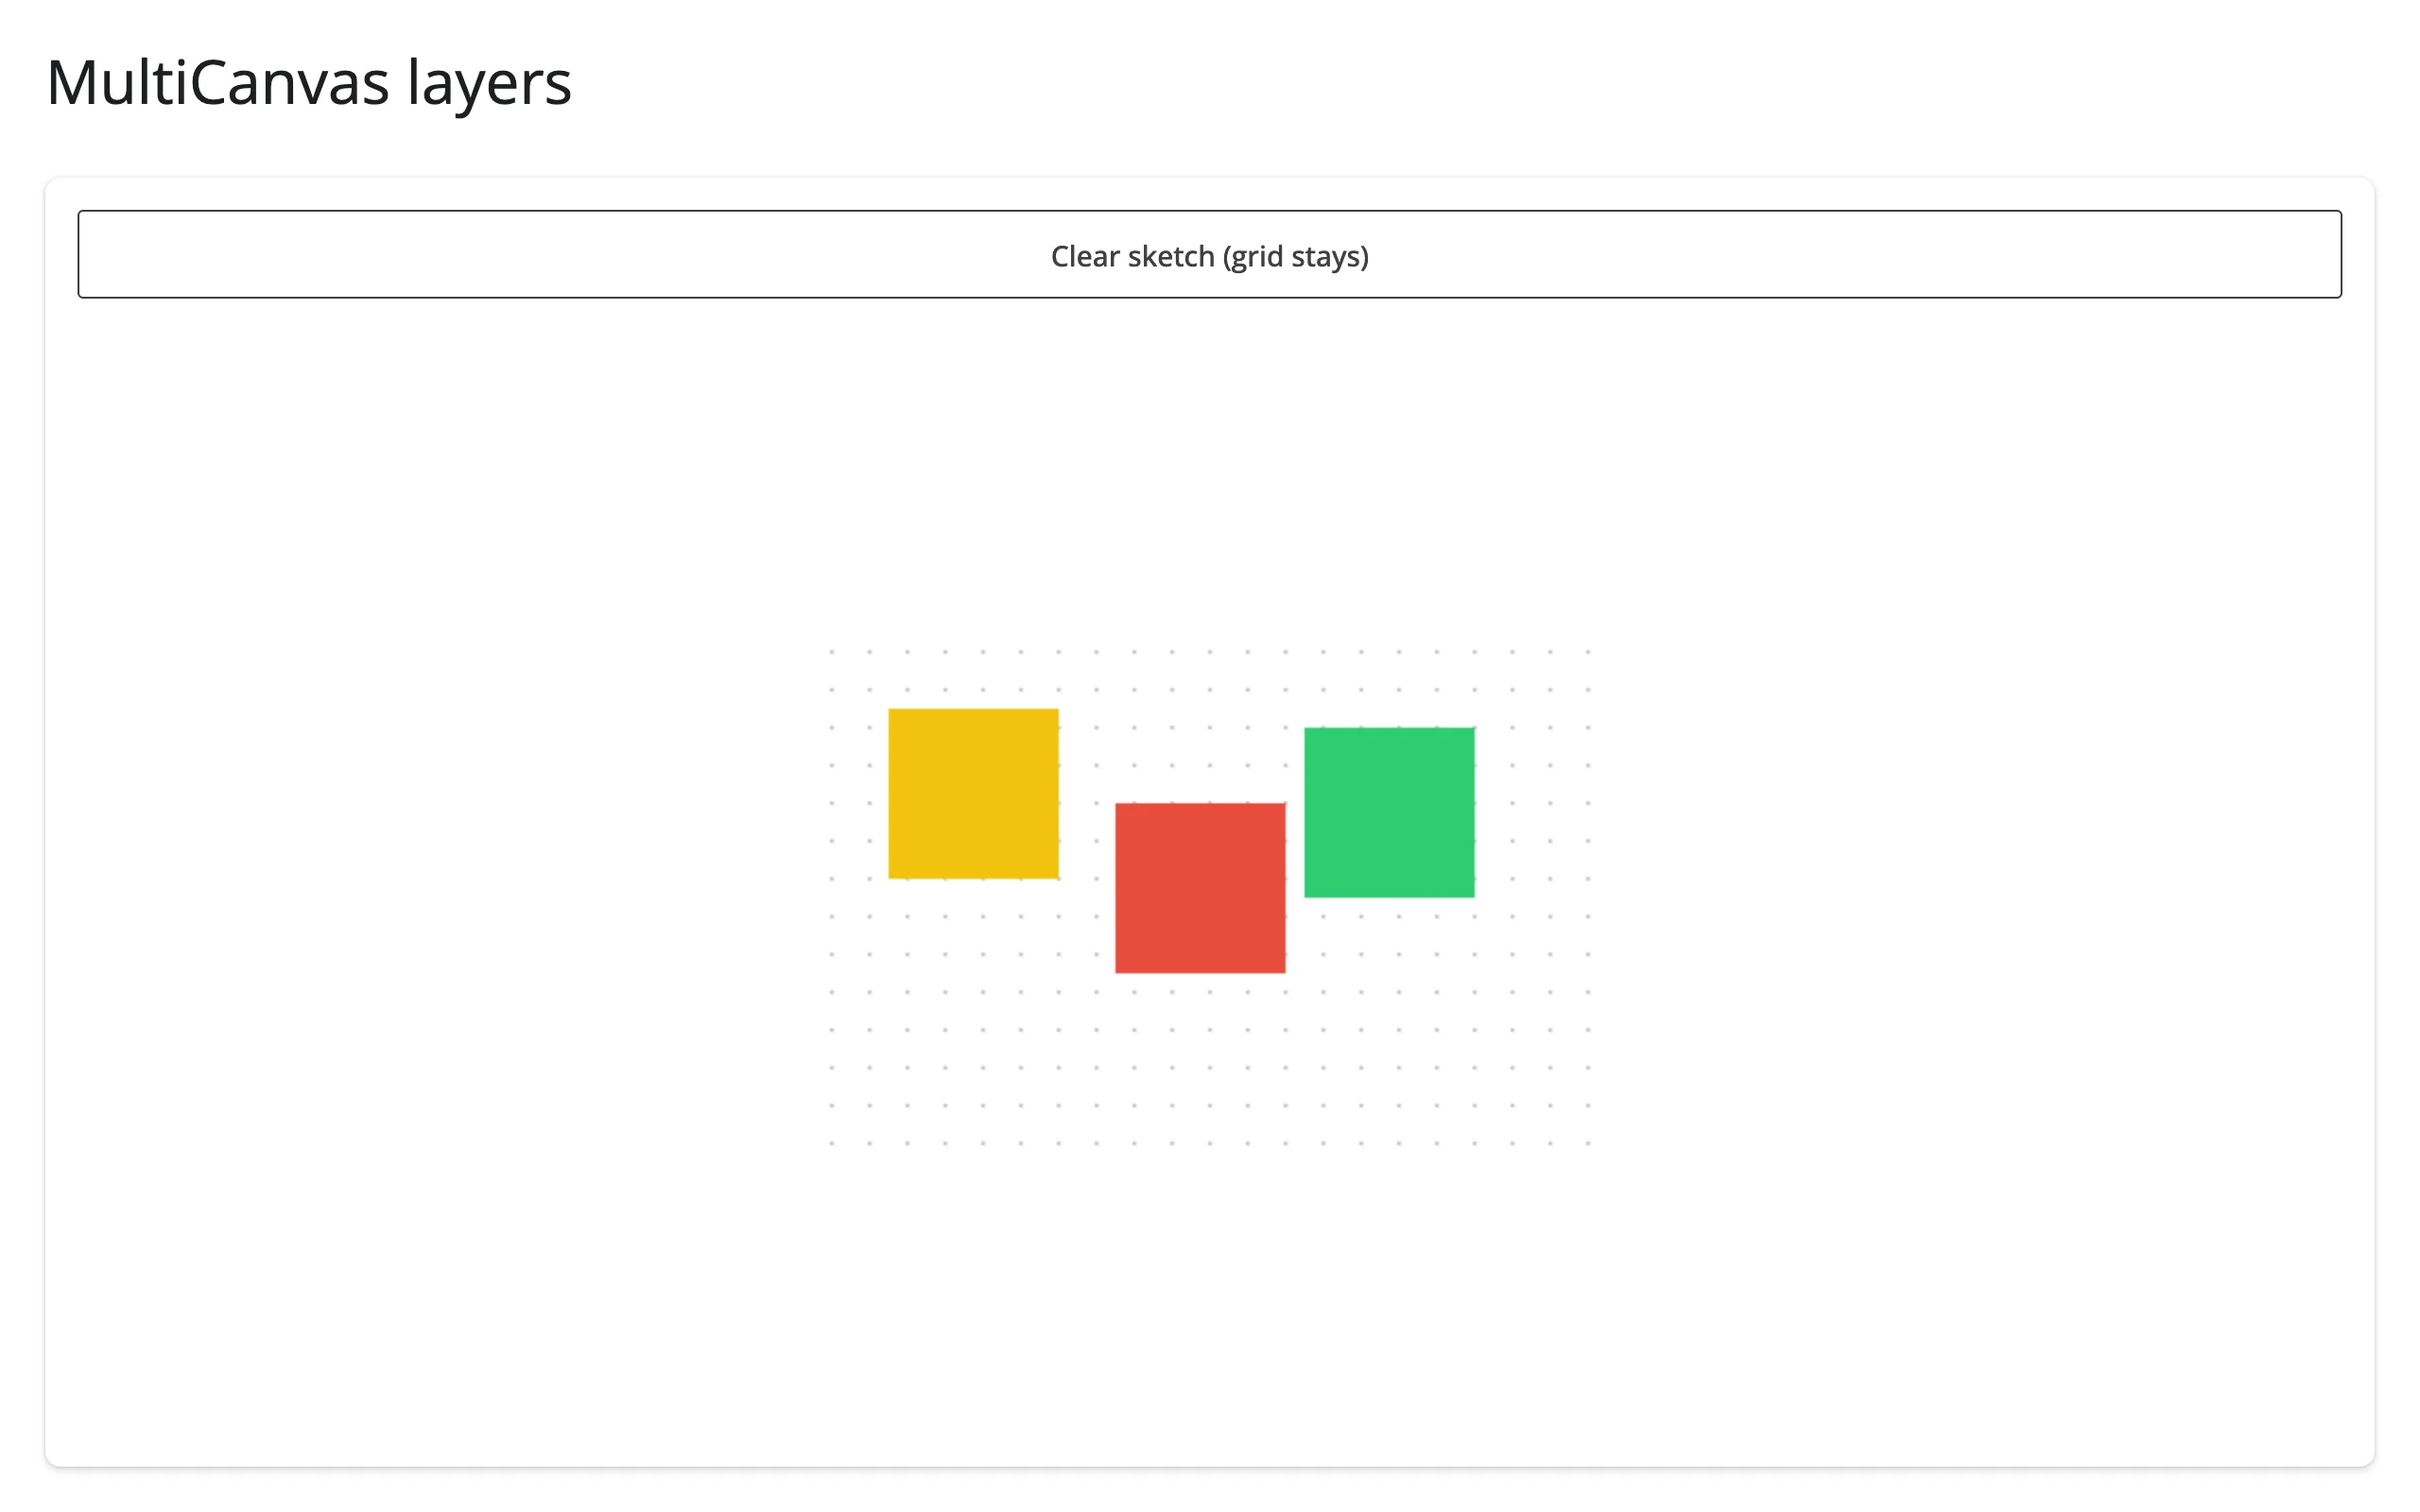 |
 |
Drawing numpy arrays with put_image_data
put_image_data(array, x, y) pushes an (h, w, 4) uint8 RGBA numpy array straight onto the canvas – useful for anything you’d rather compute as pixels than as a sequence of shape calls (heatmaps, images, simulation frames):
c.put_image_data(corr_to_rgba(corr, CELL), 0, 0)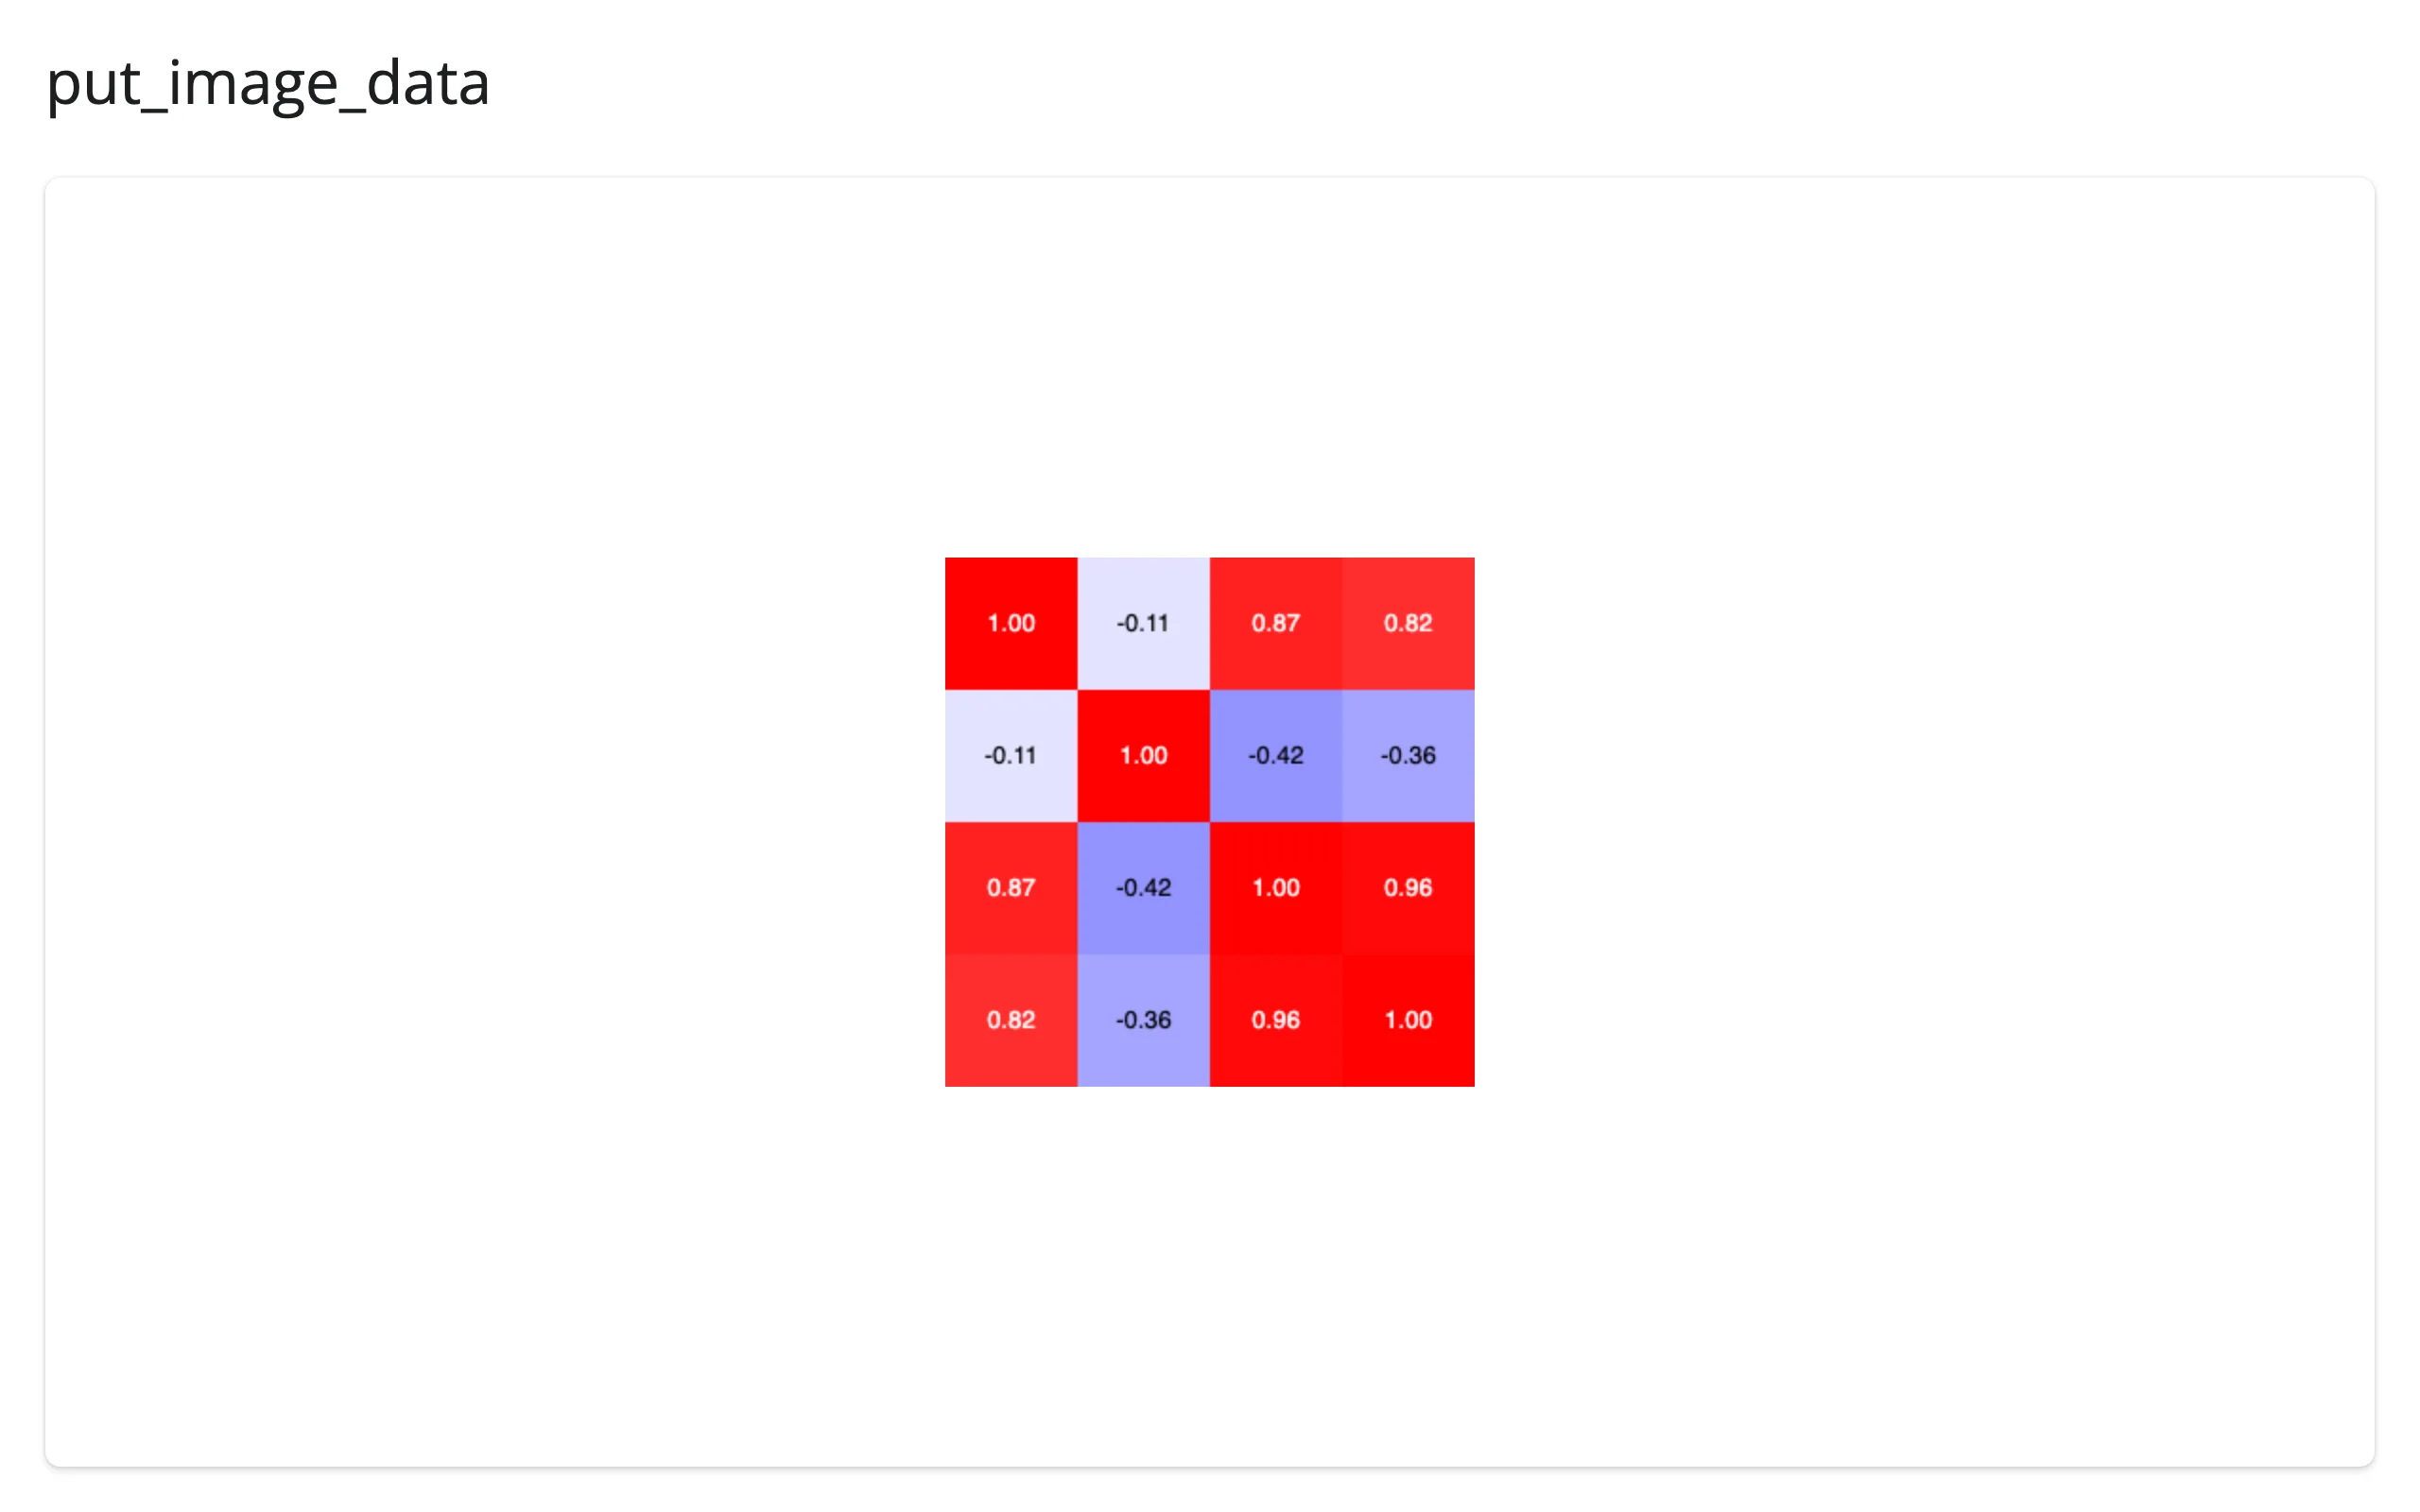
A Python-driven animation loop: Conway’s Game of Life
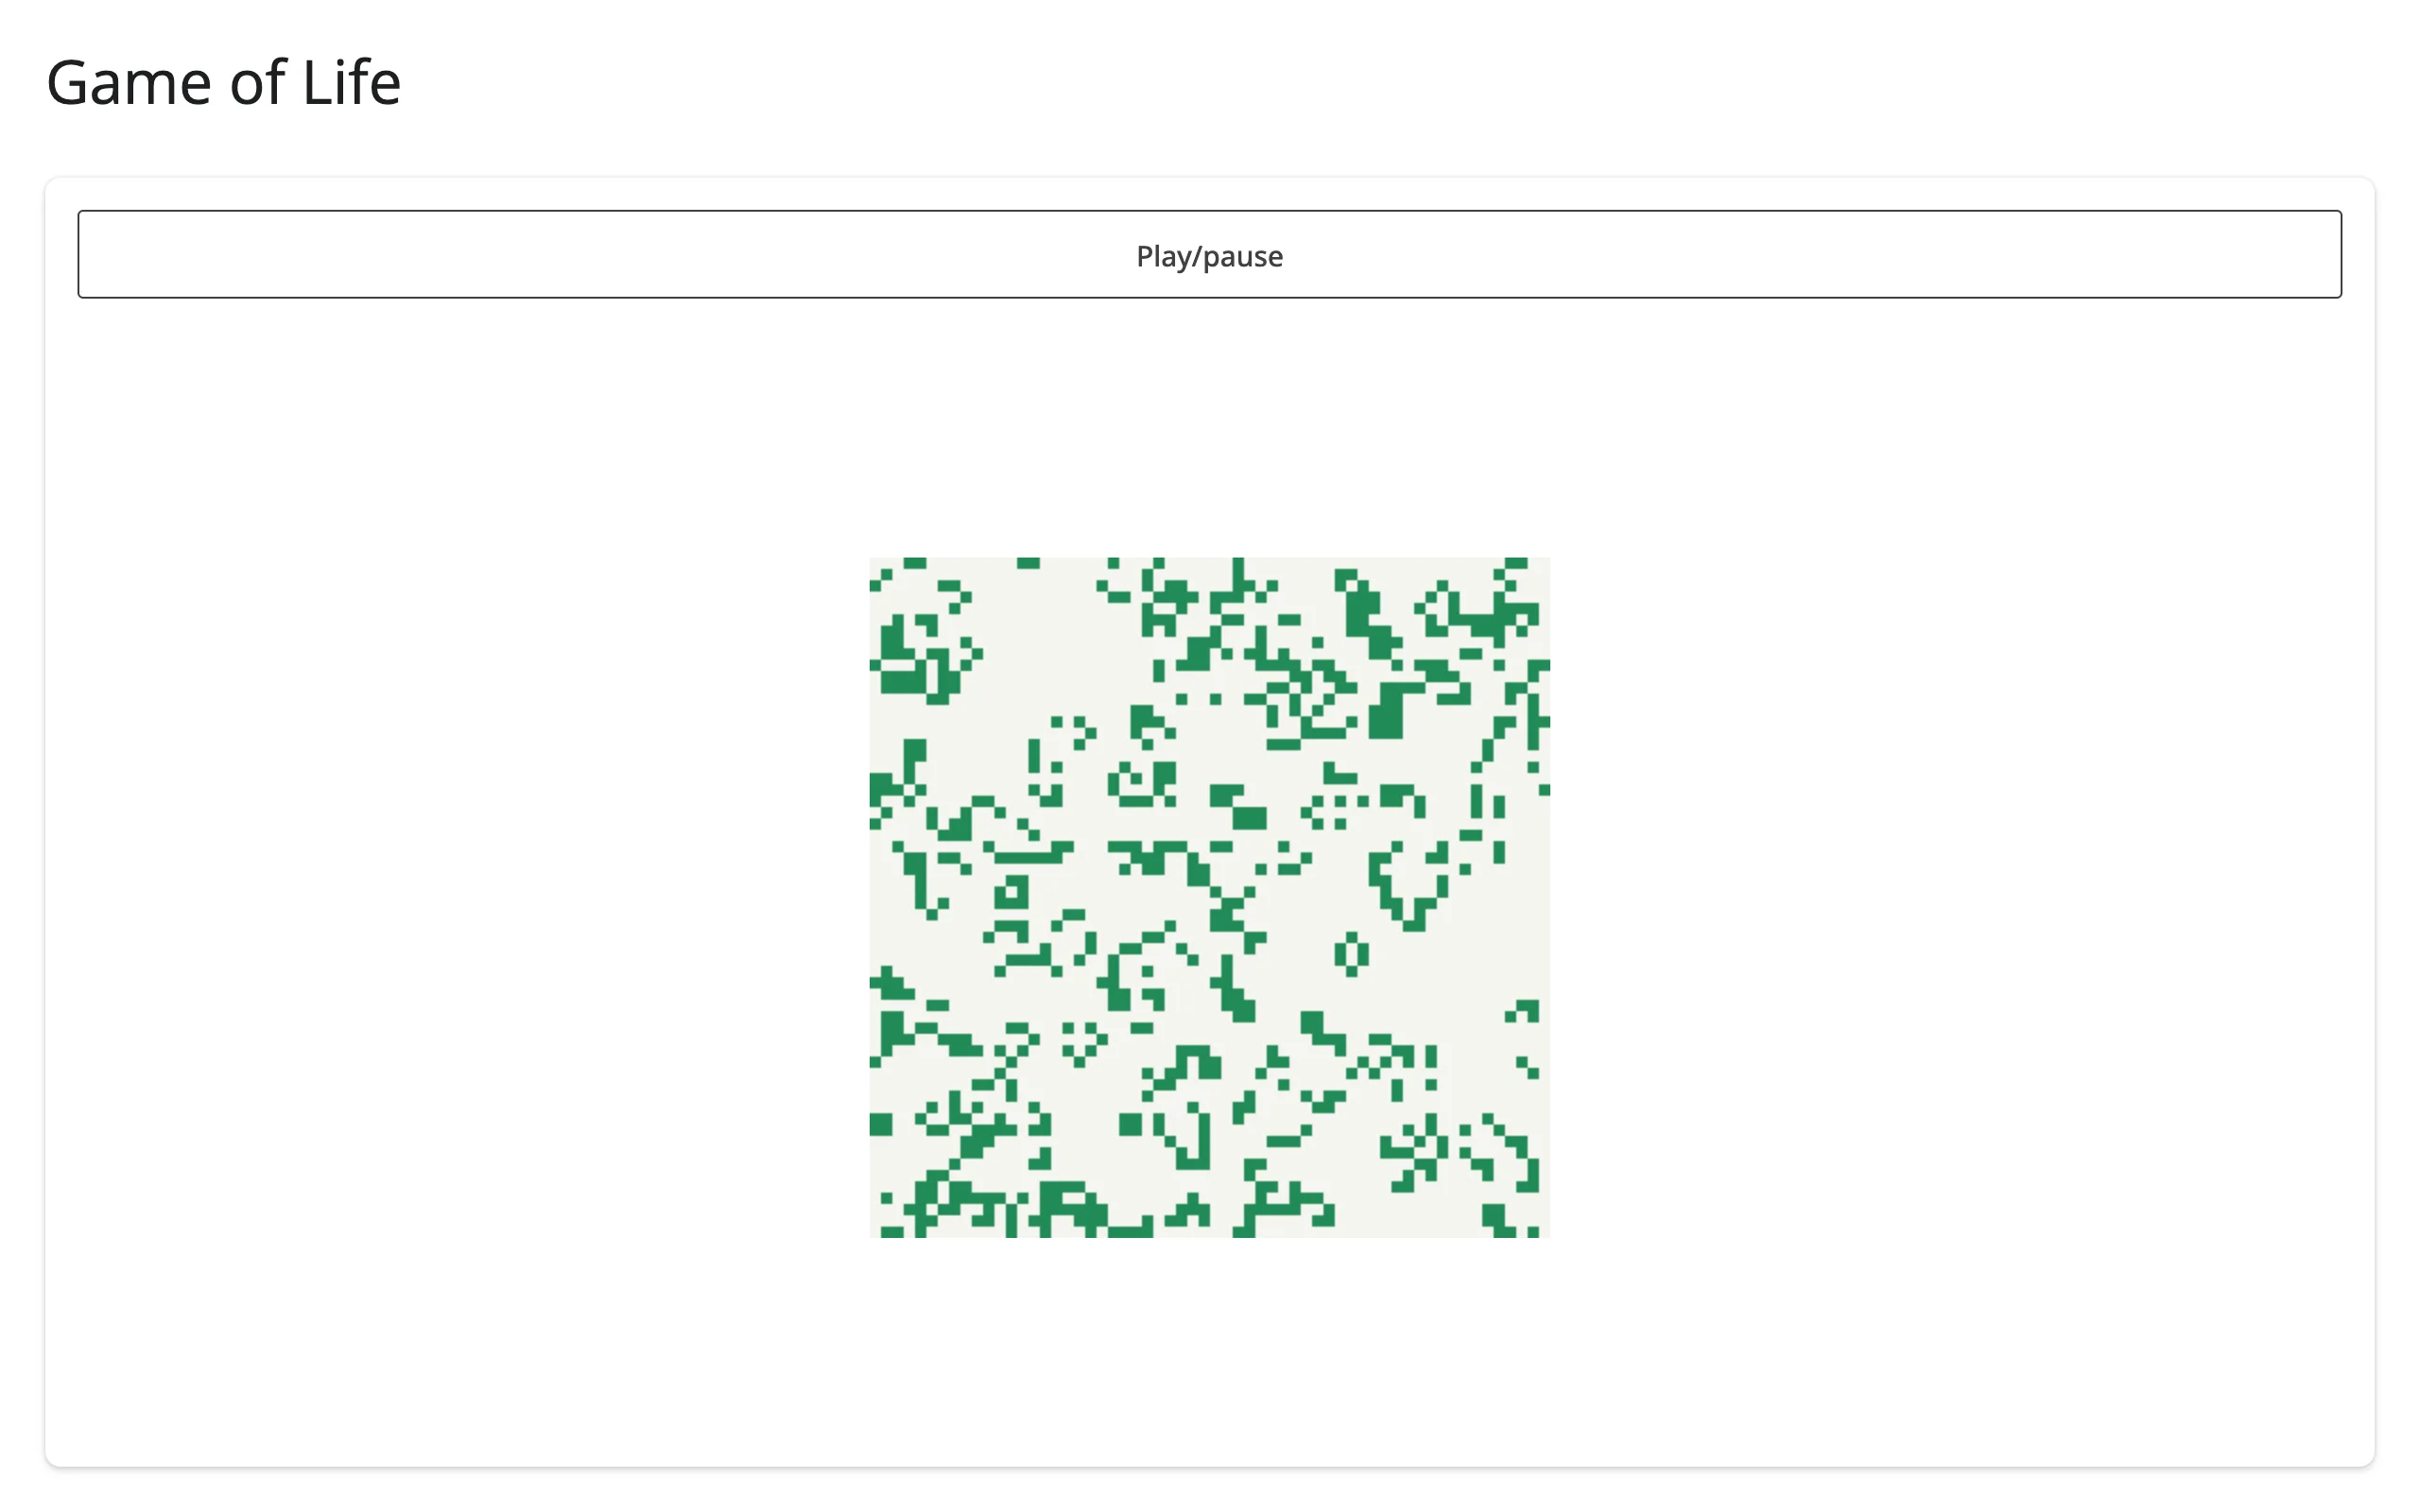
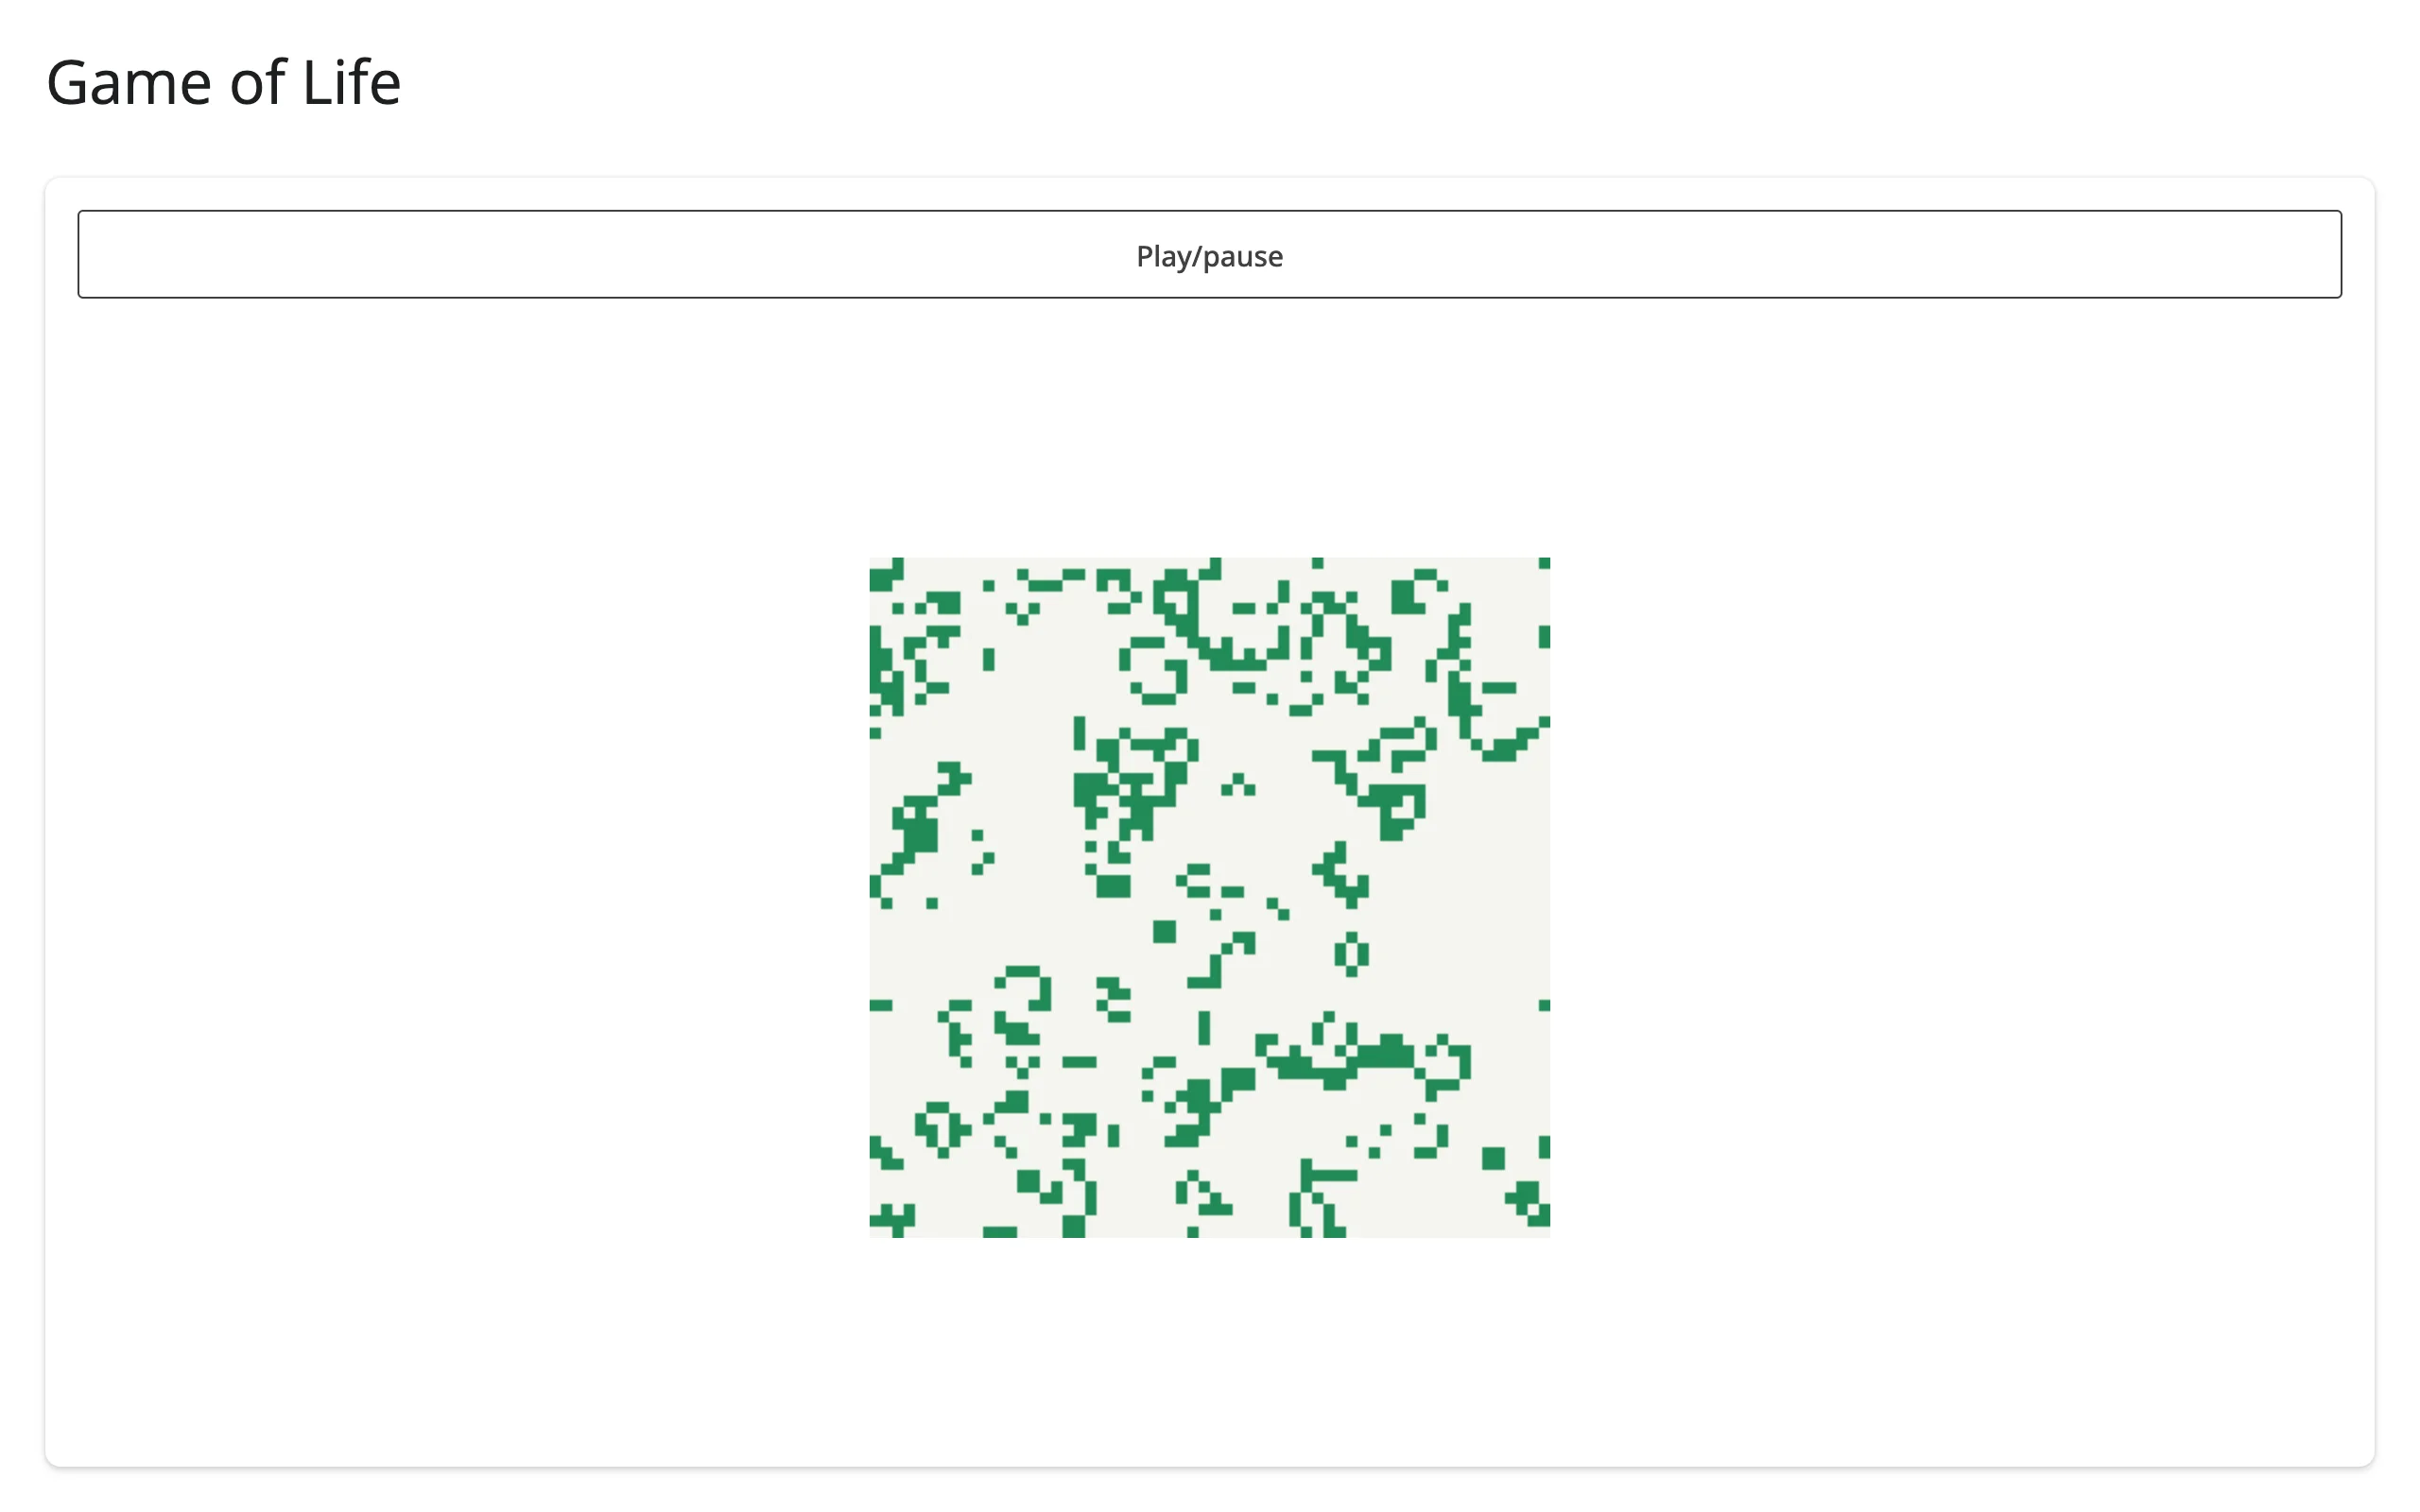
Because .widget stays live after render, a @reactive.effect with reactive.invalidate_later() can step a simulation and redraw every frame, entirely from Python – no client-side JavaScript loop required:
    @reactive.effect
    def _tick():
        global grid
        reactive.invalidate_later(0.15)
        if not running():
            return
        grid = step(grid)
        c = life.widget
        if c is not None:
c.put_image_data(grid_to_rgba(grid), 0, 0)| Frame 1 | ~1s later |
|---|---|
 |
 |
RoughCanvas: a hand-drawn look for free
Swap Canvas for RoughCanvas and every fill/stroke gets a sketchy, hand-drawn rendering style (rough_fill_style: hachure, cross-hatch, zigzag, dots, solid, and more) – no extra drawing code needed. The example wires the style choice to an input_select, so you can flip it live:
        c = RoughCanvas(width=420, height=220)
        c.rough_fill_style = input.style()
        c.fill_style = "#2c7fb8"
        c.fill_rect(20, 20, 160, 120)
        c.fill_style = "#e67e22"
        c.fill_circle(320, 80, 60)
        c.stroke_style = "#333"
        c.stroke_line(20, 180, 400, 180)
        return c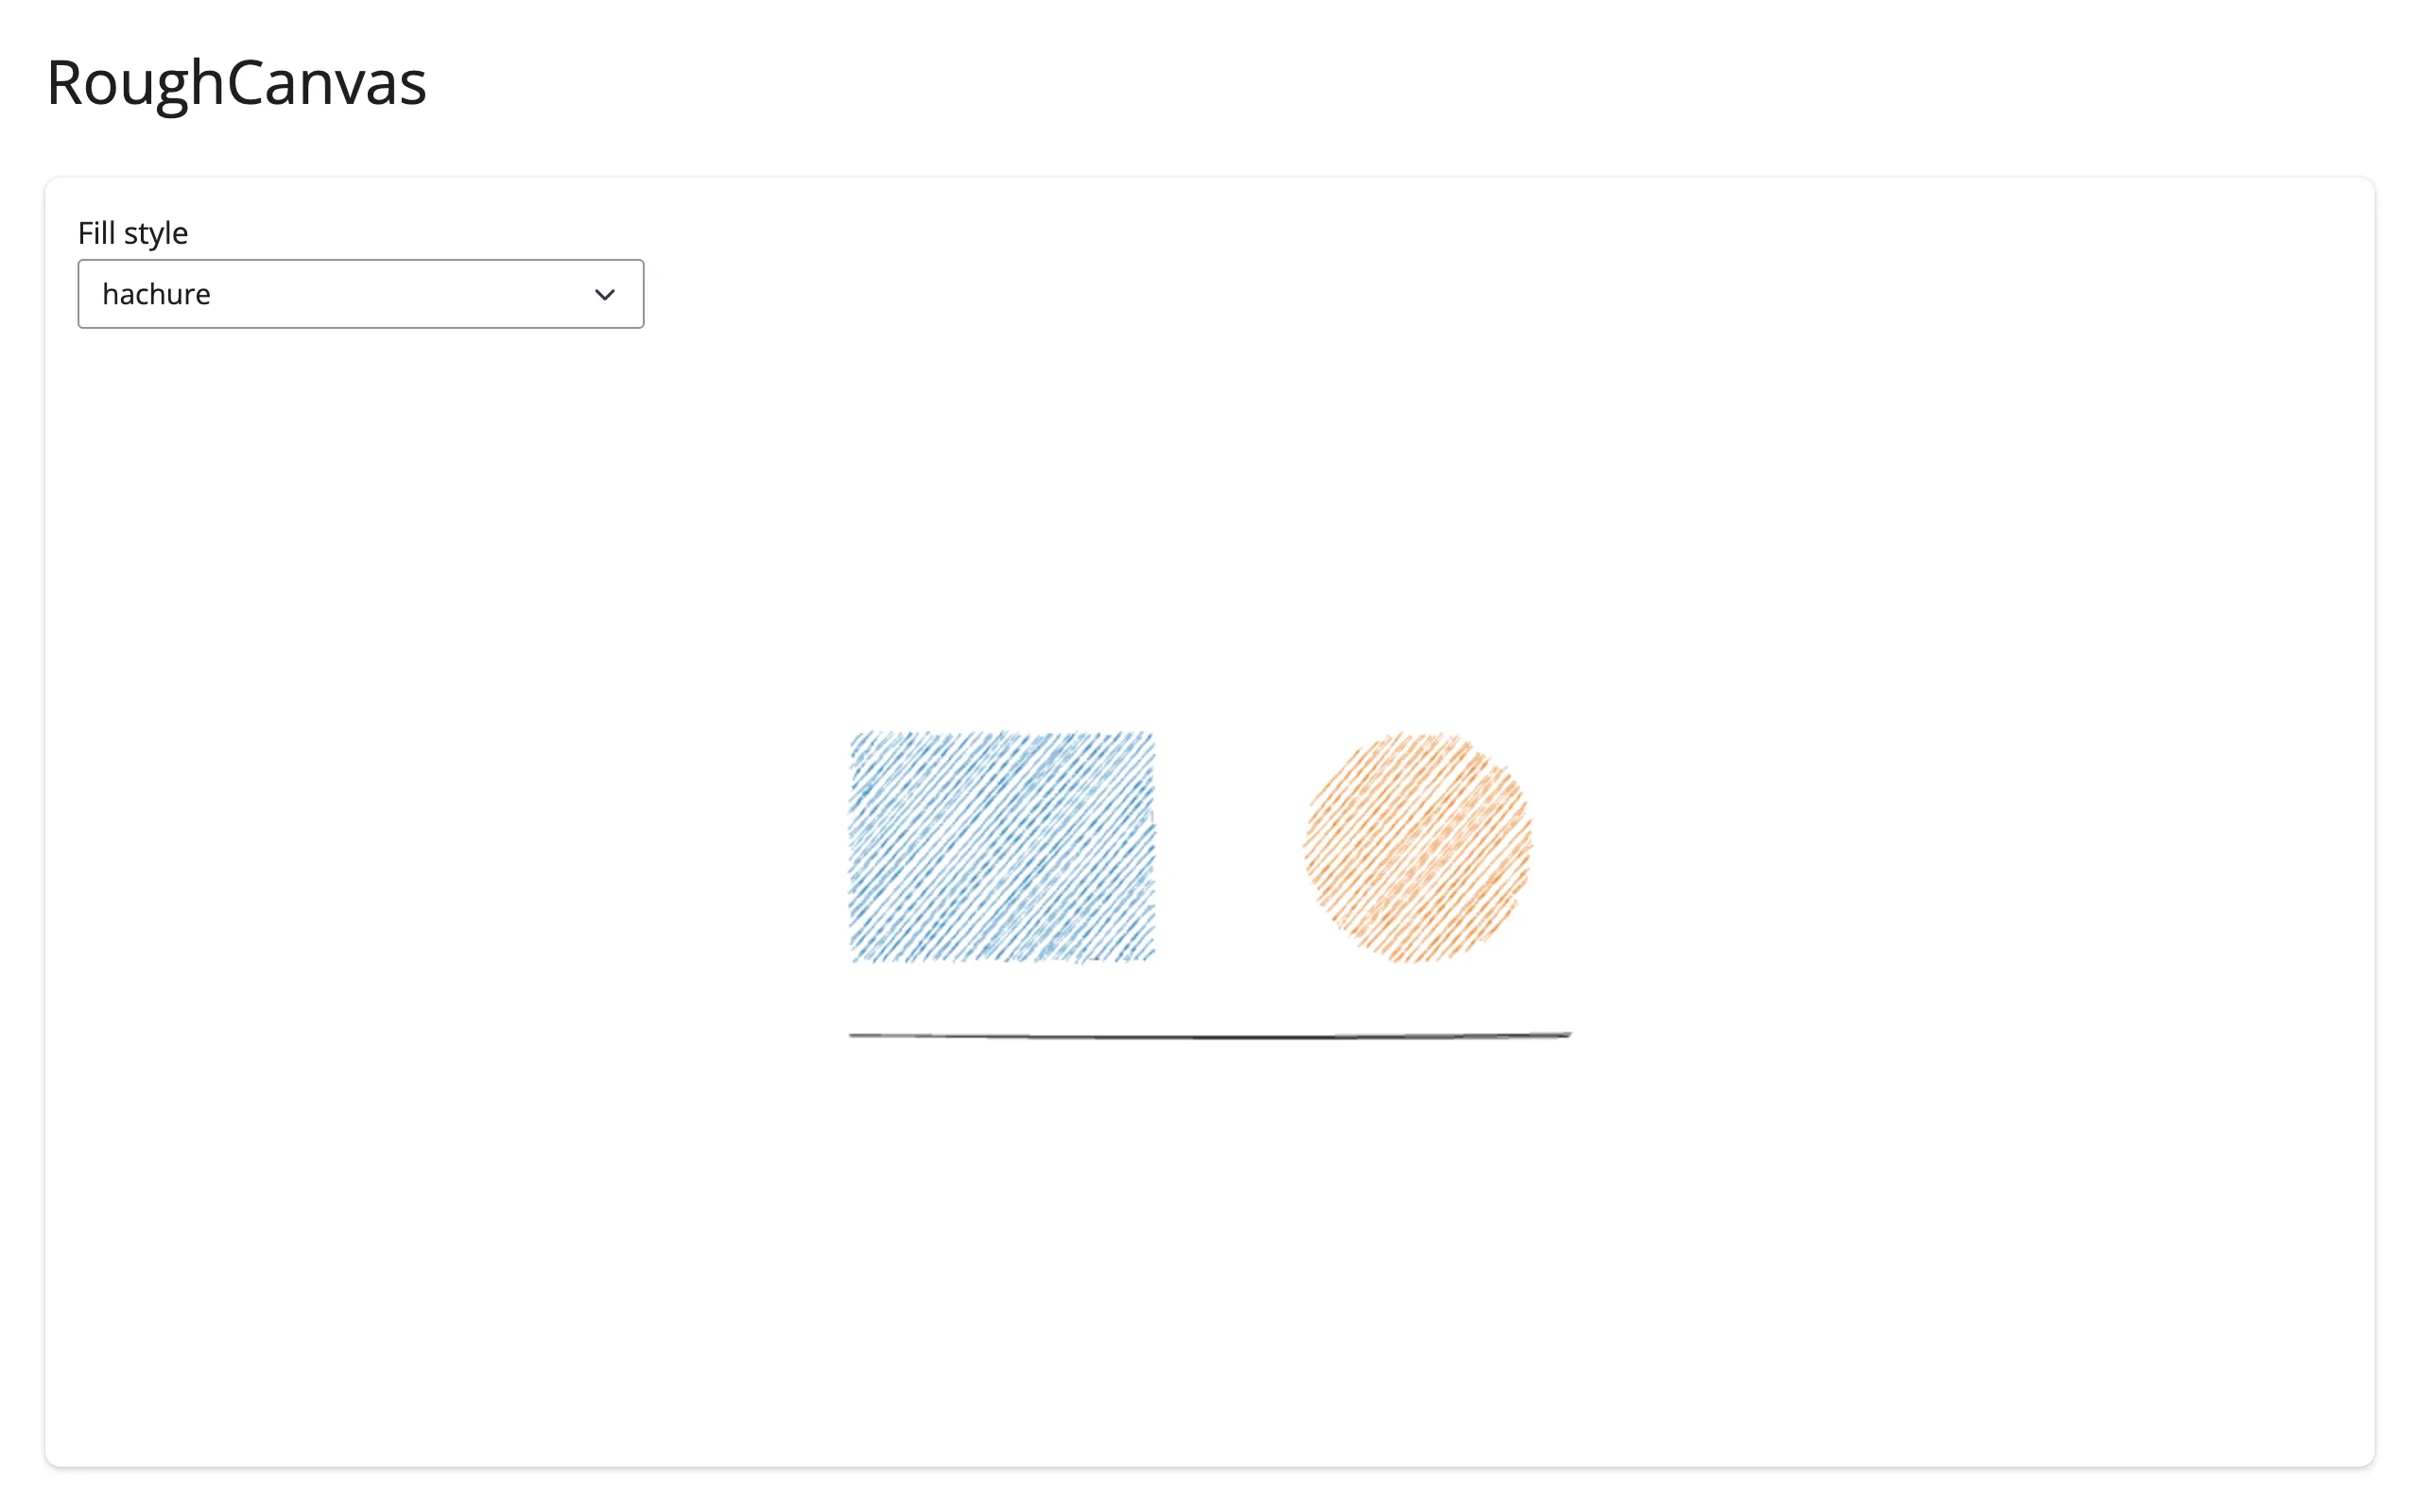
hold_canvas() is a no-op here (verified)
Upstream, ipycanvas.hold_canvas() batches draw commands by toggling a module-level manager shared by every kernel. shinywidgets gives each rendered canvas its own per-session manager instead (so one session’s drawing can never leak into another’s browser) – so hold_canvas() ends up toggling a manager nobody’s canvas is actually using. Drawing inside the block still works, command by command, just not batched into one message:
with hold_canvas(c):
    for i in range(8):
        c.fill_style = f"hsl({i * 40}, 65%, 55%)"
        c.fill_rect(10 + i * 50, 20, 40, 20 + i * 20)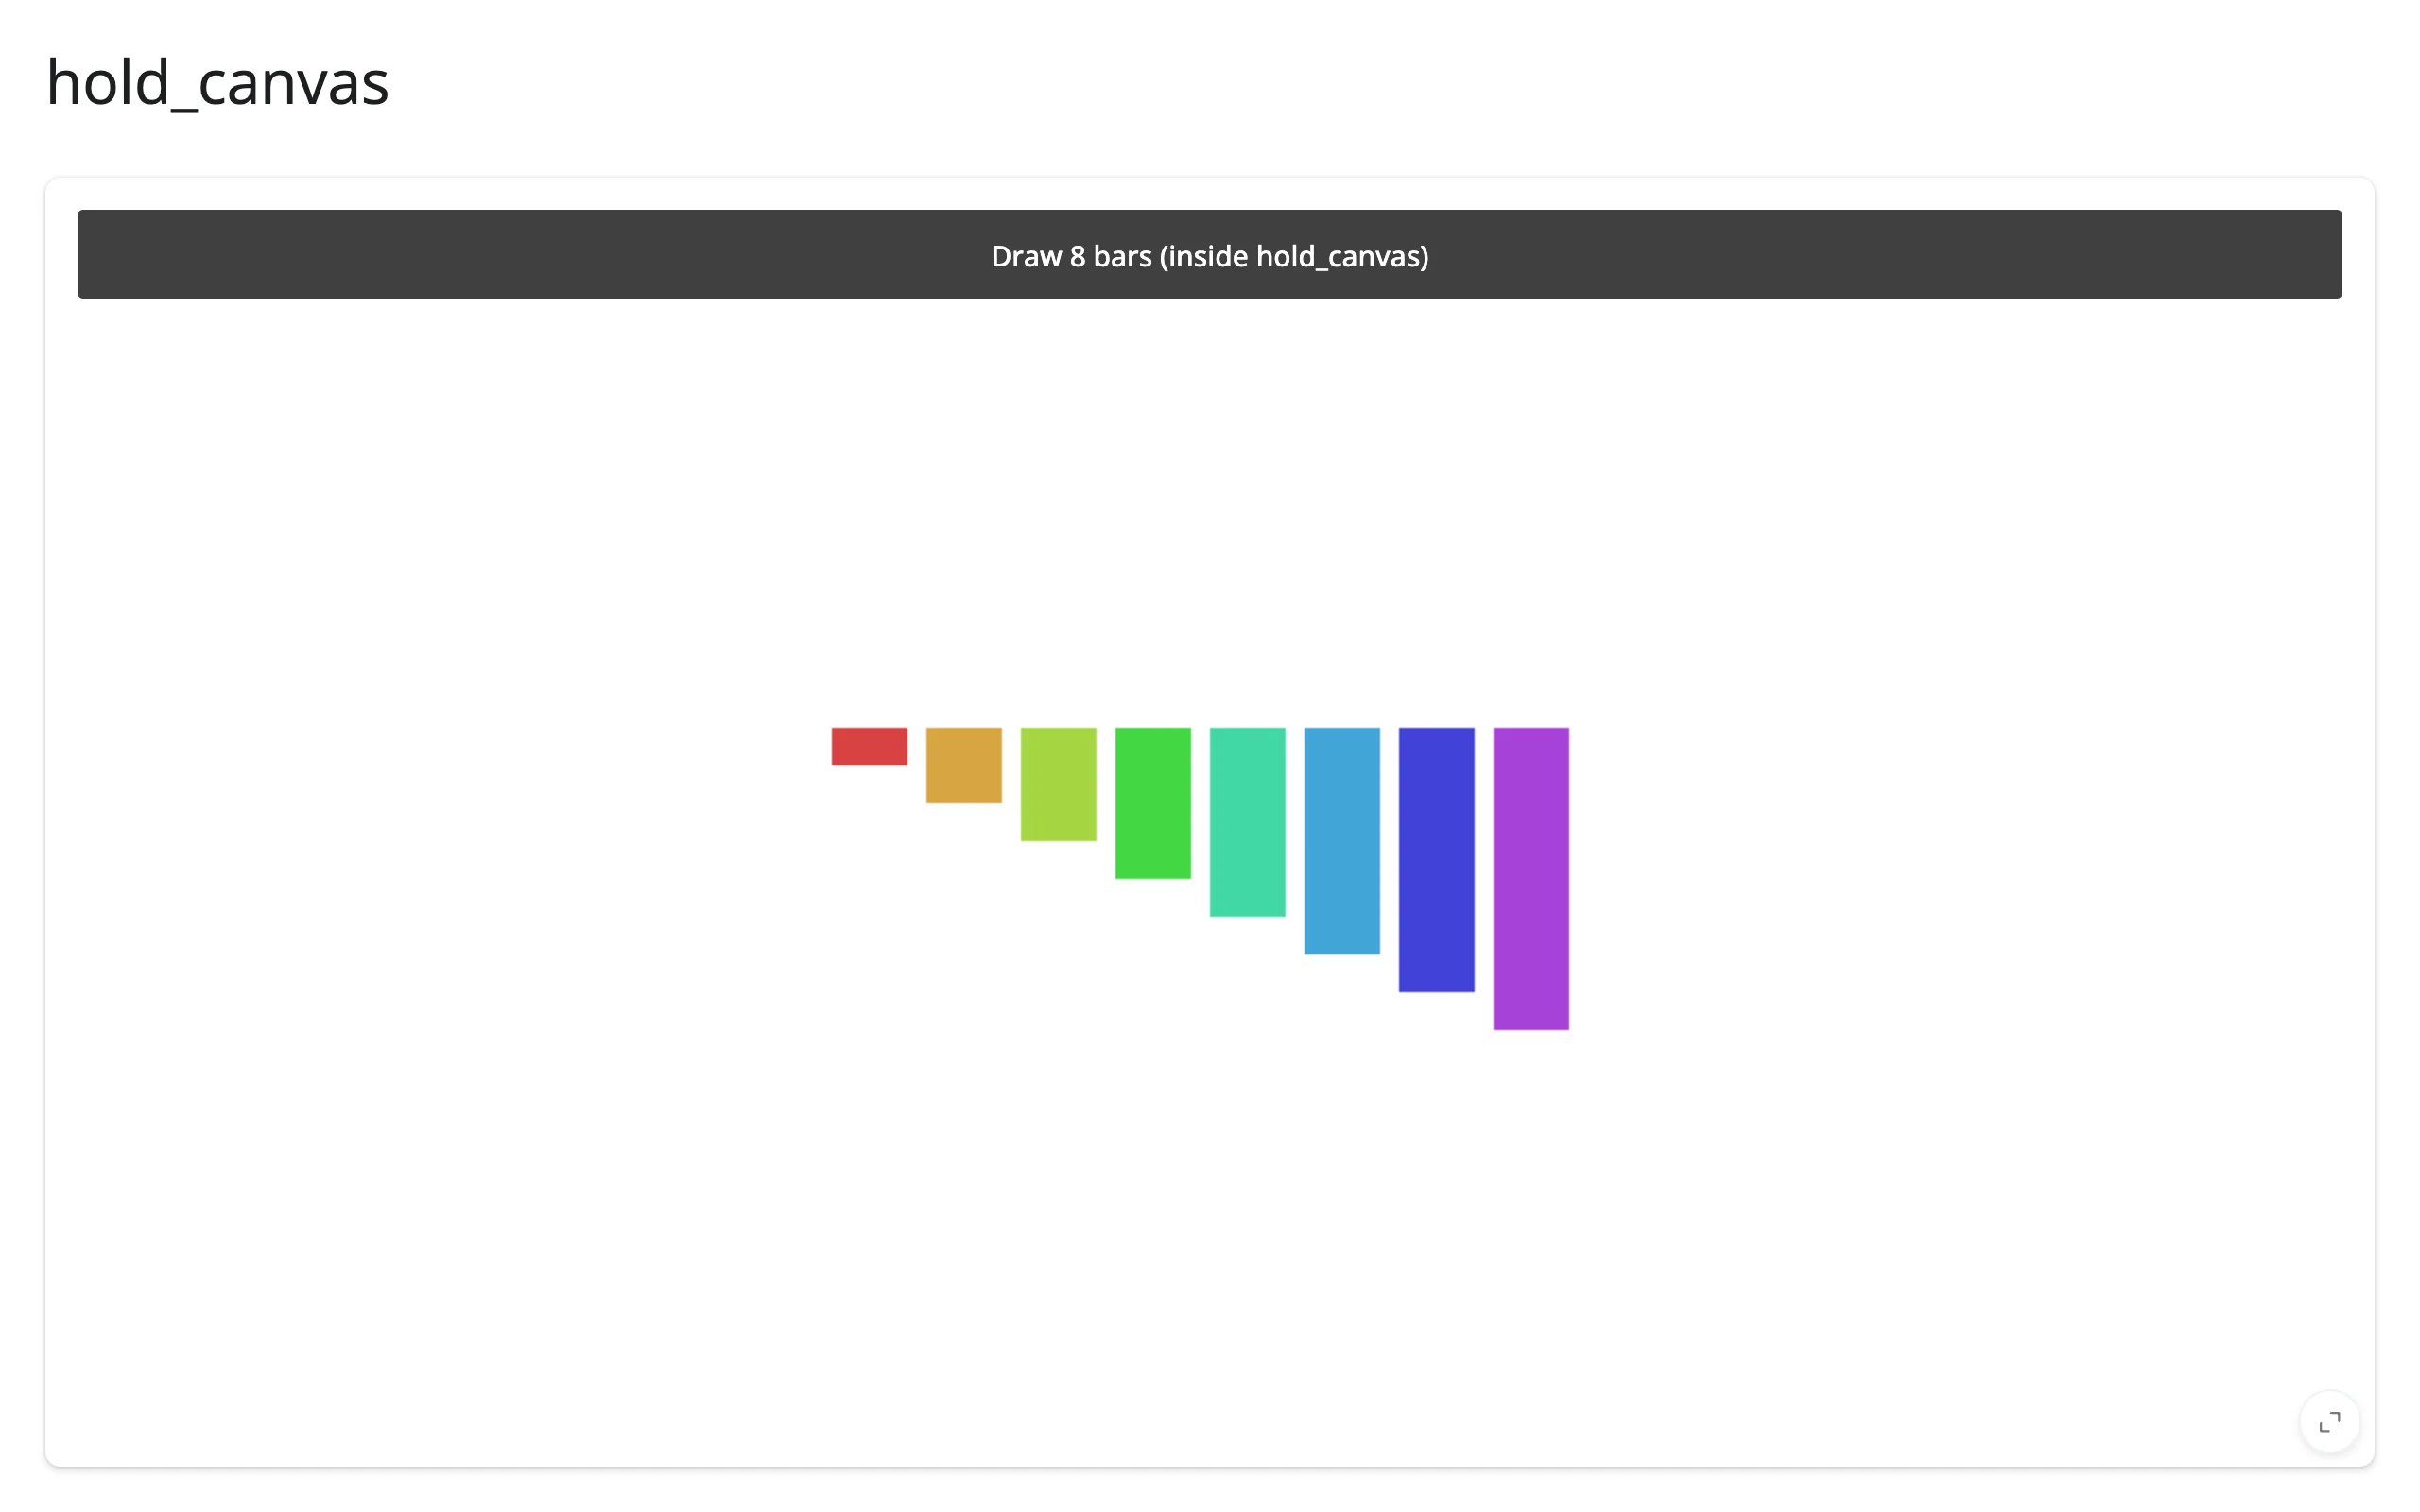
All 8 bars still appear correctly – the only thing lost is a network-level optimization, confirmed by reading ipycanvas 0.14.3’s own source (hold_canvas() toggles ipycanvas.canvas._CANVAS_MANAGER, which shinywidgets replaces per-canvas before the canvas’s state is ever serialized). It’s safe to leave hold_canvas() in code shared with Jupyter; it just won’t do anything extra under Shiny.
Reacting to user interaction
ipycanvas declares no accessors. Its events are lower-level than “a selection changed” – they’re raw browser events (on_mouse_down, on_mouse_move, on_mouse_up, on_mouse_out, on_mouse_wheel, on_key_down, touch start/end/move/cancel) that call a plain Python function with the event’s data. The recipe below is the one thing to learn; everything else in this roster’s “accessors” is this pattern pre-built for you.
The recipe: browser events to reactive values
Register a callback inside the render function. Inside it, read input.*() directly (no reactive context is needed there) and call .set() on a reactive.value to publish what happened (examples/08_mouse_events_recipe.py):
last_point = reactive.value(None)
stroke_count = reactive.value(0)
drawing = {"active": False}

with ui.layout_columns(col_widths=(8, 4)):
    with ui.card(full_screen=True):

        @render_ipycanvas
        def canvas():
            c = Canvas(width=420, height=260)
            c.fill_style = "#f4f1ea"
            c.fill_rect(0, 0, 420, 260)

            def on_down(x, y):
                drawing["active"] = True
                stroke_count.set(stroke_count() + 1)
                last_point.set((x, y))

            def on_move(x, y):
                if not drawing["active"]:
                    return
                c.stroke_style = "#2c7fb8"
                c.line_width = 3
                c.stroke_line(*last_point(), x, y)
                last_point.set((x, y))

            def on_up(x, y):
                drawing["active"] = False

            c.on_mouse_down(on_down)
            c.on_mouse_move(on_move)
            c.on_mouse_up(on_up)
            c.on_mouse_out(on_up)
            return c

    with ui.card():
        ui.card_header("What Python saw")

        @render.text
        def info():
            pt = last_point()
            pt_str = f"{pt[0]:.0f}, {pt[1]:.0f}" if pt else "none yet"
            return f"Strokes started: {stroke_count()}\nLast point: {pt_str}"
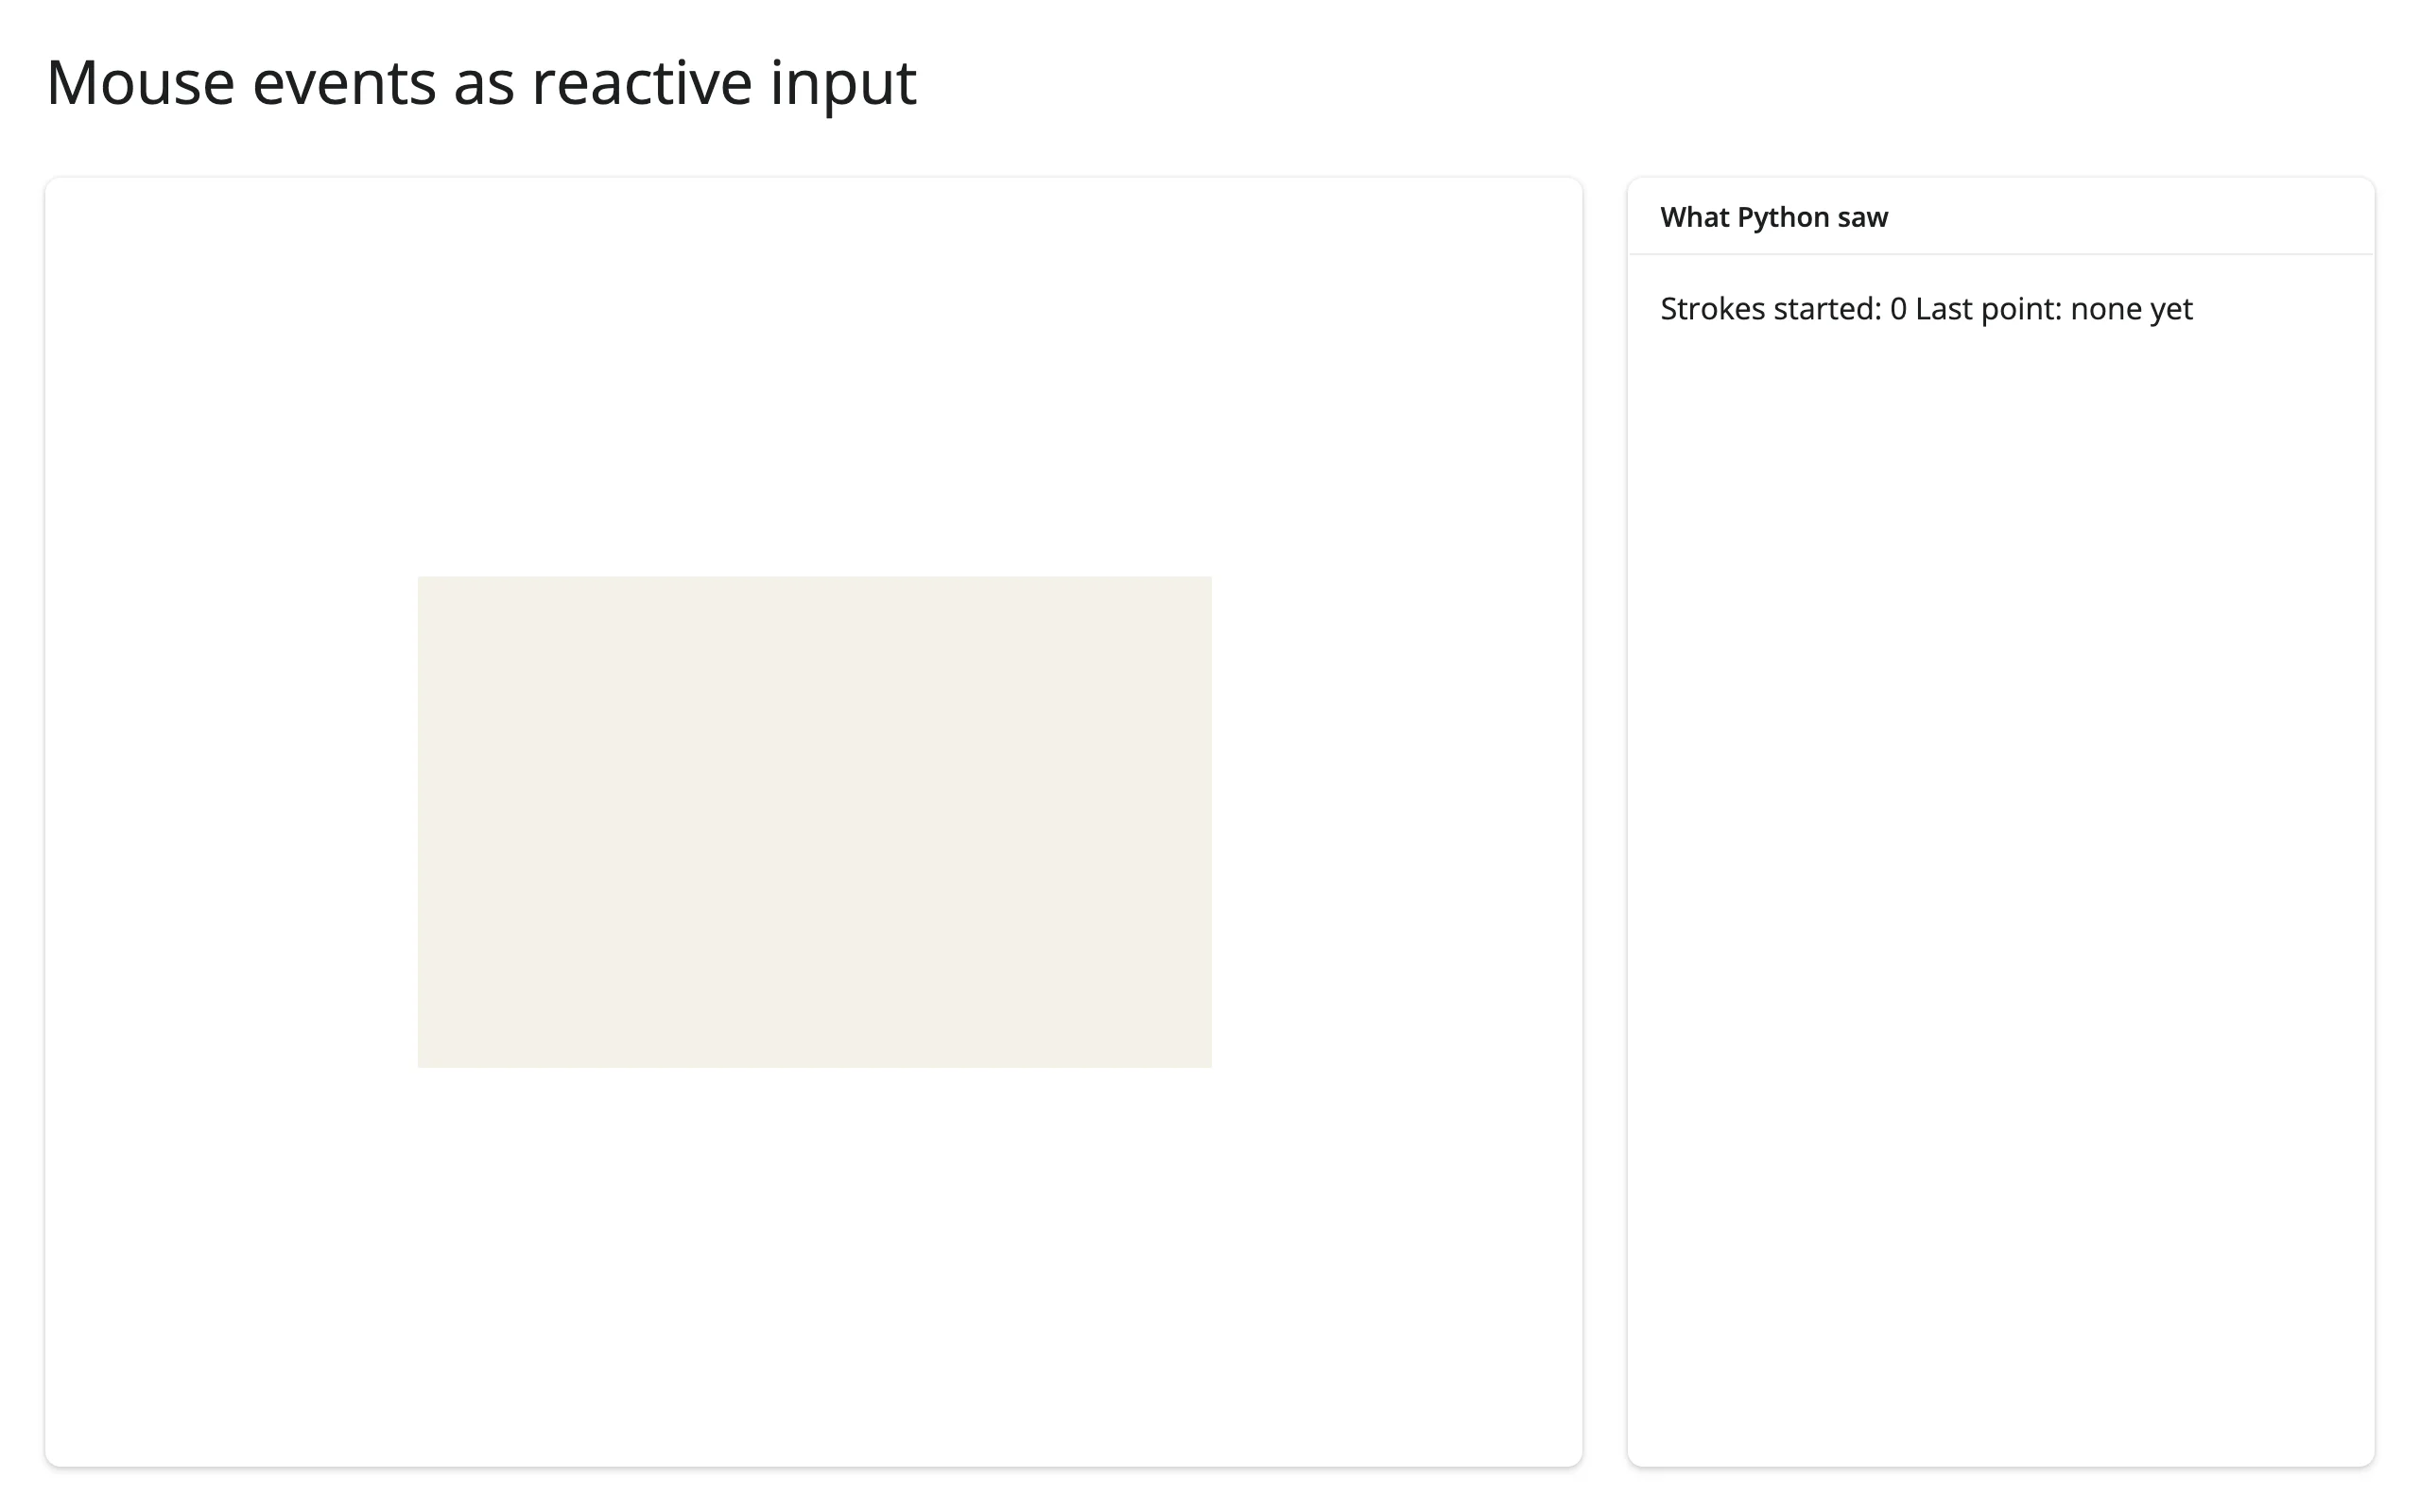
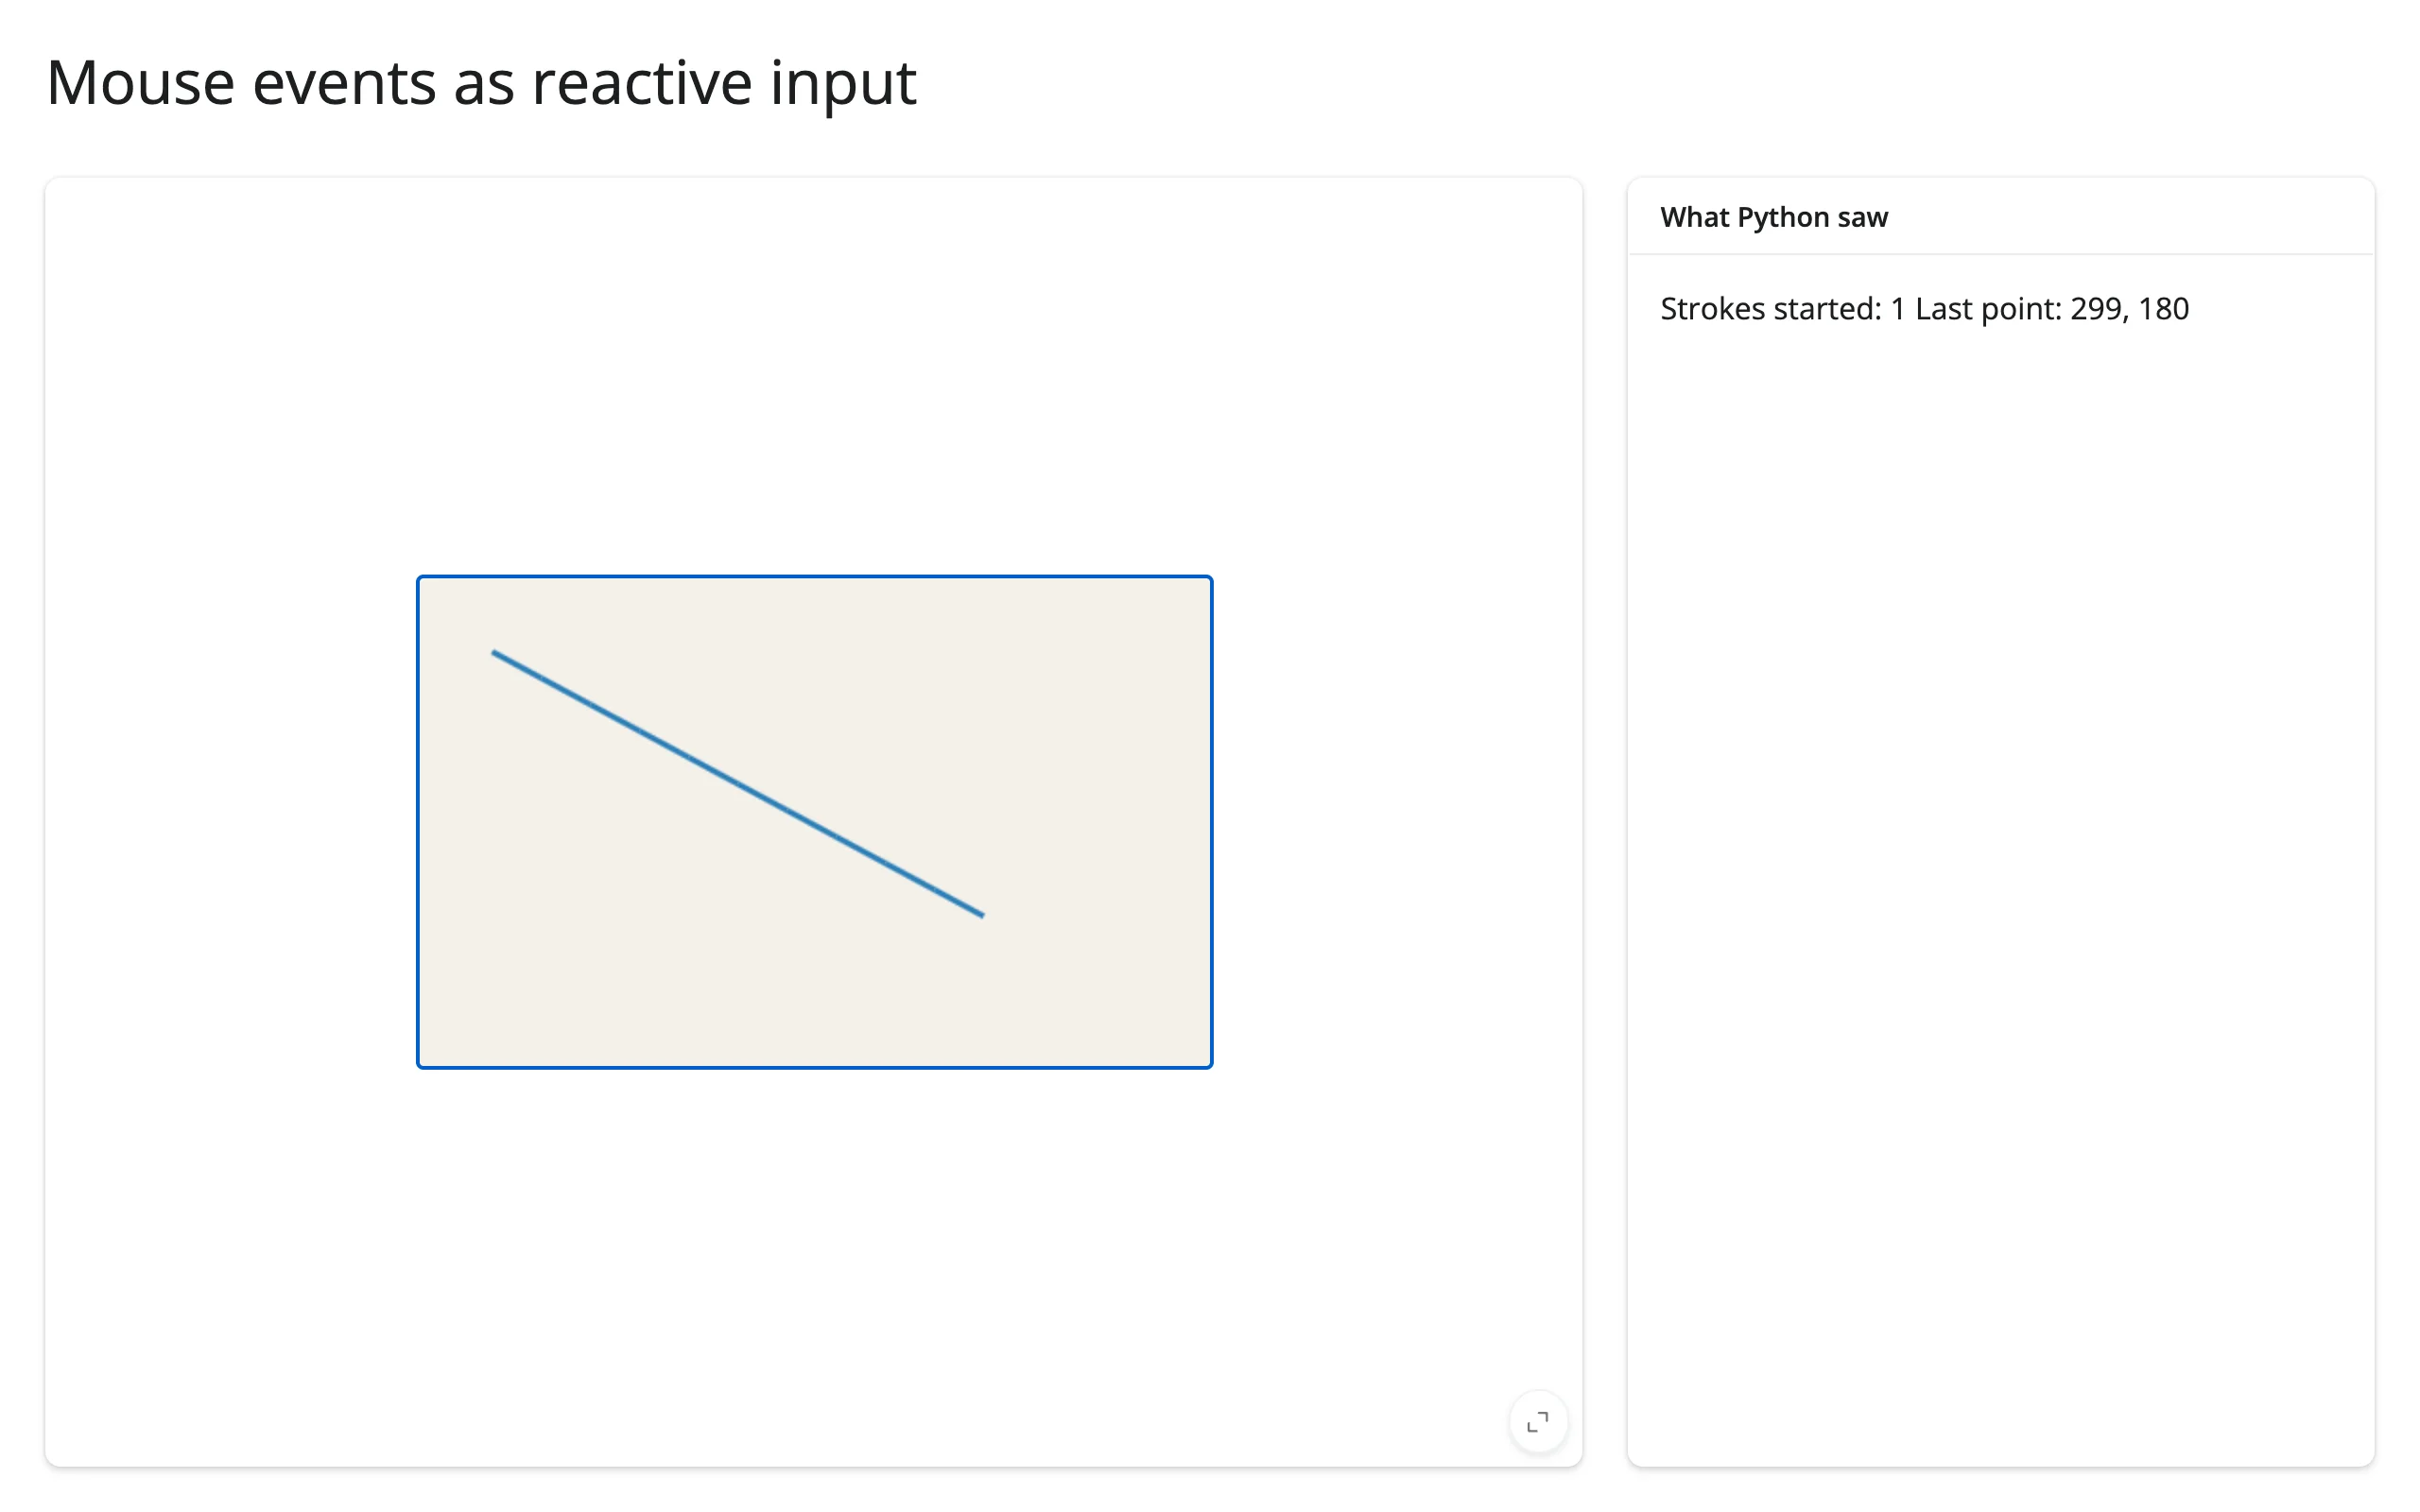
(x, y) arrive in drawing-buffer pixels, already correctly scaled even when the canvas is CSS-shrunk by a filling layout. Other outputs read stroke_count()/last_point() like any other reactive value (the info() output in the example).
| Before | After a drag |
|---|---|
 |
 |
Keyboard events
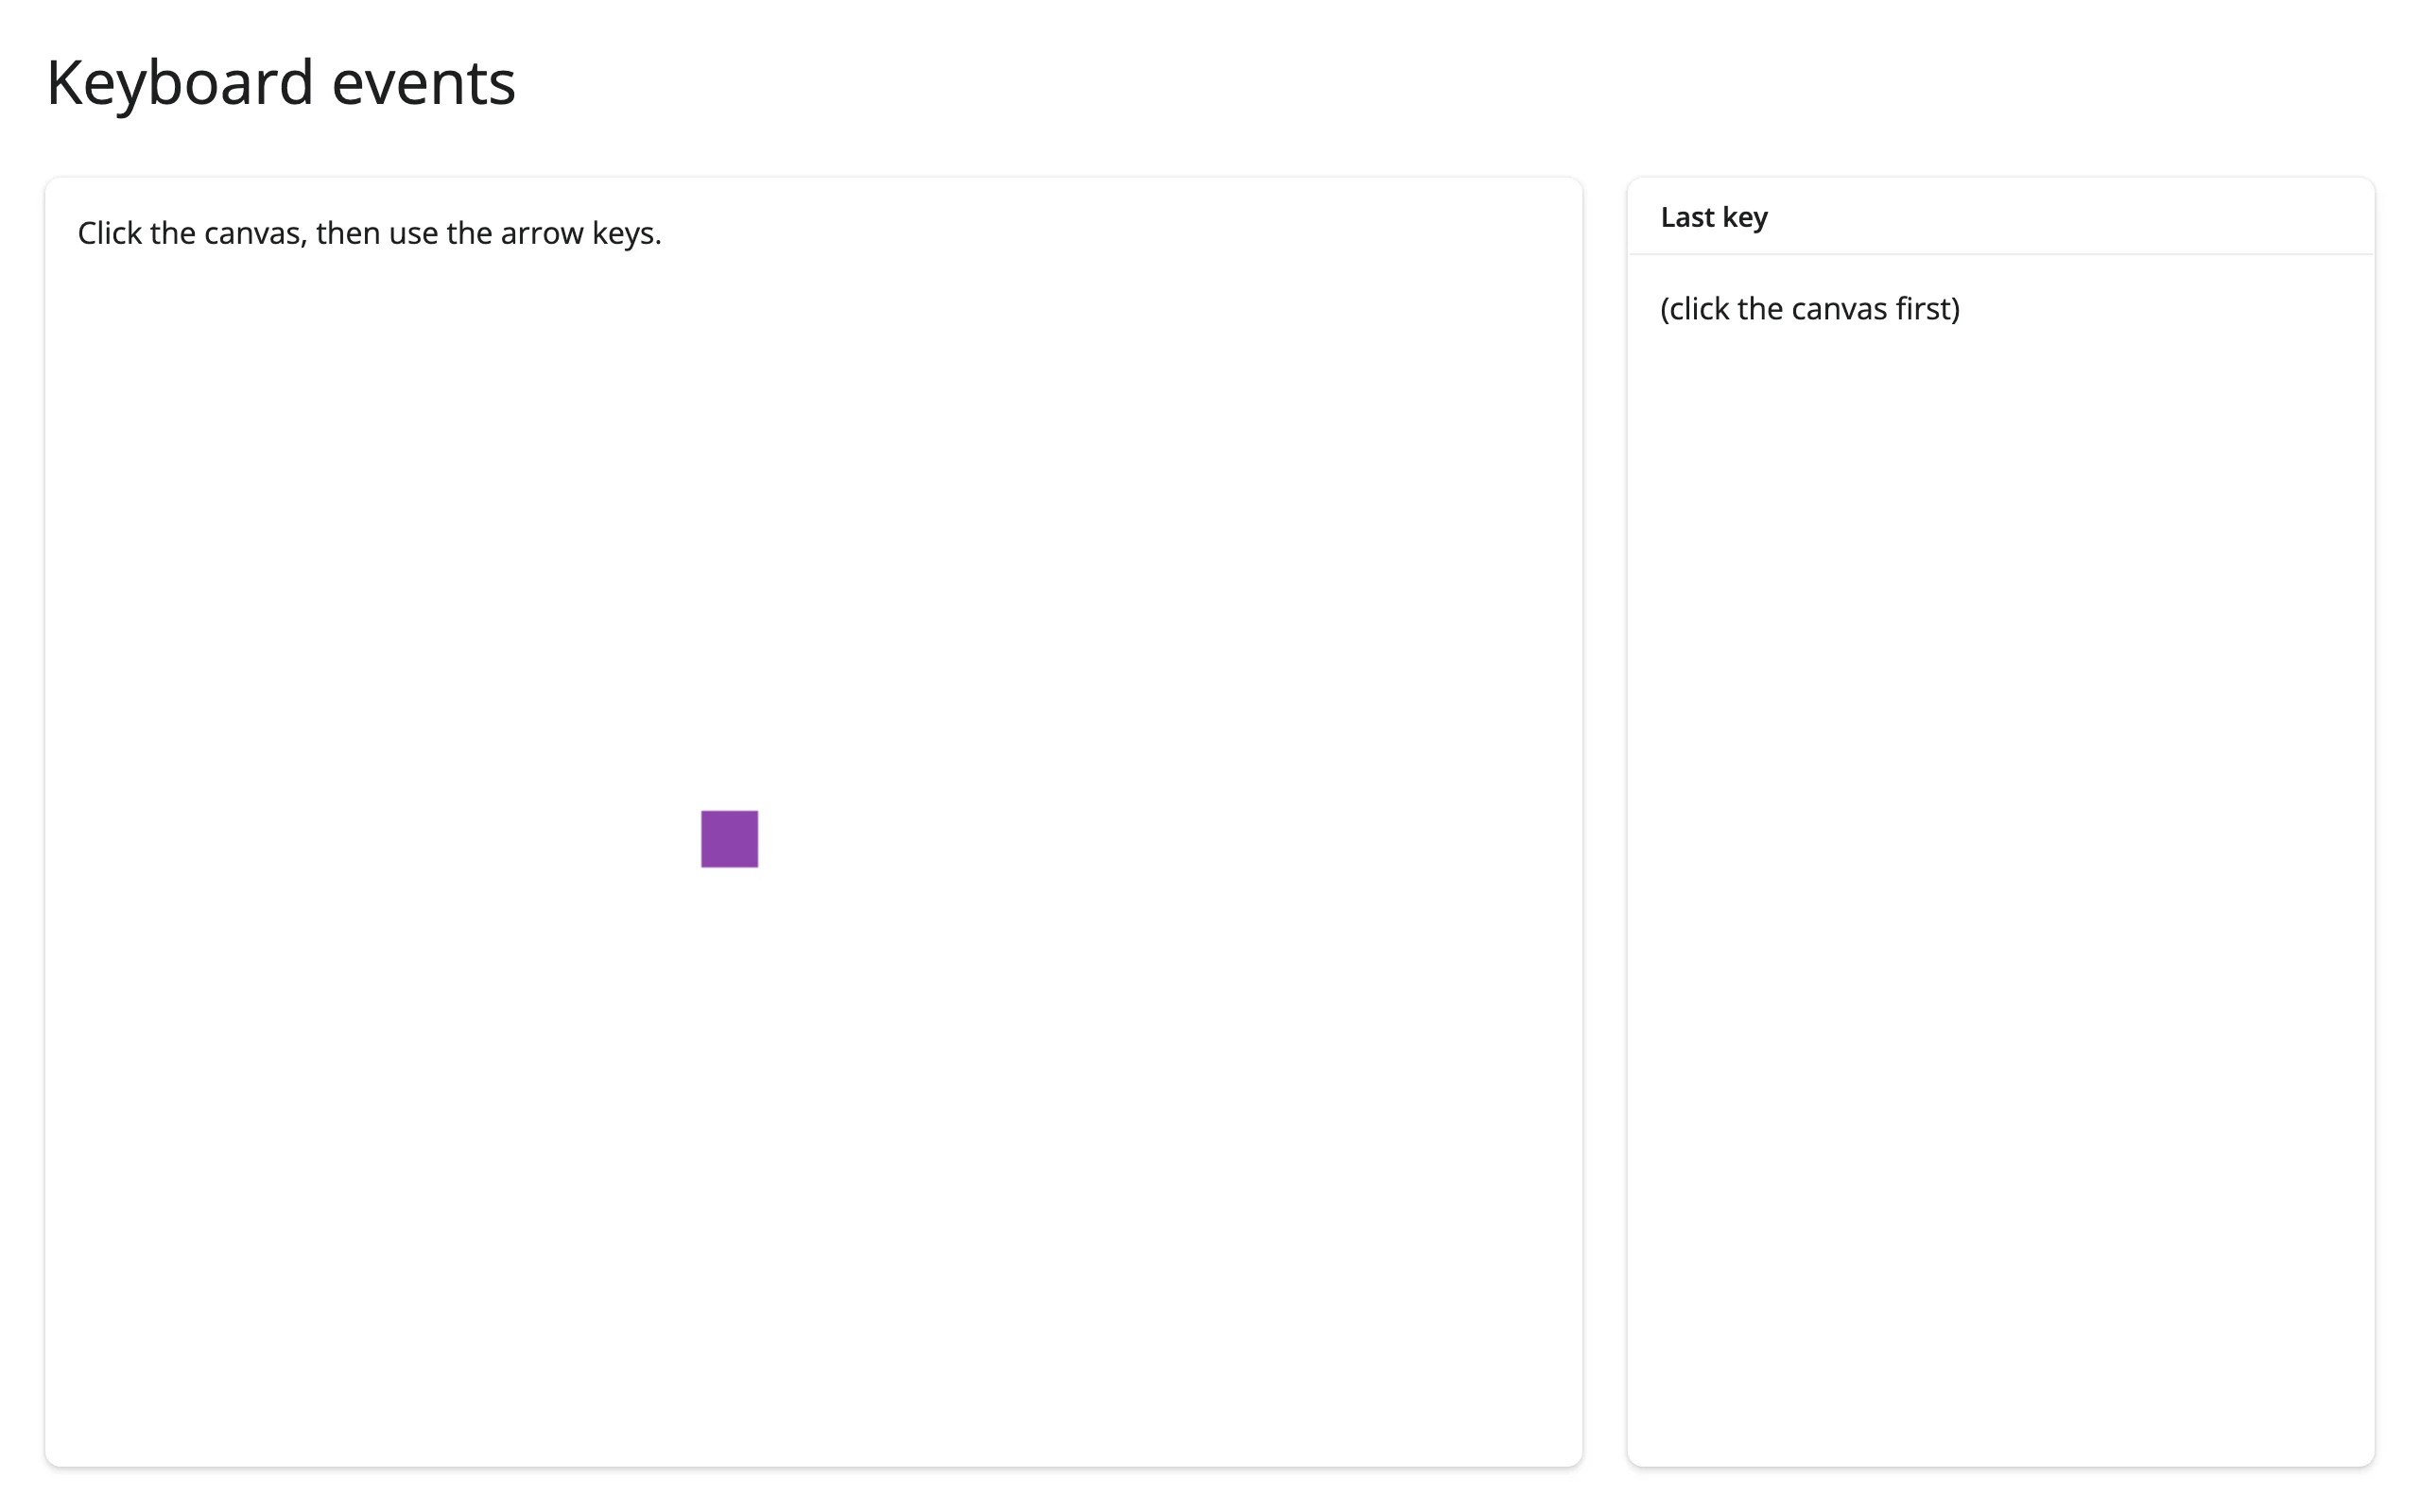
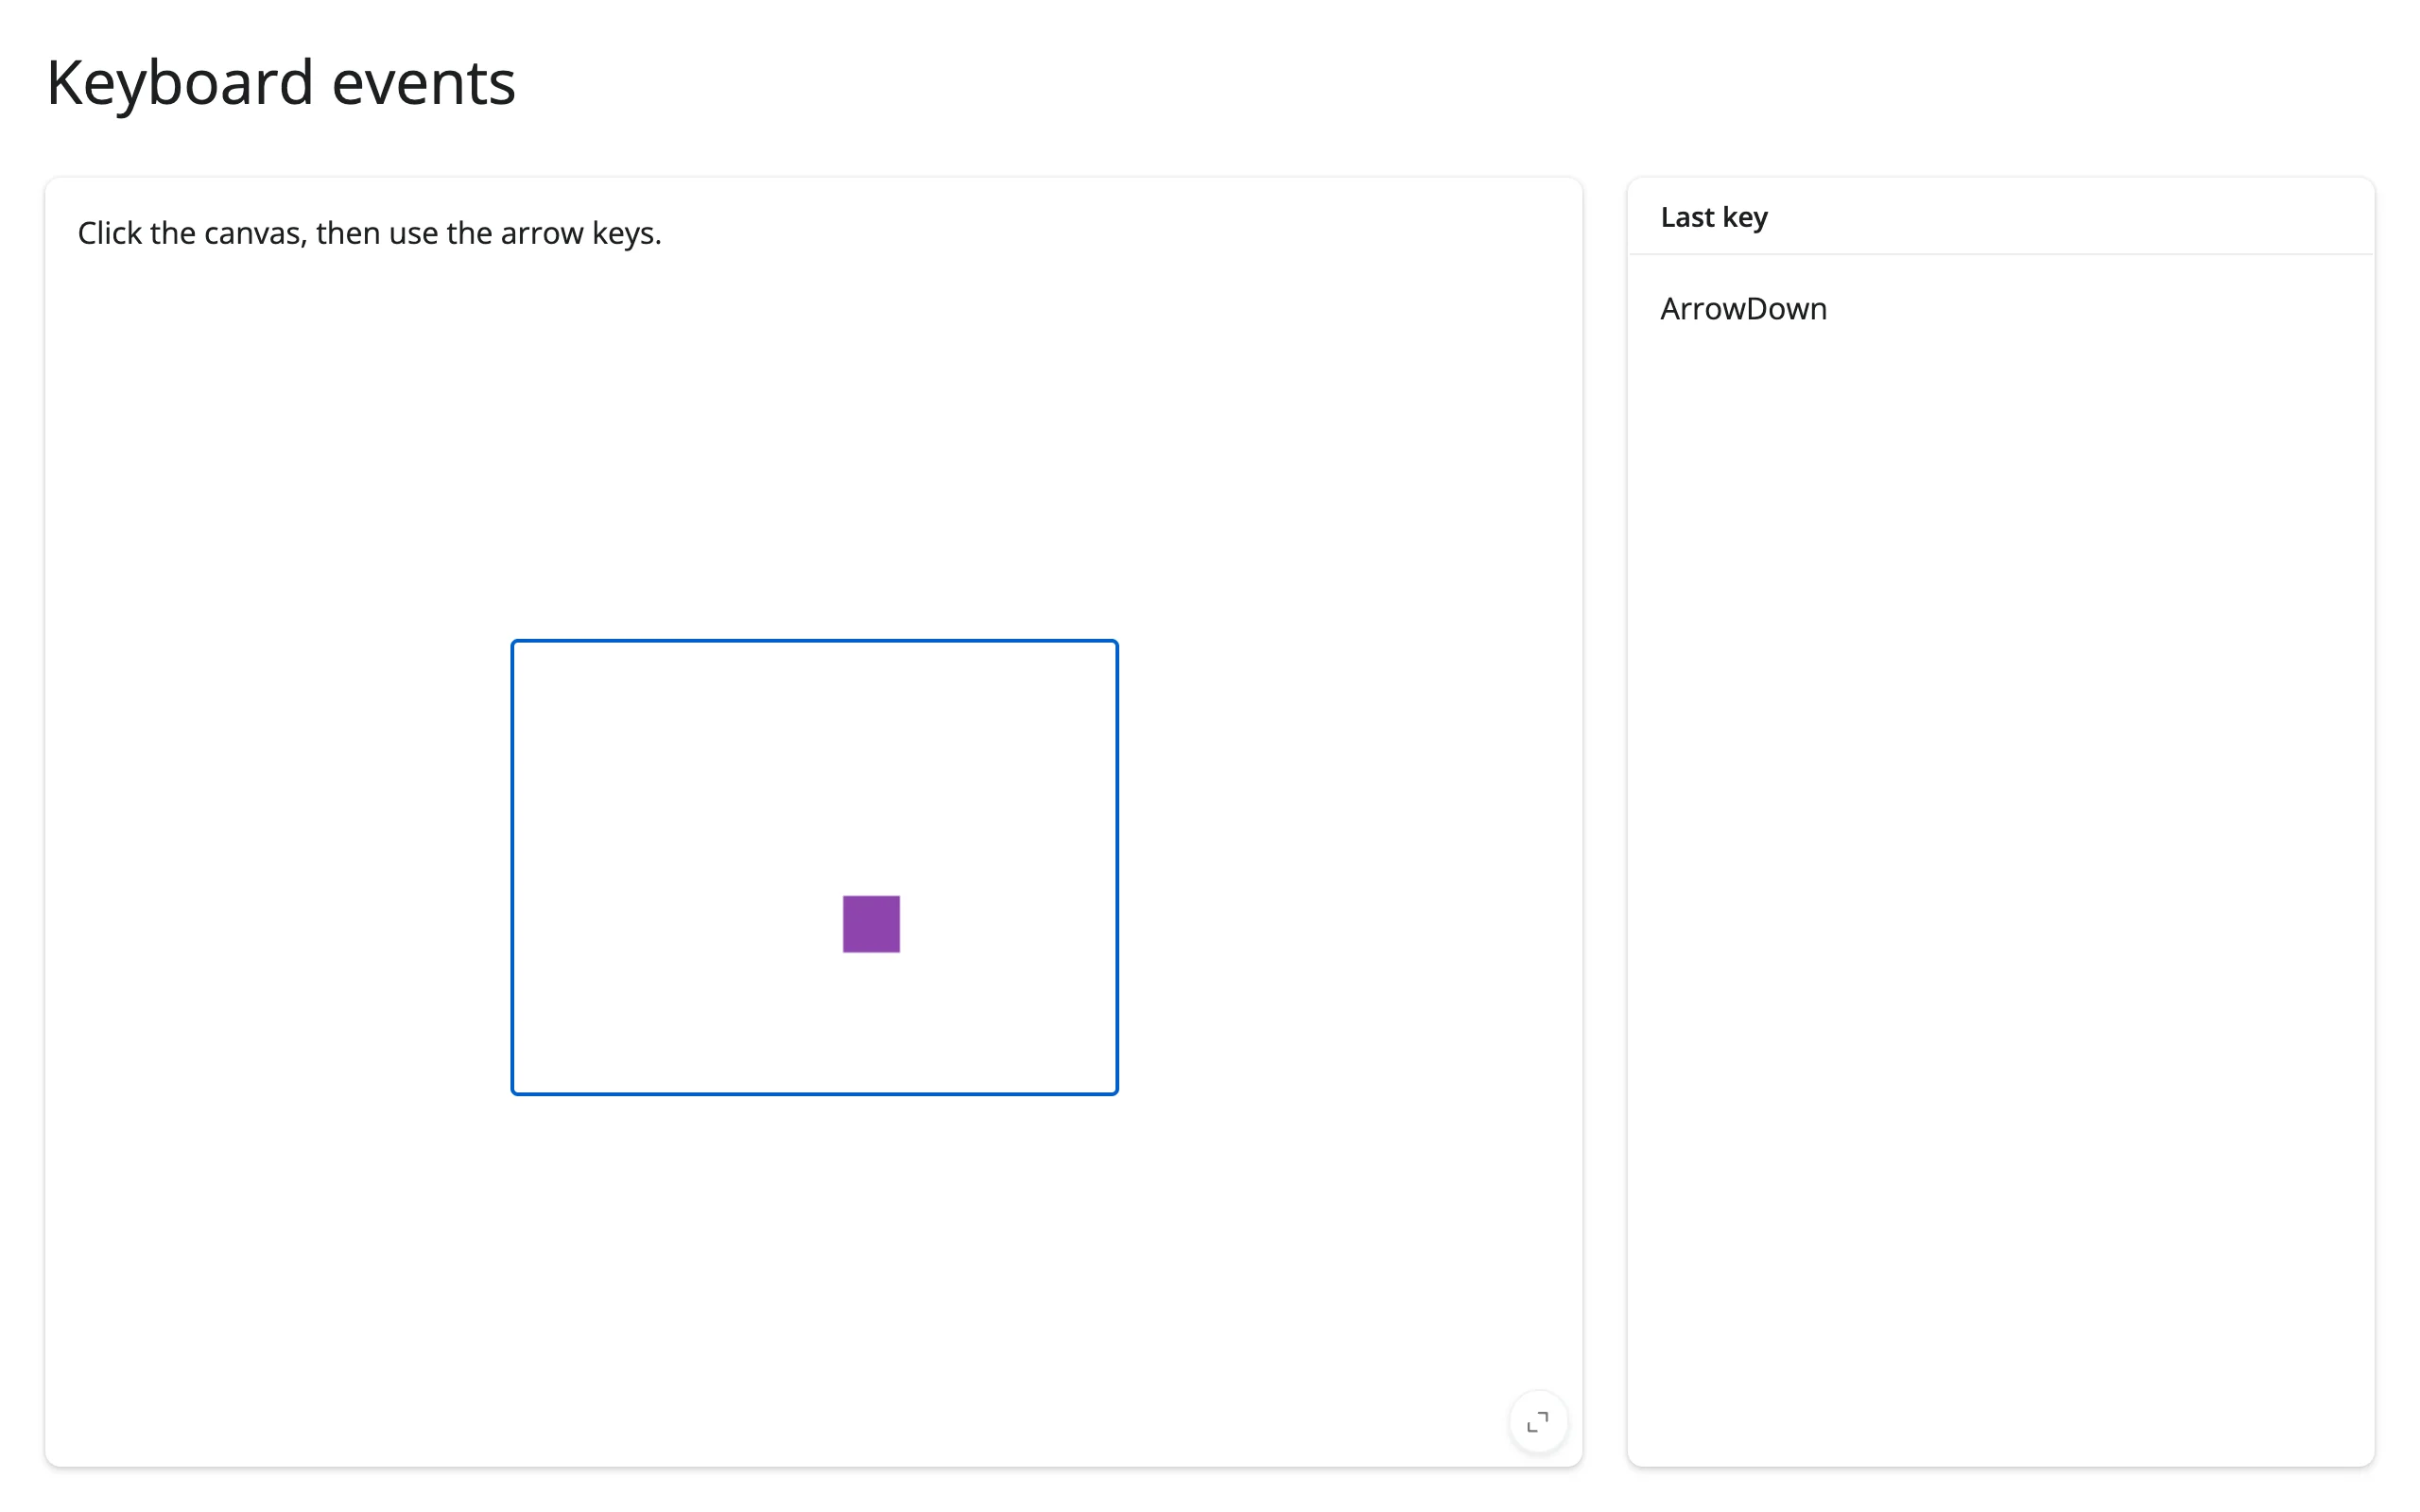
A canvas is focusable (tabindex=0): click it once, then on_key_down(key, shift_key, ctrl_key, meta_key) fires like any other keydown handler:
def on_key(key, shift_key, ctrl_key, meta_key):
    last_key.set(key)
    dx, dy = MOVES.get(key, (0, 0))
    pos["x"] = min(max(pos["x"] + dx, 0), 290)
    pos["y"] = min(max(pos["y"] + dy, 0), 210)
    redraw()

c.on_key_down(on_key)| Before | After clicking the canvas and pressing arrow keys |
|---|---|
 |
 |
Beyond callbacks: reading pixels back with .read()
For one specific trait, reading it reactively works too: set sync_image_data=True on the constructor, and the browser pushes the composited bitmap back to Python as PNG bytes on the image_data trait. canvas.read("image_data") is the shortcut for this (the same thing as reactive_read(canvas.widget, "image_data"), since render_ipycanvas has no accessor for it – see the Reacting to widgets article for when each form applies). Verified in a real browser: drawing a stroke changed a 1645-byte initial PNG to 3489 bytes, with canvas.read("image_data") picking up the change. This is the bridge for anything that needs to see what was drawn, not just where – classifying a sketch, cropping a signature, saving a snapshot:
c = Canvas(width=SIZE, height=SIZE, sync_image_data=True)
...
png_bytes = canvas.read("image_data")
if png_bytes is not None:
    img = Image.open(io.BytesIO(png_bytes))
No other ipycanvas trait is worth reading reactively: width/height are set by you, not the browser, and everything else is write-only draw state.
Rate limiting
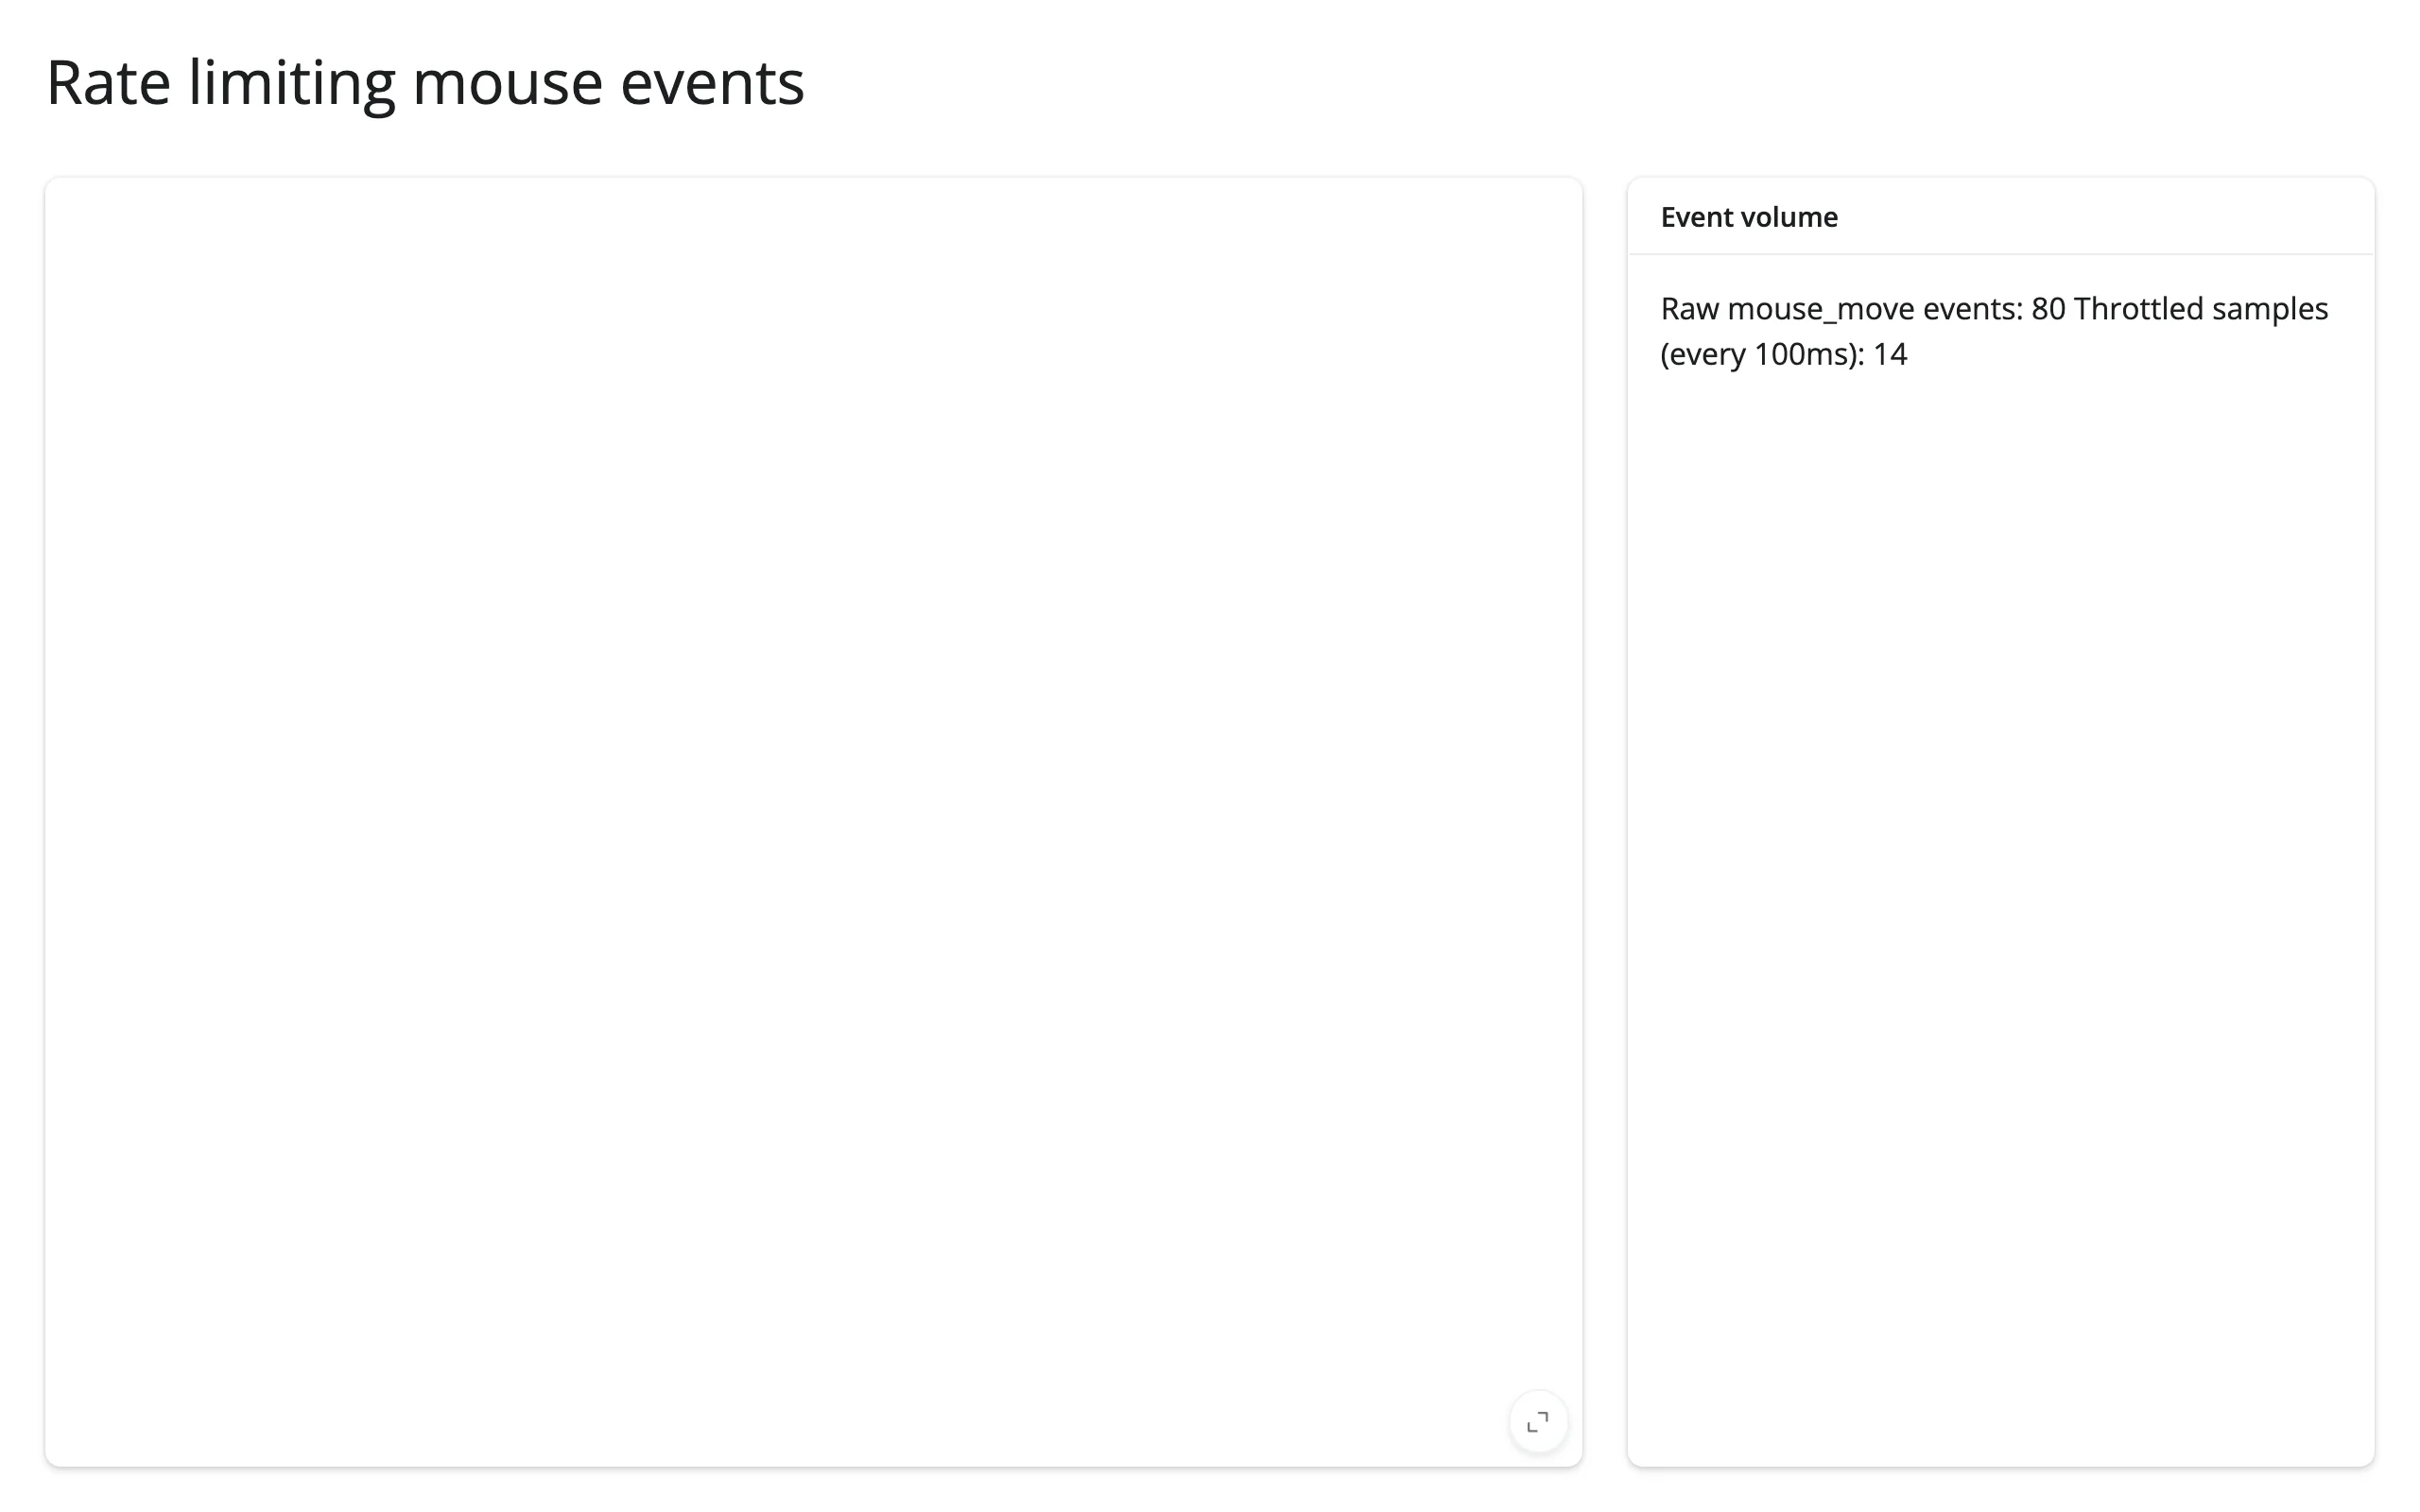
There’s no built-in rate policy for raw callbacks (that’s an accessor-only feature). on_mouse_move fires on every browser mousemove – 80 synthetic moves over ~2.3s produced 80 raw events in testing. Throttle yourself with a timestamp gate, keeping a cheap counter ungated if you want every event to register and a throttled one to drive expensive downstream work:
def on_move(x, y):
    event_count.set(event_count() + 1)  # cheap, update every time
    now = time.monotonic()
    if now - _last_sample["t"] < THROTTLE_S:
        return  # too soon since the last sample -- drop it
    _last_sample["t"] = now
    sampled_count.set(sampled_count() + 1)  # drives expensive work
examples/10_rate_limiting.py – verified 80 raw events collapsing to 14 samples at a 100ms gate.
Updating the widget from Python
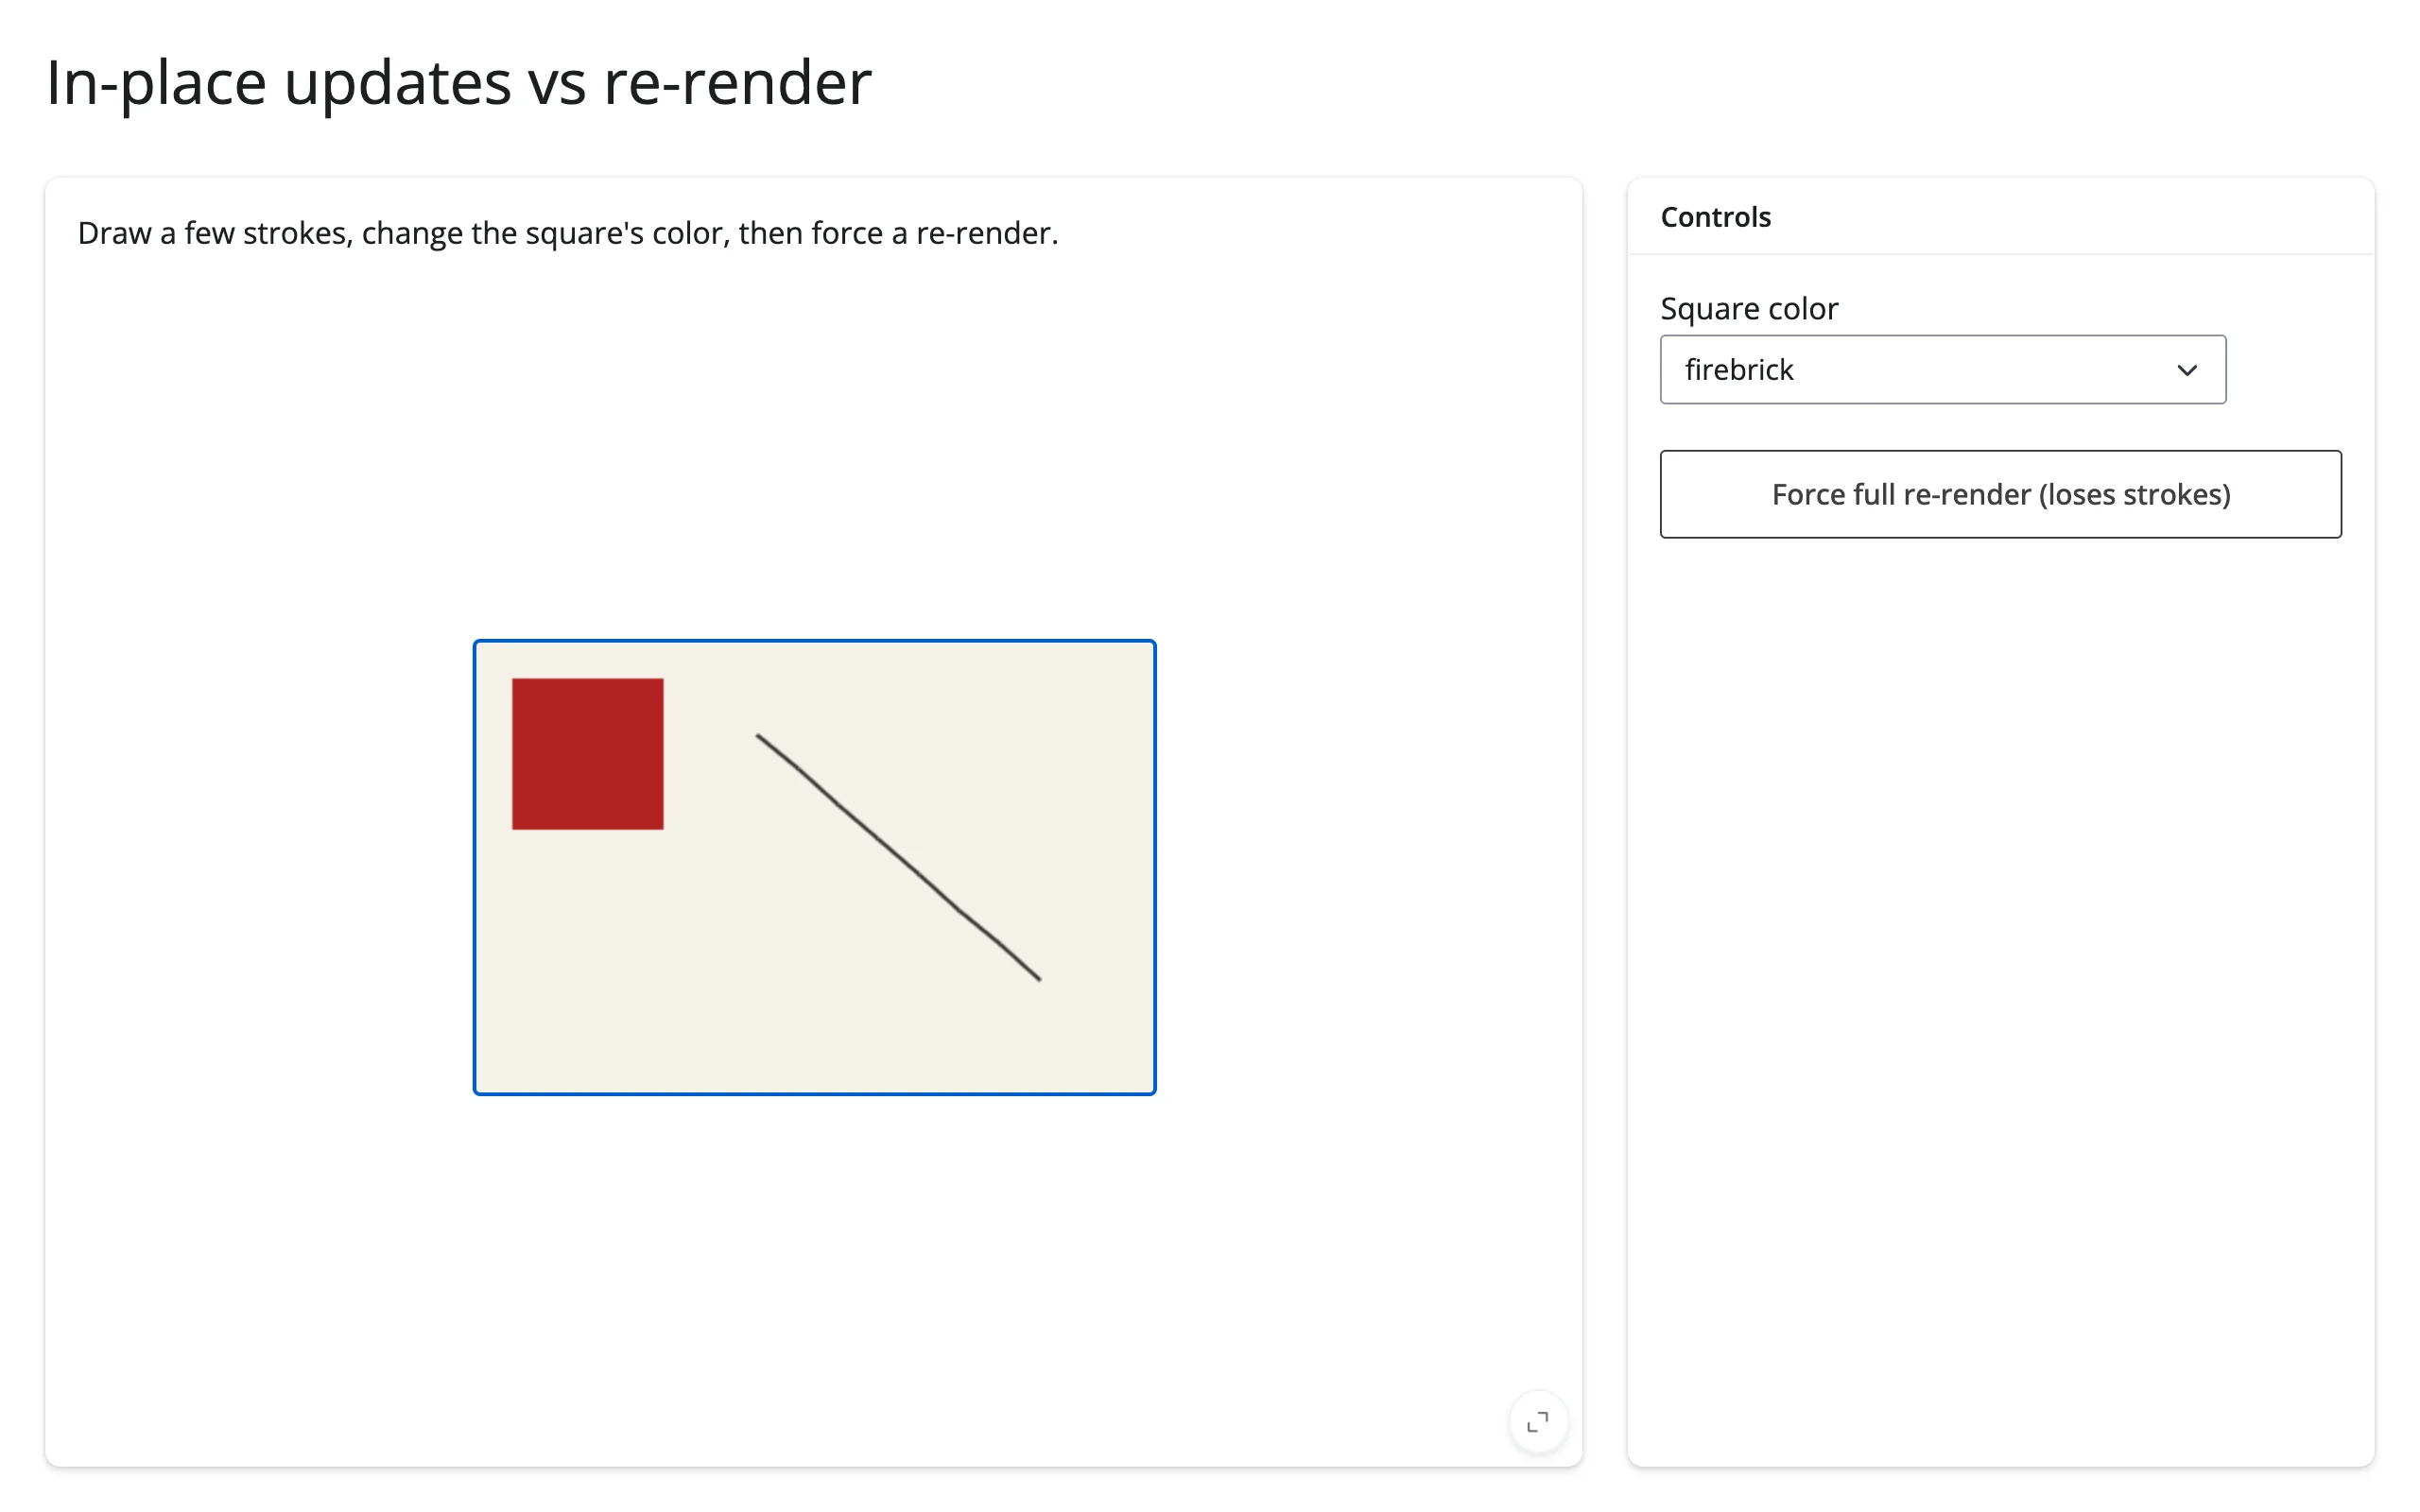
Draw on .widget from a @reactive.effect to update the canvas in place, without re-rendering the function that created it. This matters because re-rendering tears down and rebuilds the widget from scratch – anything drawn outside the render function (mouse strokes, animation frames) is lost, since canvas content is draw commands, not widget state:
@reactive.effect
def _update_square():
    c = canvas.widget
    if c is not None:
        c.fill_style = input.color()
        c.fill_rect(20, 20, 80, 80)


@reactive.effect
@reactive.event(input.rerender)
def _force_rerender():
rerender_trigger.set(rerender_trigger() + 1)| Strokes drawn, then color changed in place | After forcing a re-render |
|---|---|
 |
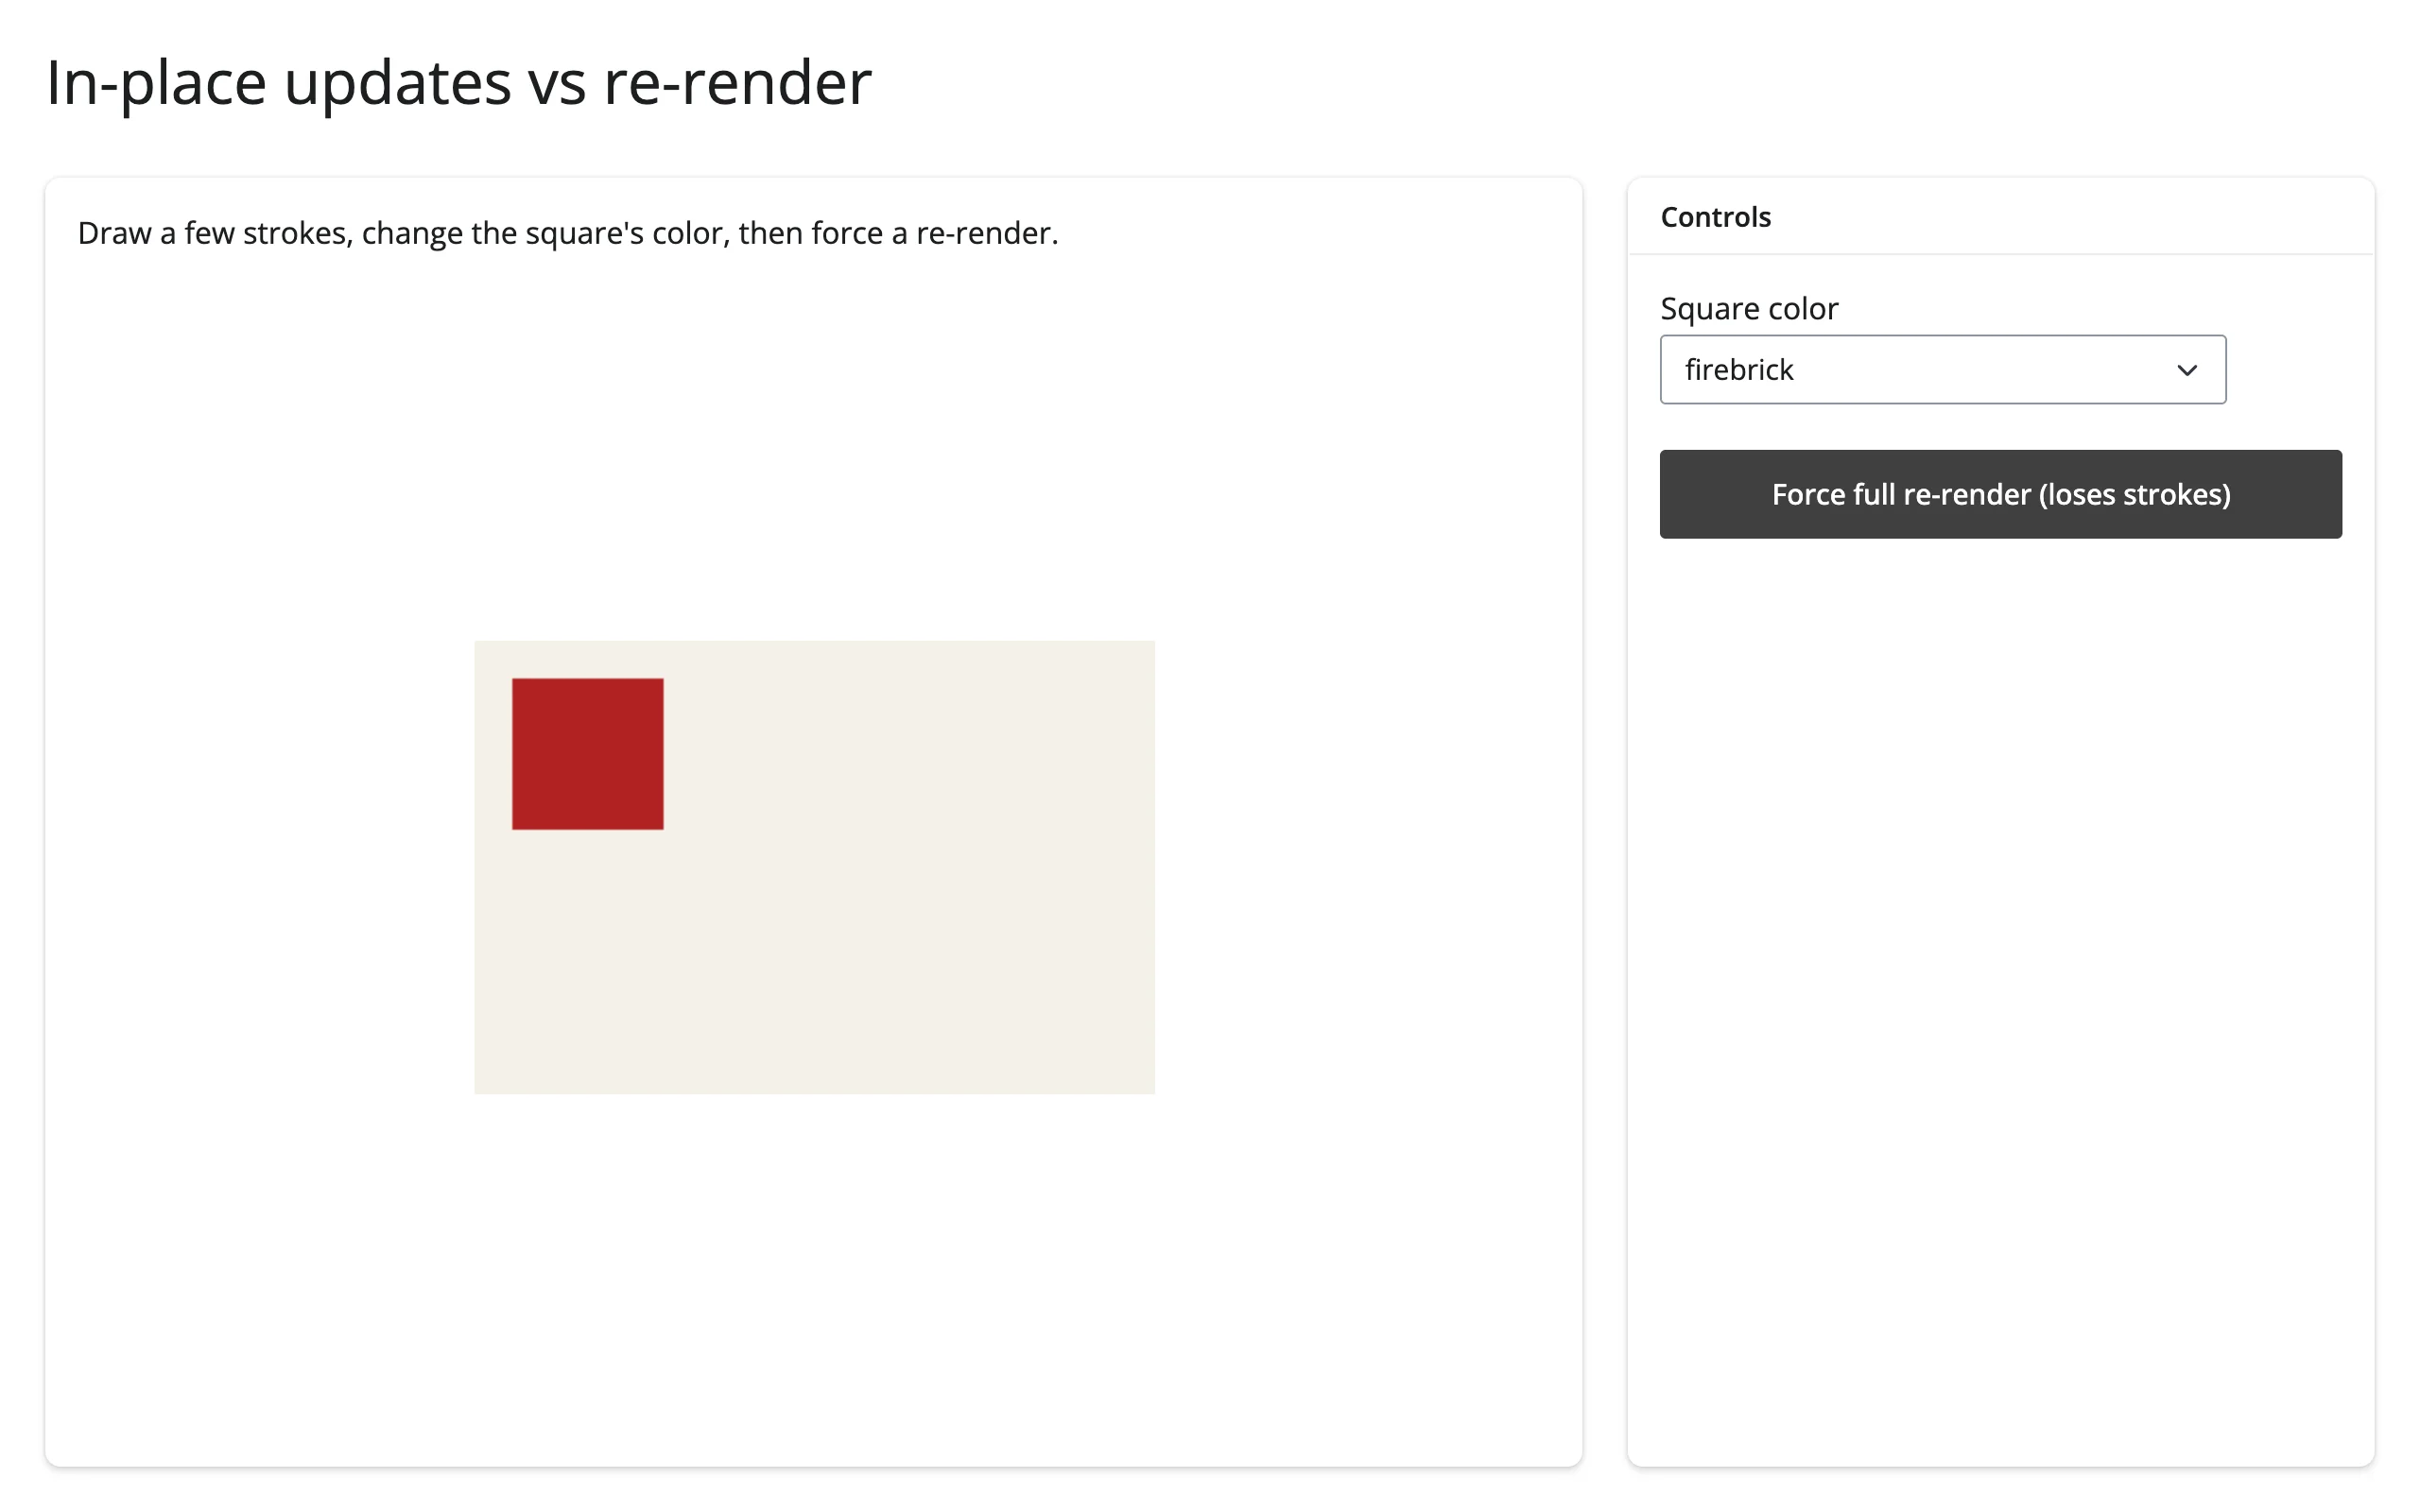 |
The hand-drawn stroke survives the color change (an in-place update) but disappears after the forced re-render, while the square’s color is correctly reapplied – reading .widget inside an effect subscribes that effect to re-renders too, so in-place-update effects automatically re-run against a freshly rendered widget. reactive.isolate() isn’t needed in either effect above since neither reads a value it also writes; reach for it if you ever .read()/reactive_read() a trait inside the same effect that sets it, to avoid a feedback loop.
A pattern to copy for animation loops: keep frequently-redrawn state (a grid, a particle list) as a plain mutable Python object rather than a reactive.value, and have every writer (a click handler, a button effect, the invalidate_later tick) redraw the widget directly afterwards. examples/05_game_of_life.py and the Game of Life gallery template both use this shape. It sidesteps a sharp edge covered in Gotchas below.
Coordinating multiple views
Click to place points, in a table
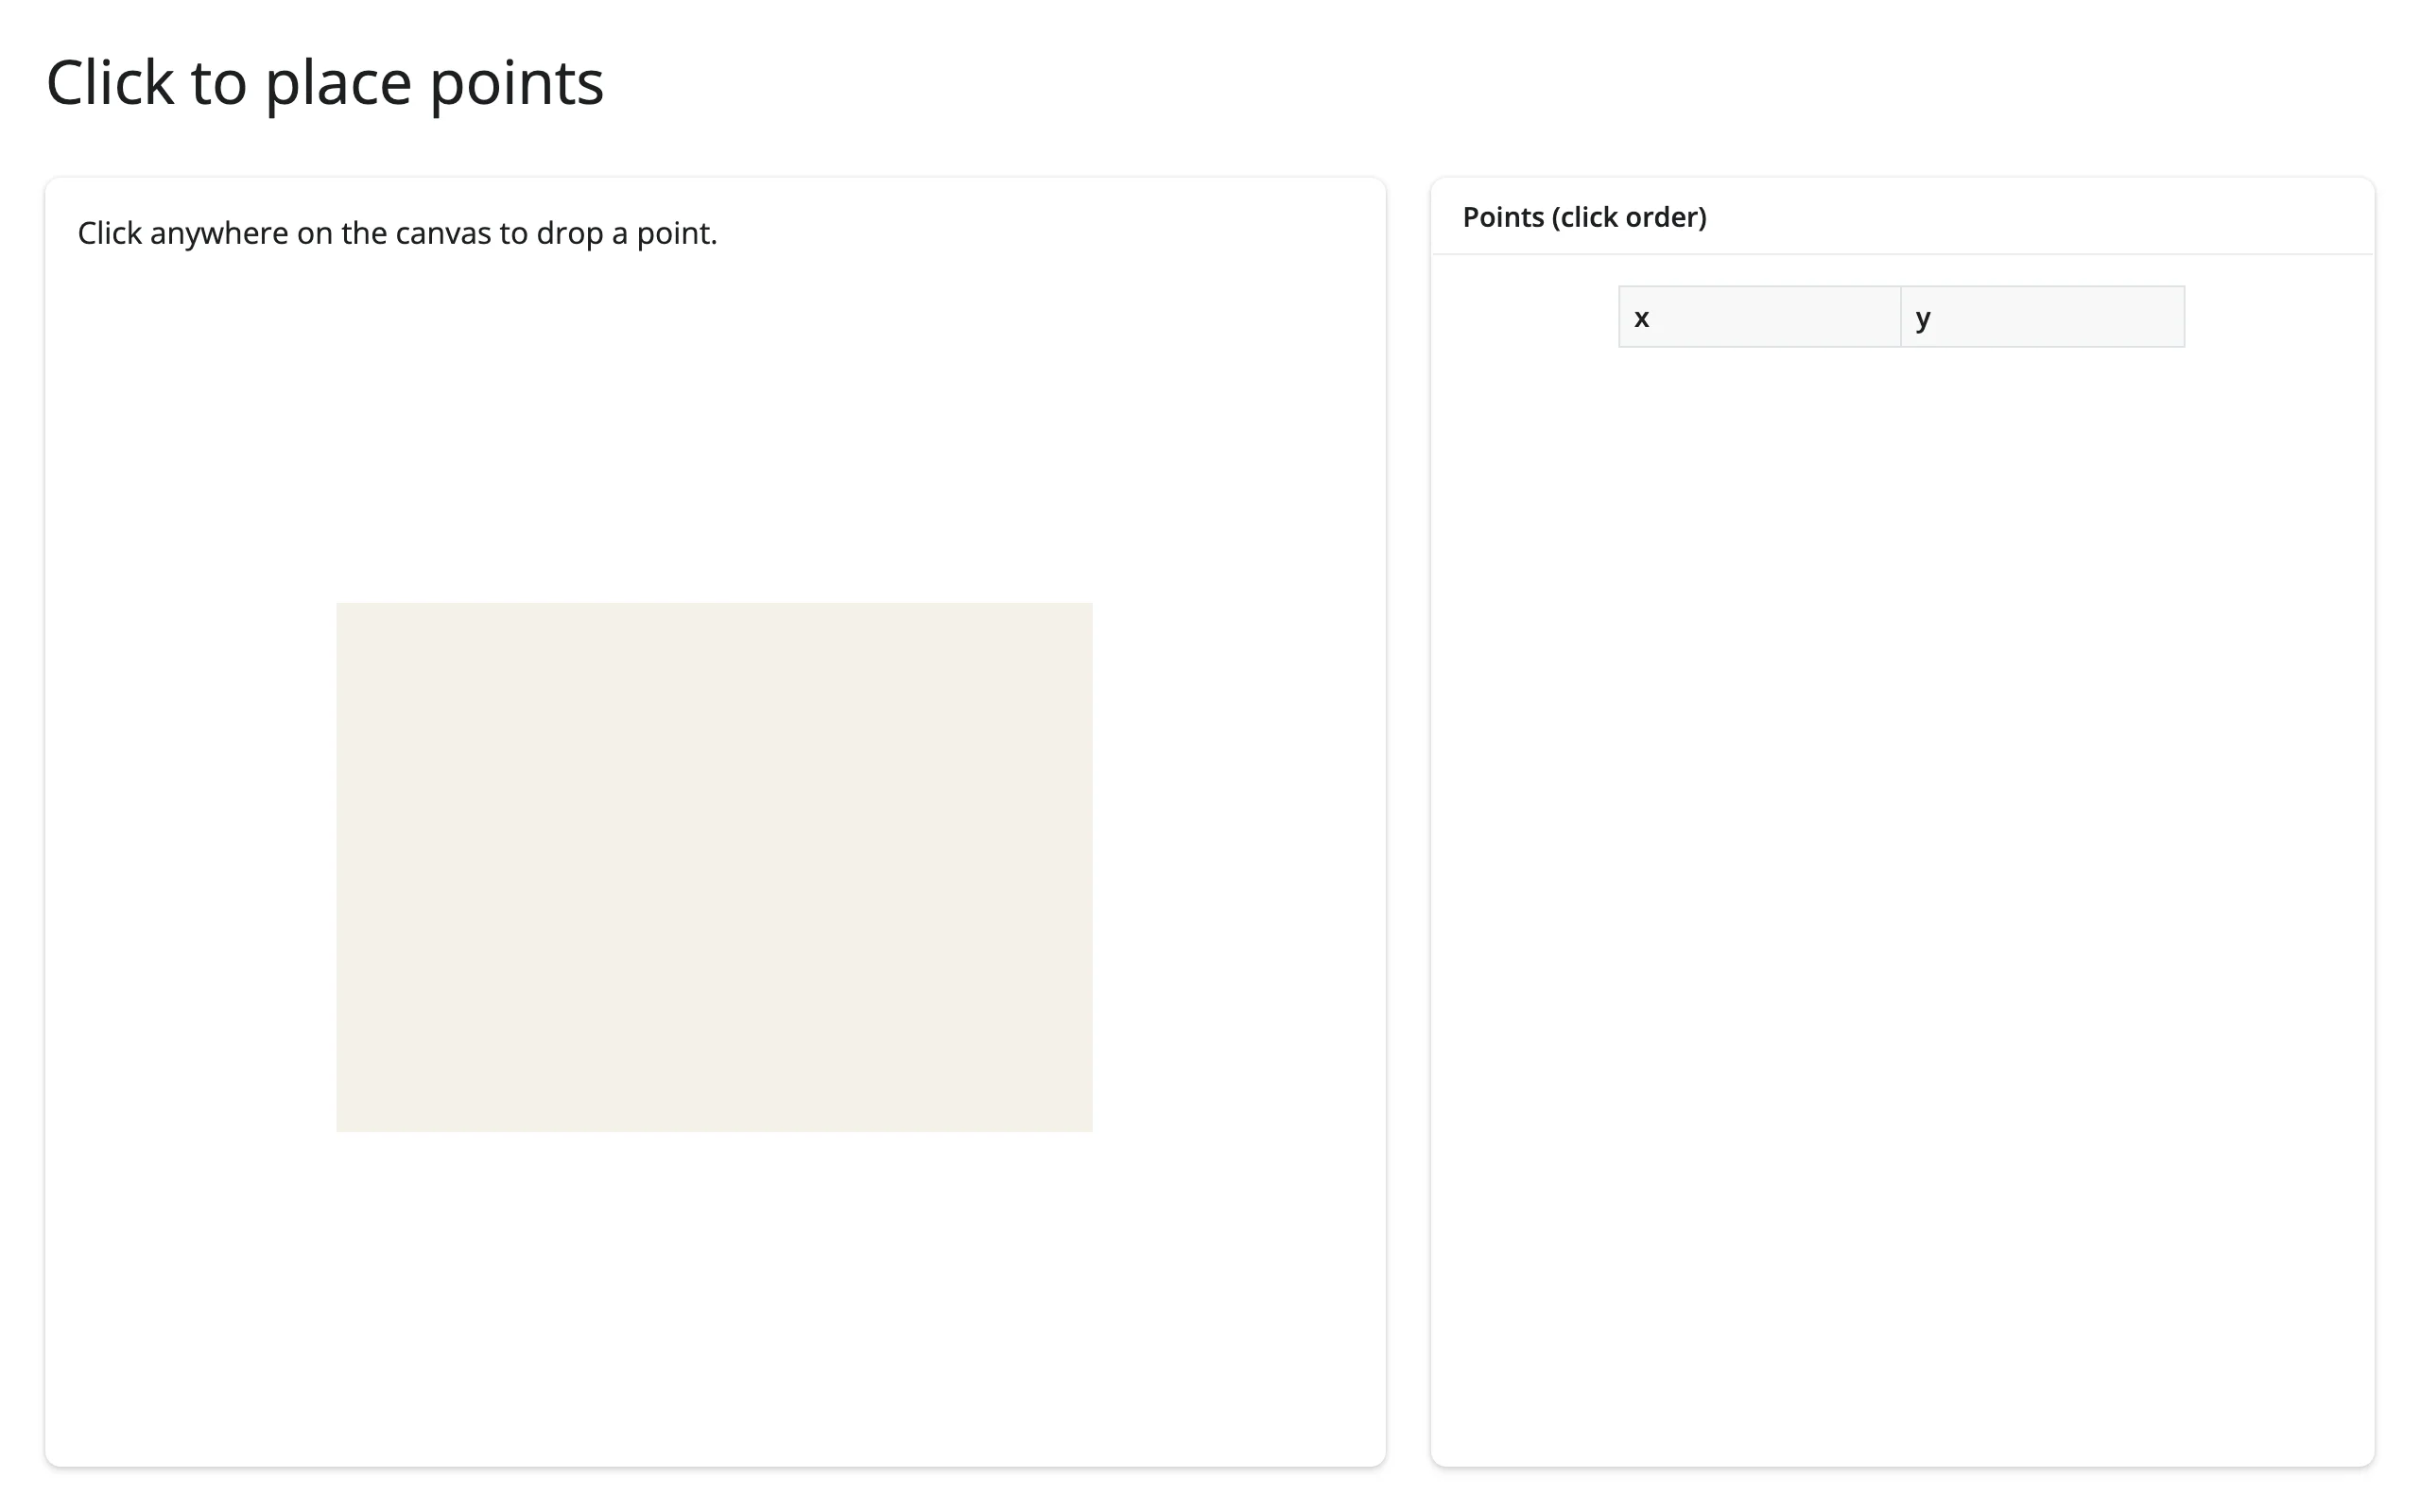
A mouse callback that appends to a reactive list, paired with an effect that redraws everything from that list, is the general pattern for any “accumulate points” interaction:
with ui.layout_columns(col_widths=(7, 5)):
    with ui.card(full_screen=True):
        ui.p("Click anywhere on the canvas to drop a point.")

        @render_ipycanvas
        def canvas():
            c = Canvas(width=400, height=280)
            c.fill_style = "#f4f1ea"
            c.fill_rect(0, 0, 400, 280)

            def on_click(x, y):
                points.set(points() + [(x, y)])

            c.on_mouse_down(on_click)
            return c

    with ui.card():
        ui.card_header("Points (click order)")

        @render.data_frame
        def table():
            return pd.DataFrame(points(), columns=["x", "y"])


# Canvas content is stateless (draw commands, not widget state), so the
# simplest way to keep it in sync with `points` is to redraw everything each
# time it changes: clear, then replay.
@reactive.effect
def _draw_points():
    c = canvas.widget
    if c is None:
        return
    c.clear()
    c.fill_style = "#f4f1ea"
    c.fill_rect(0, 0, 400, 280)
    c.fill_style = "#c0392b"
    for x, y in points():
c.fill_circle(x, y, 6)| Before | After 4 clicks |
|---|---|
 |
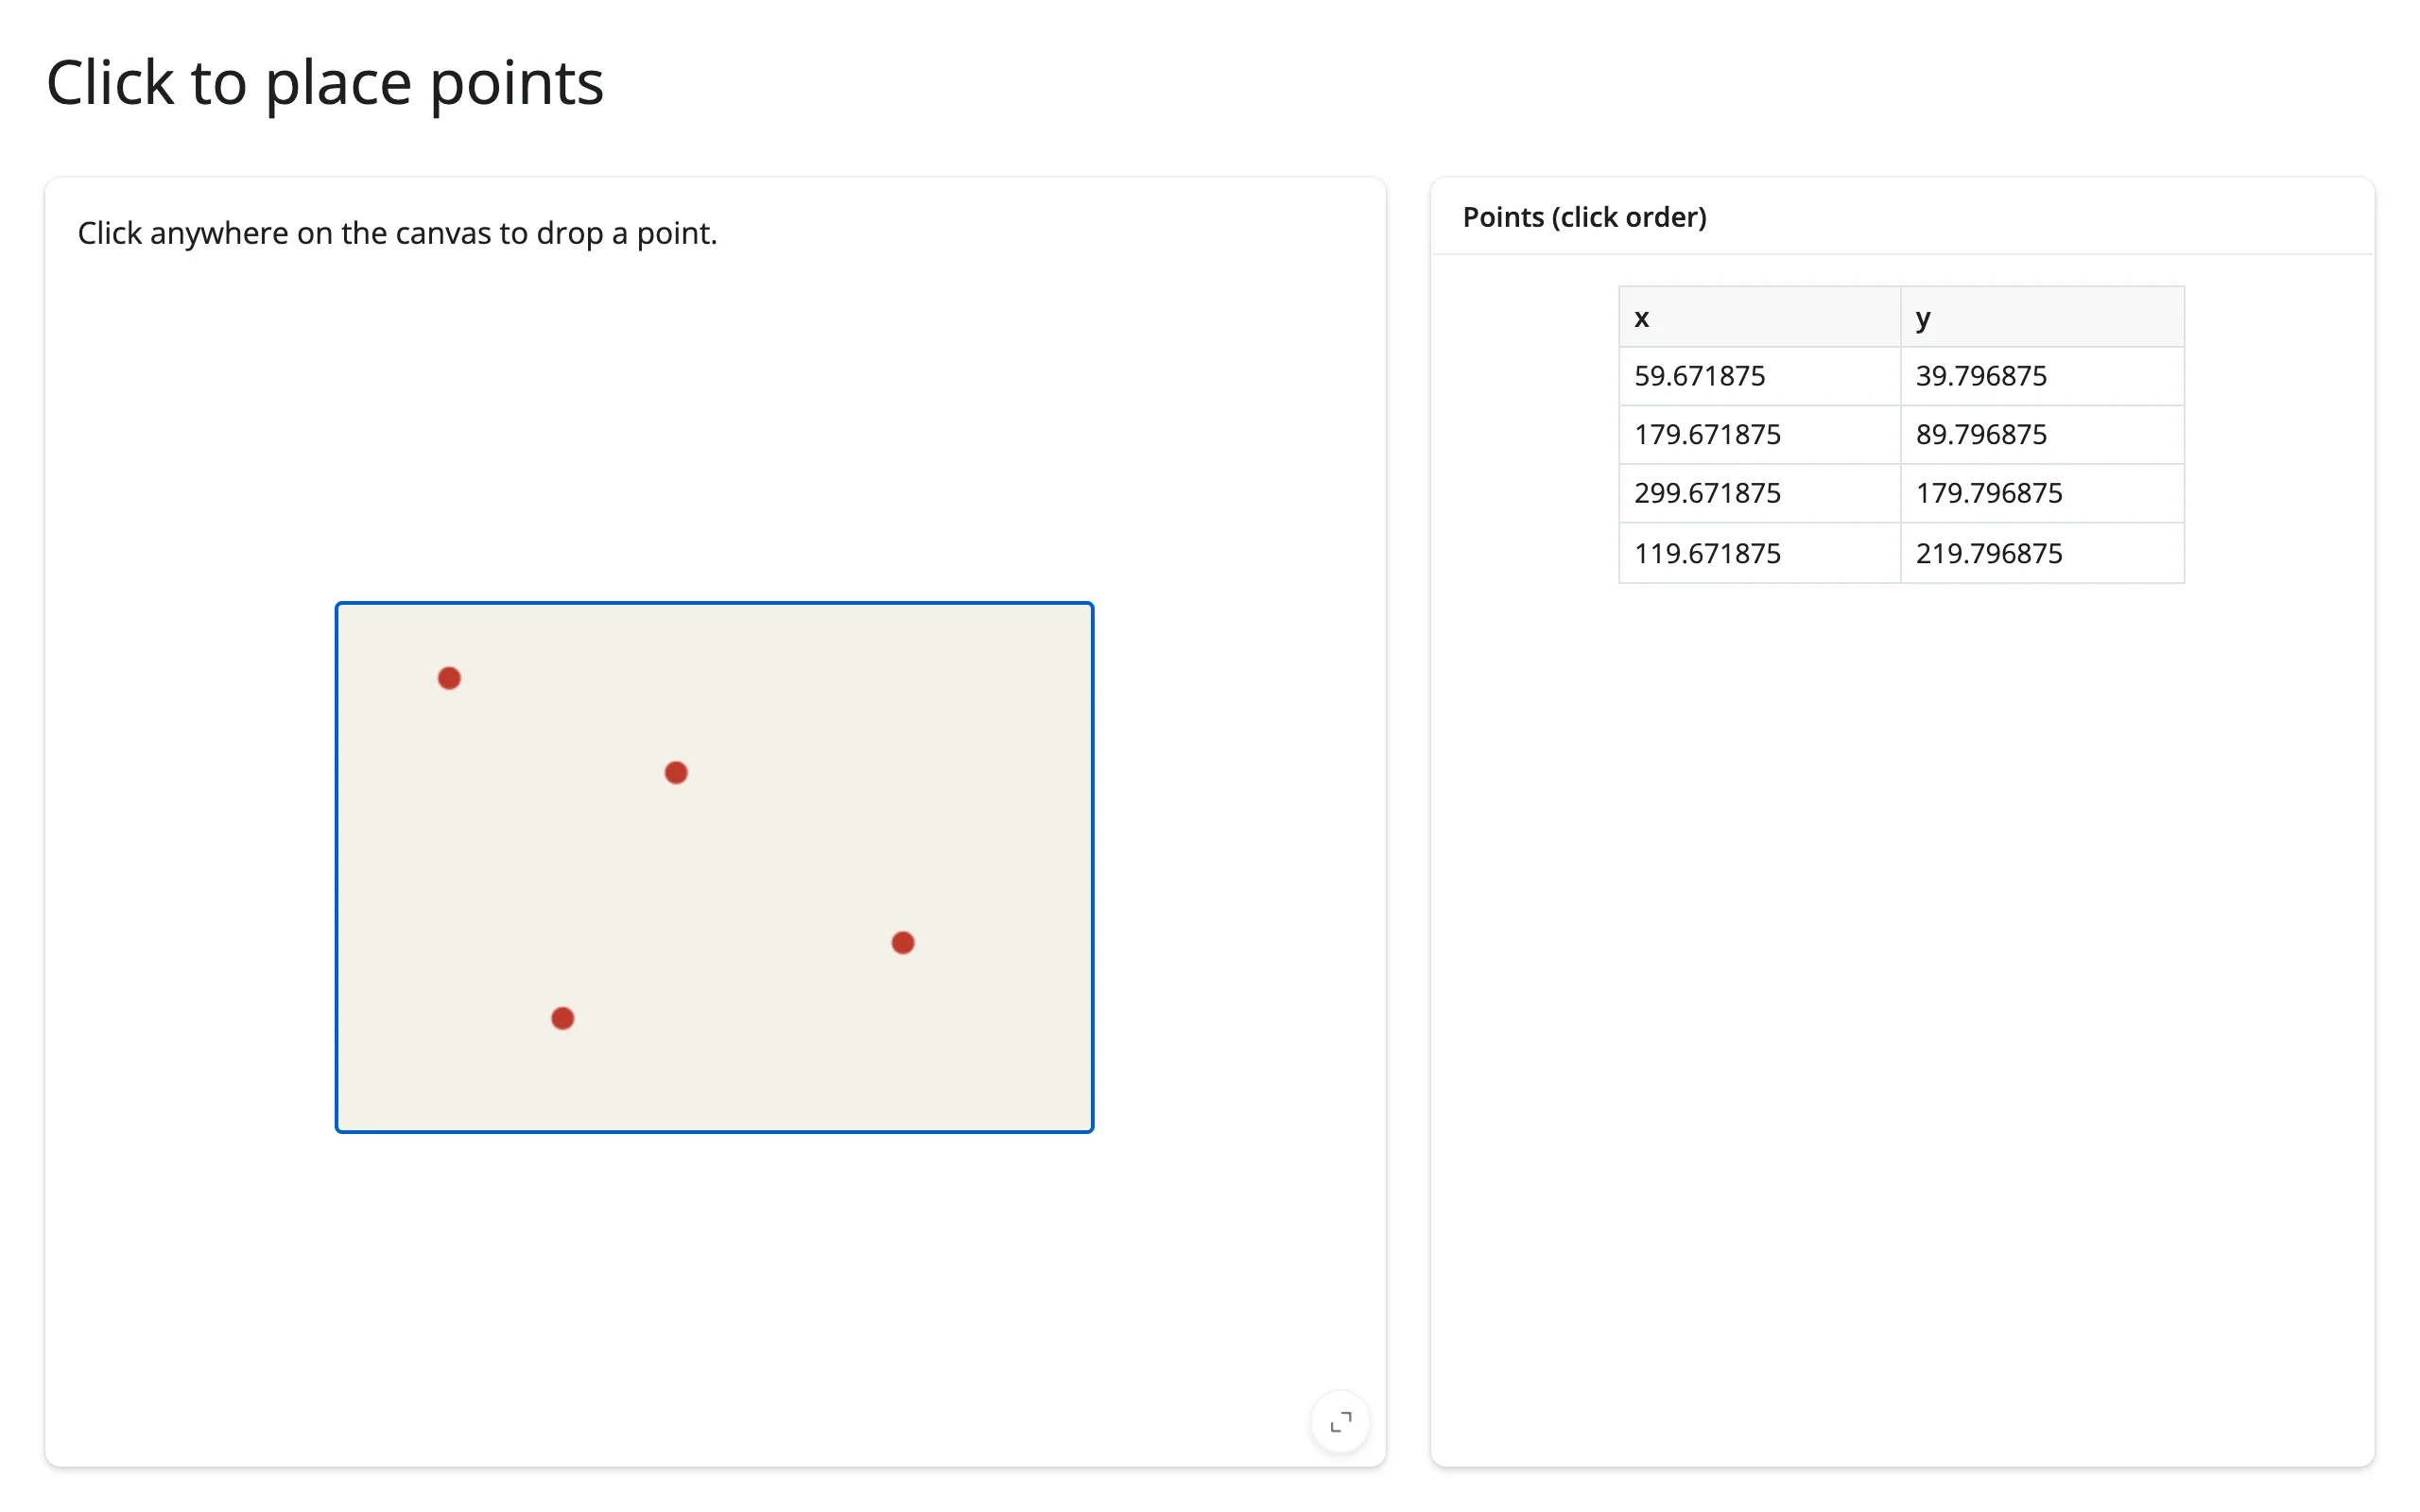 |
Table row selection highlights the canvas
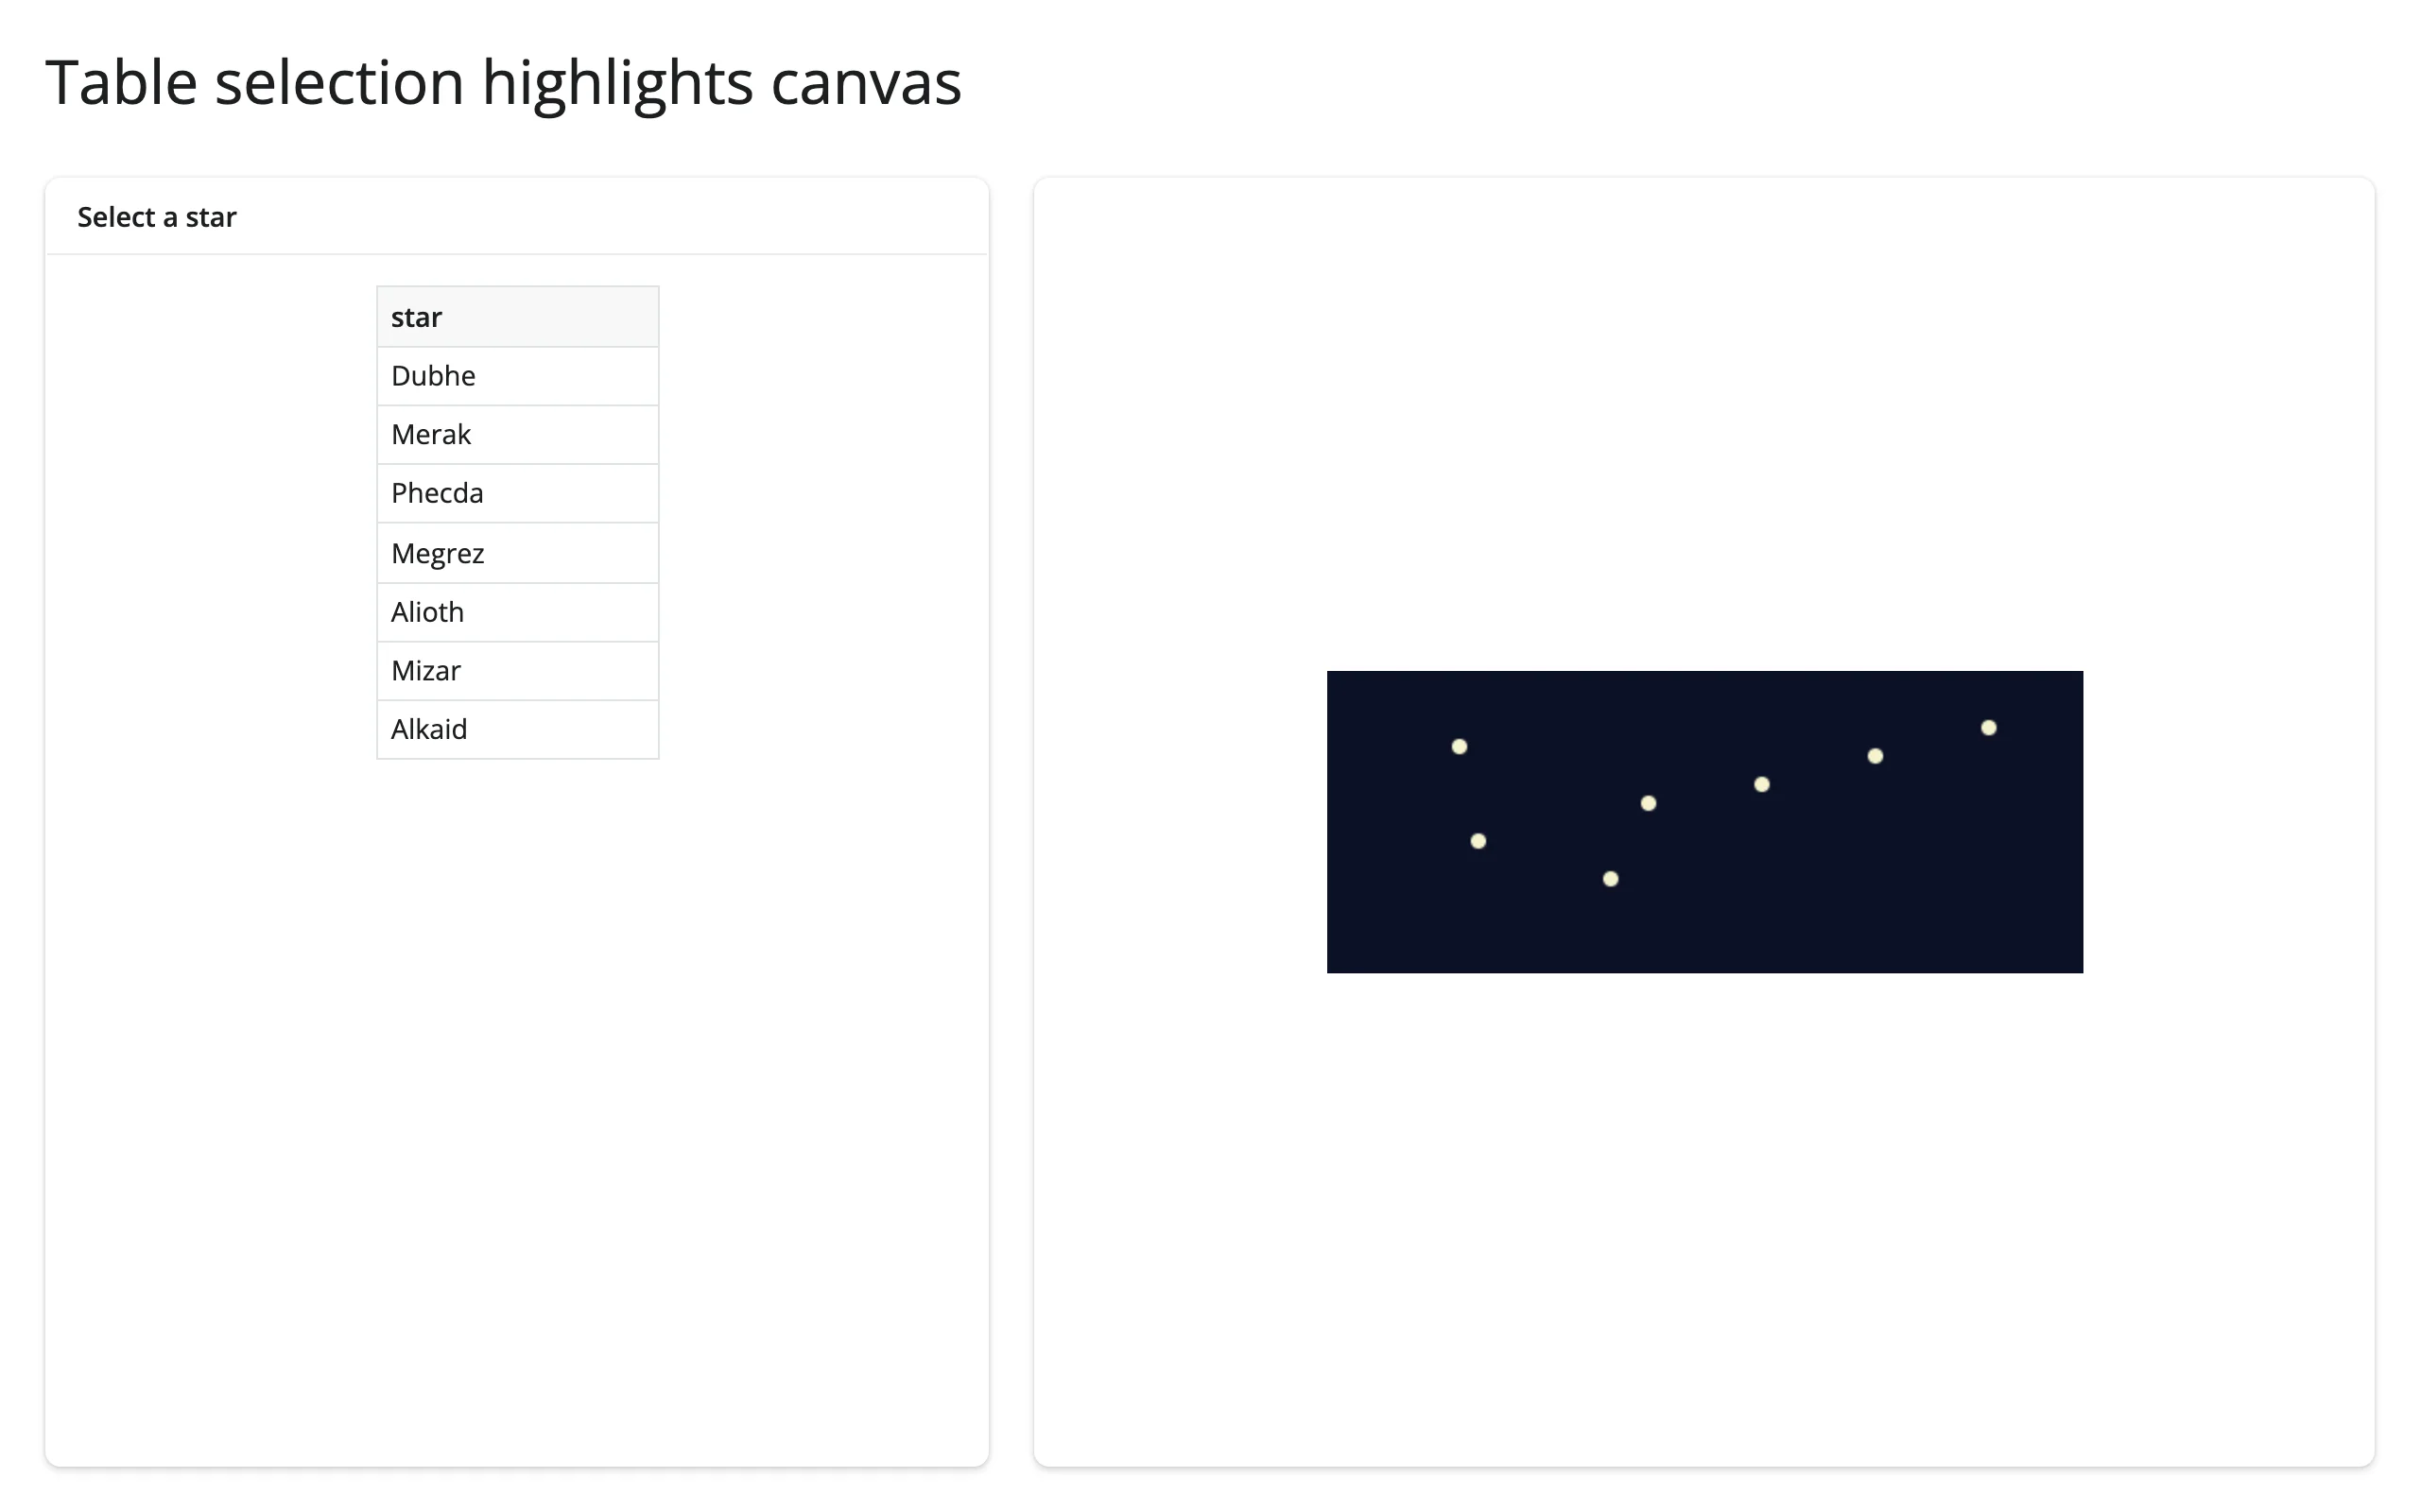
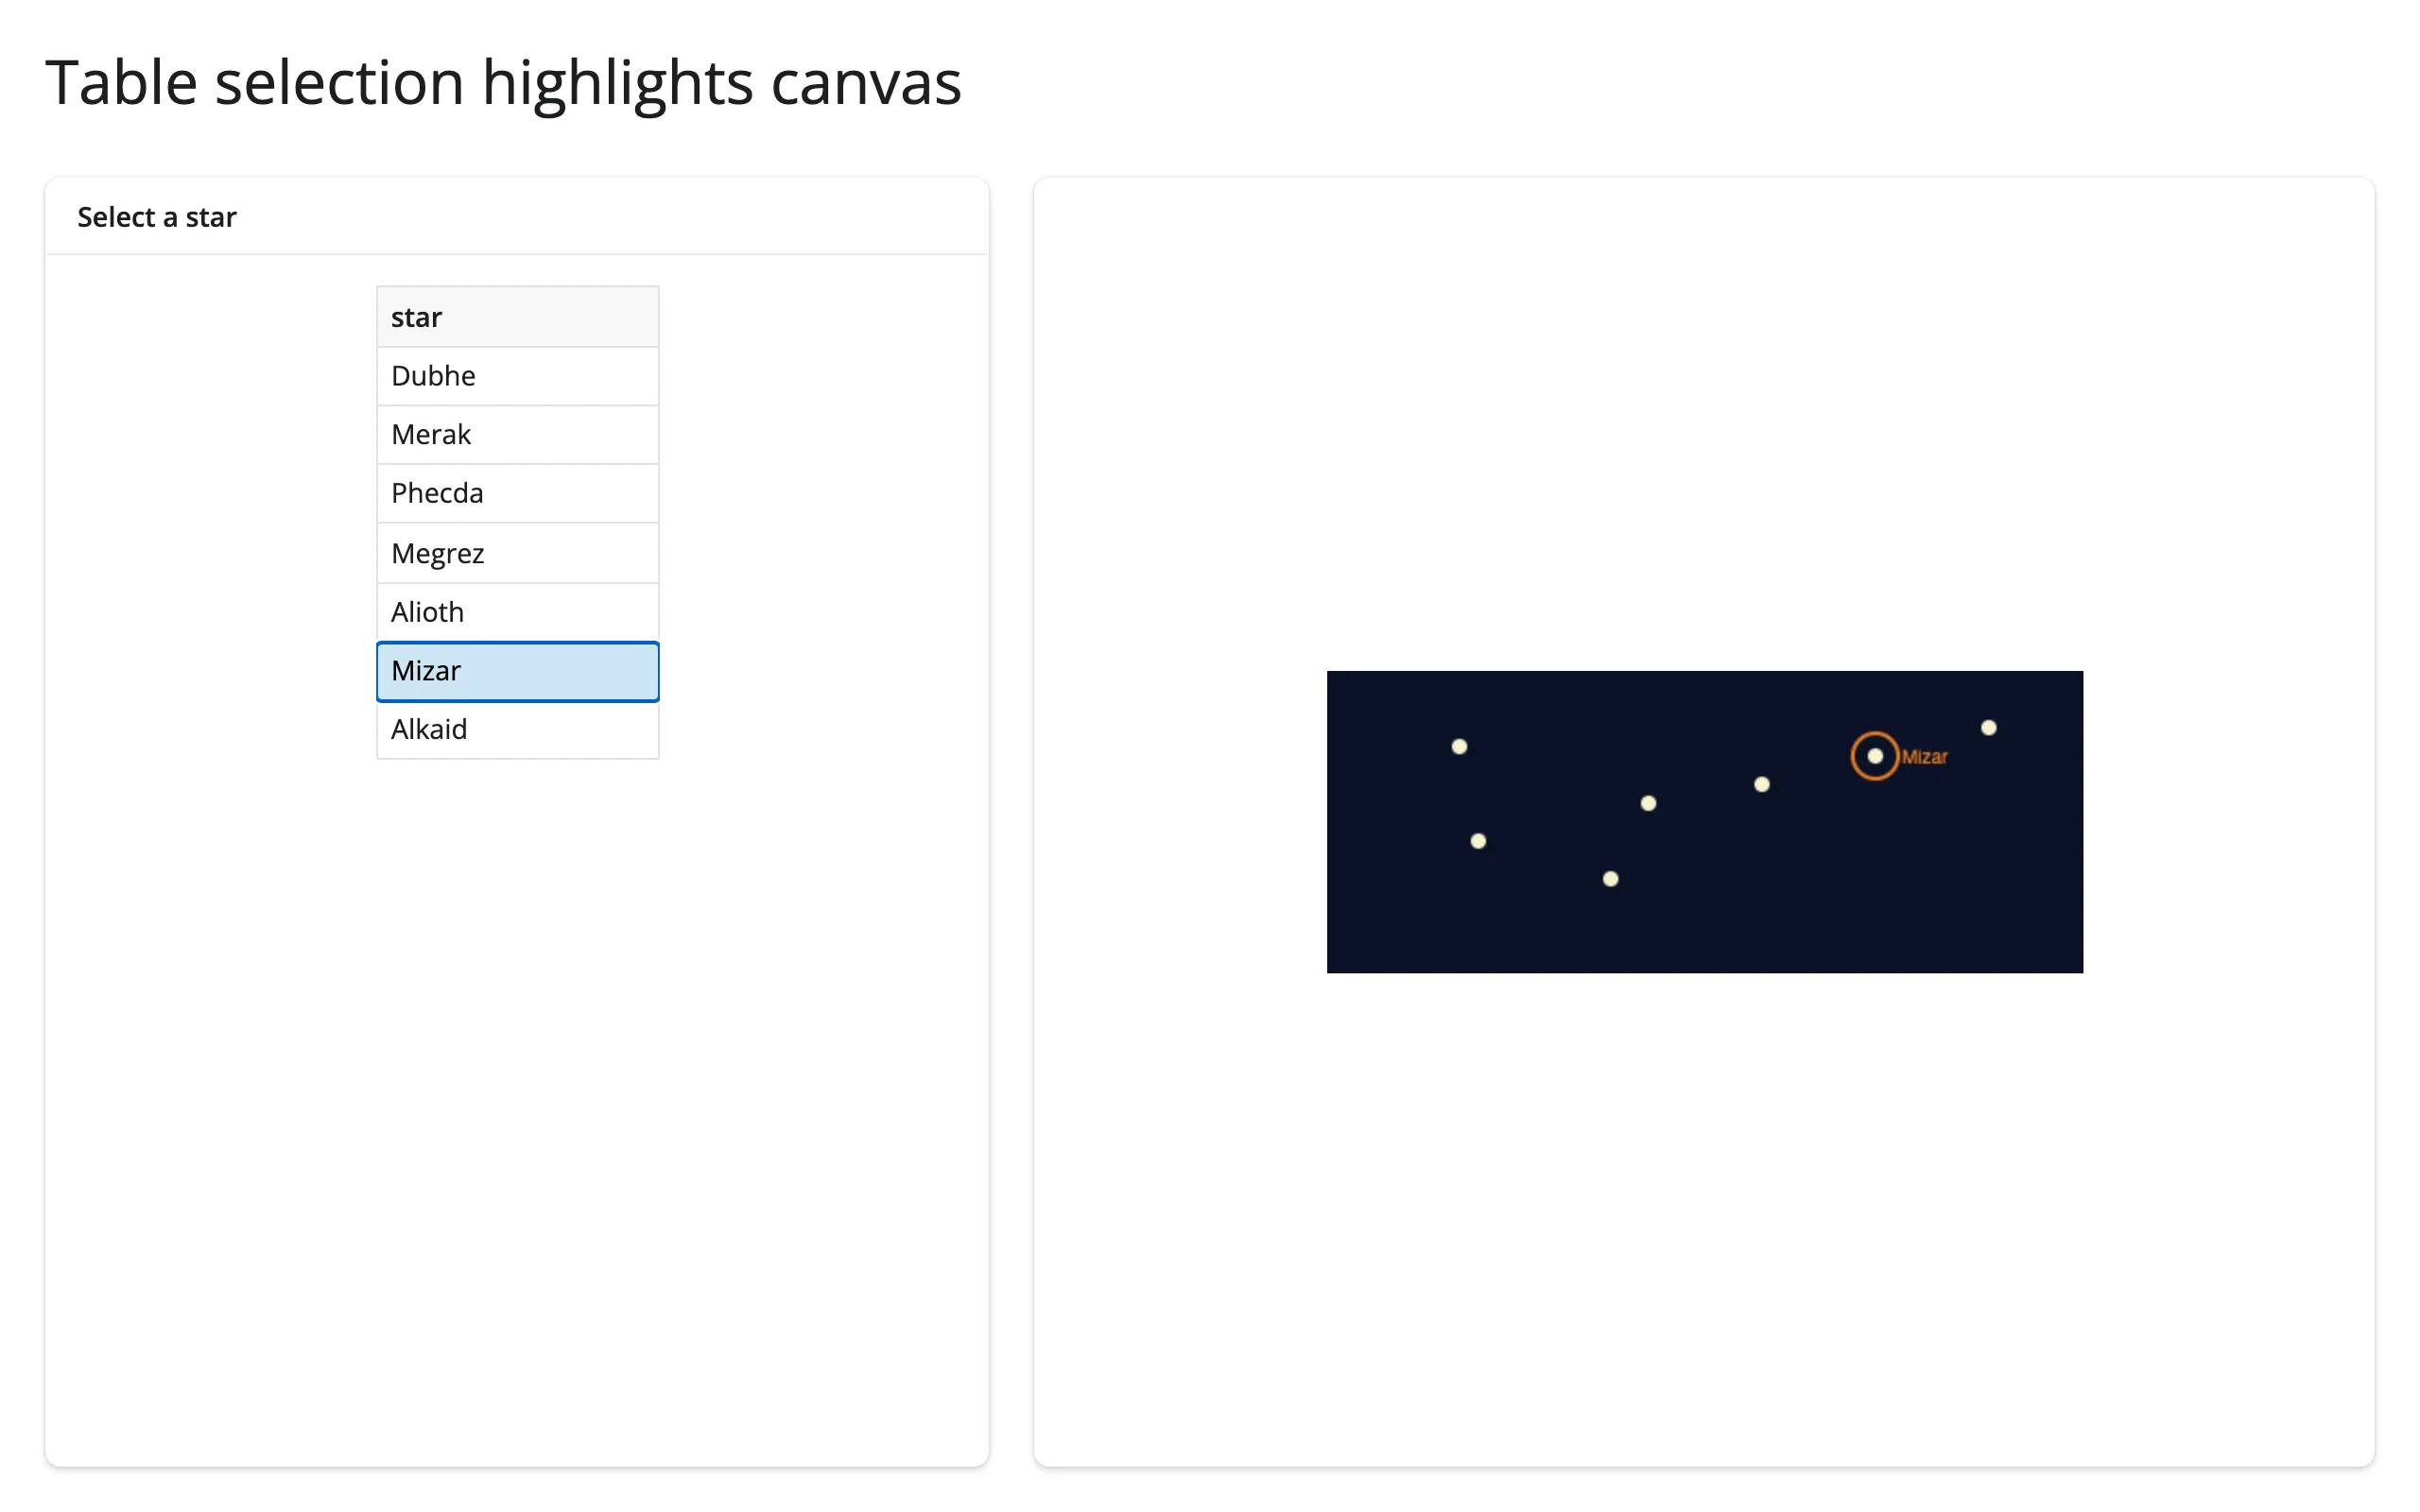
The reverse direction: a render.DataGrid(selection_mode="row") drives which point gets a highlight ring on the canvas, redrawn in an effect that reads table.cell_selection()["rows"]:
@reactive.effect
def _highlight_selected():
    rows = table.cell_selection()["rows"]
redraw(rows[0] if rows else None)| Before | After selecting “Mizar” |
|---|---|
 |
 |
Draw a digit, classify it with a model
The flagship pattern: sync_image_data + .read() turns ink into pixels Python can hand to any model. Here, a tiny scikit-learn SVM trained on sklearn.datasets.load_digits() (1797 handwritten 0-9’s, 8x8 grayscale) classifies whatever you draw:
        @render.text
        def guess():
            png_bytes = canvas.read("image_data")
            if png_bytes is None:
                return "Draw something!"
            img = Image.open(io.BytesIO(png_bytes)).convert("L").resize((8, 8))
            pixels = np.asarray(img, dtype=float) / 255 * 16  # match 0-16 scale
            pred = clf.predict(pixels.reshape(1, -1))[0]
            return f"That looks like a {pred}"
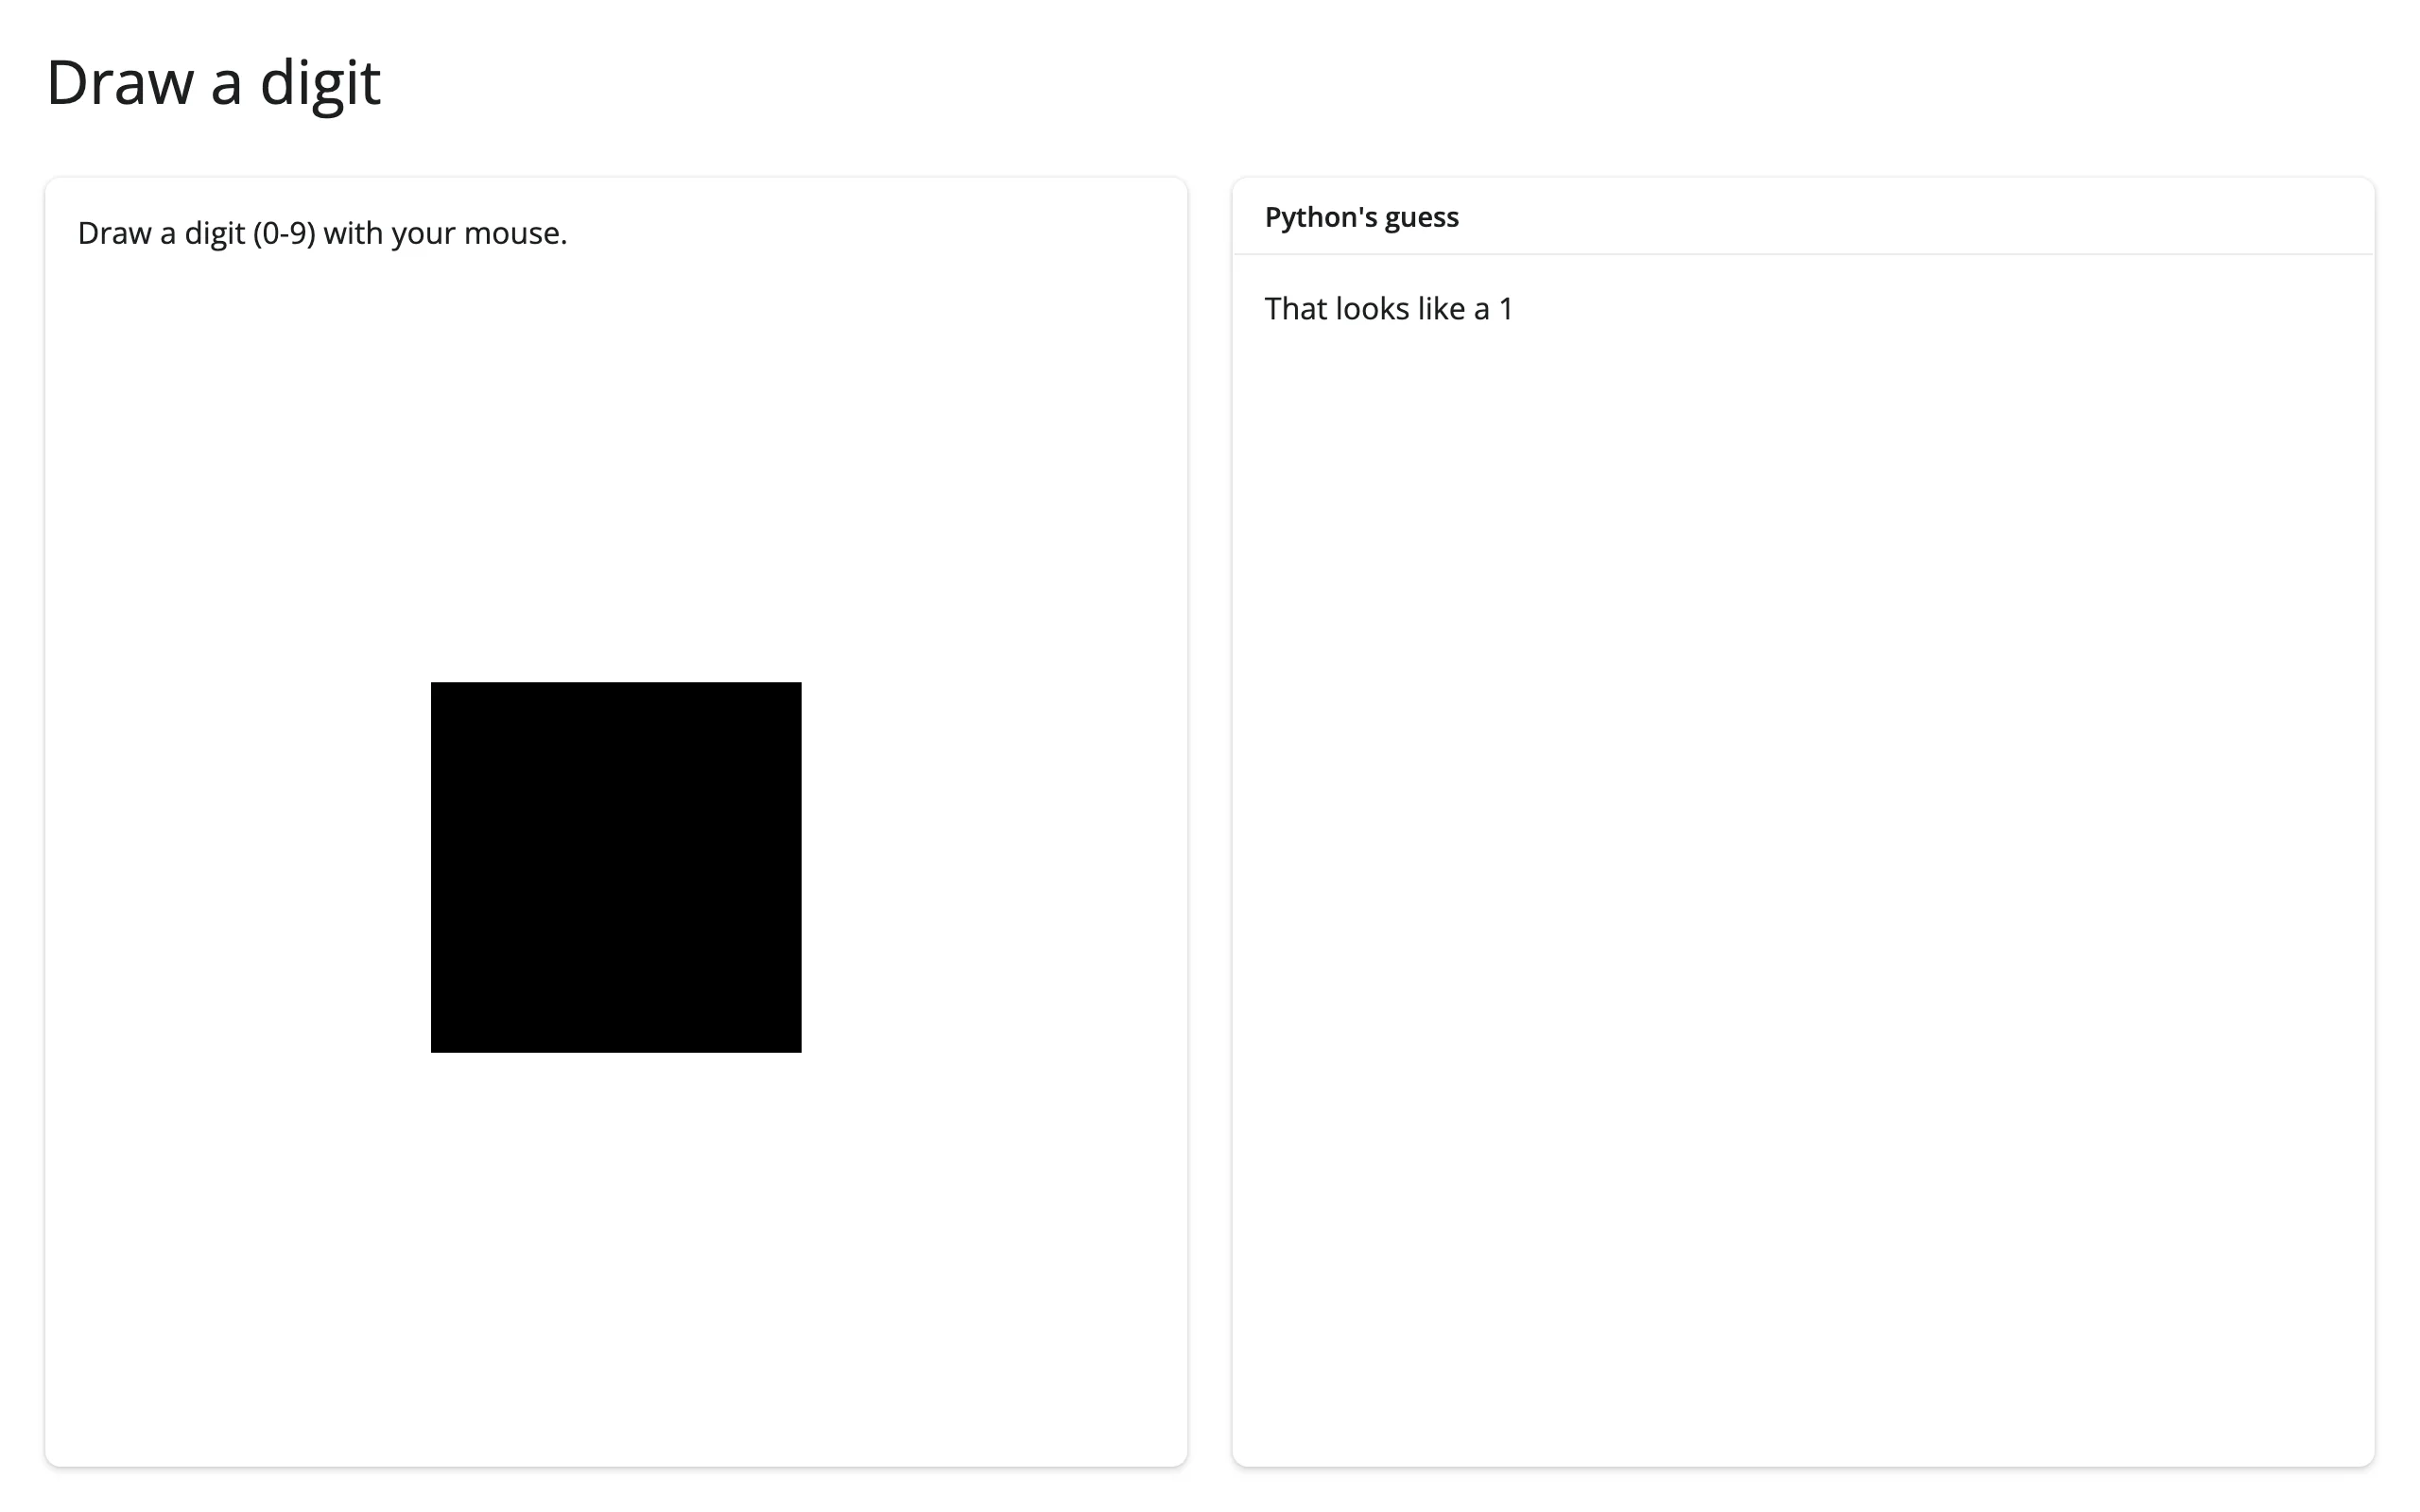
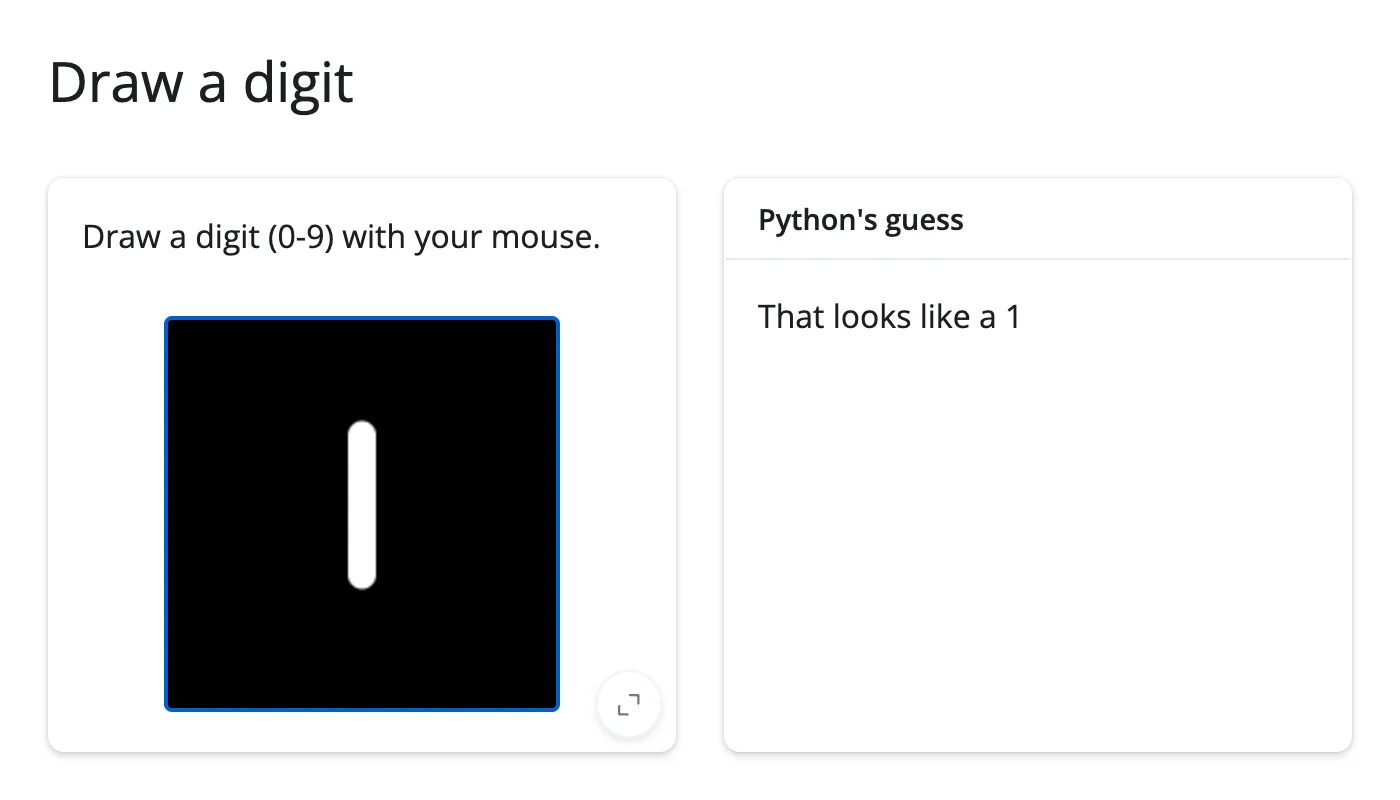
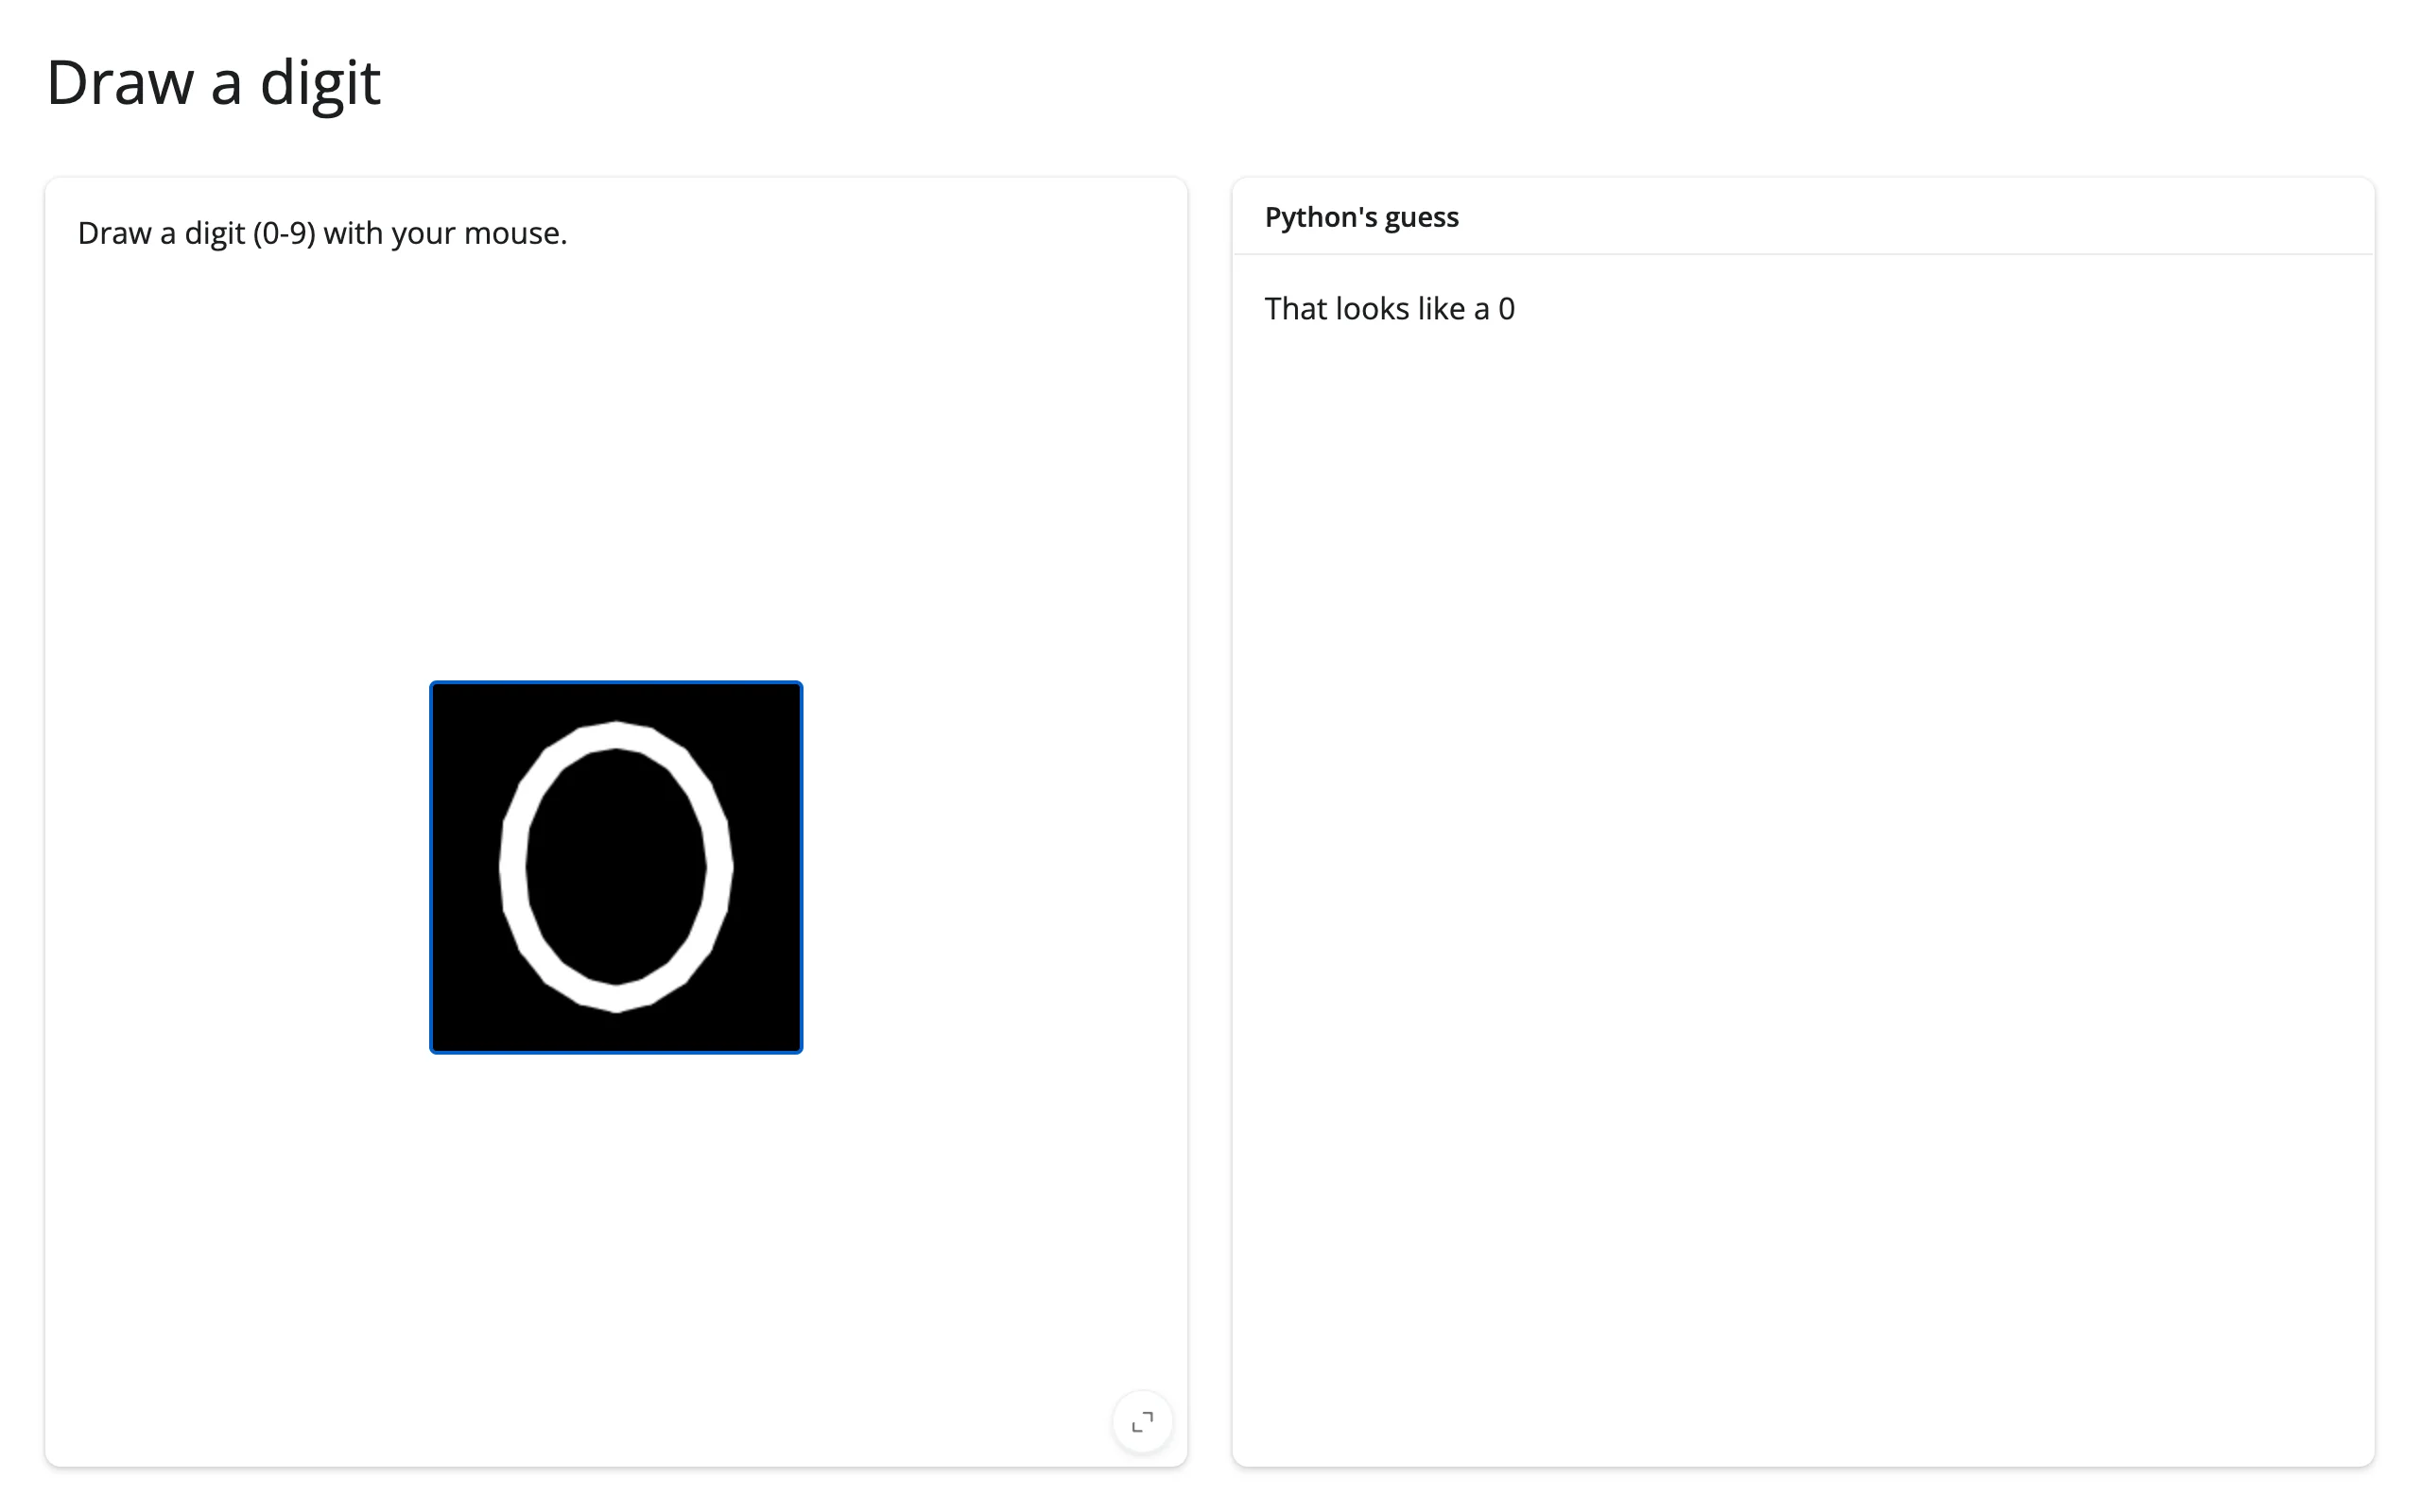
examples/14_coordinate_digit_classifier.py – verified against both a drawn “1” and a drawn “0”, each classified correctly.
| Before | Drew a “1” | Drew a “0” |
|---|---|---|
 |
 |
 |
See the full version, with confidence bars and a running tally, in Gallery candidates below.
Large data
ipycanvas has no large-data mode of its own – it’s a drawing surface, not a data renderer, so there’s no point count or row count to scale against; draw commands just land quickly because they’re batched over a binary comm channel (see the intro above), not because of any GPU-accelerated data pipeline. If you need to interactively explore millions of actual data points rather than draw shapes, reach for k3d instead.
Layout and sizing
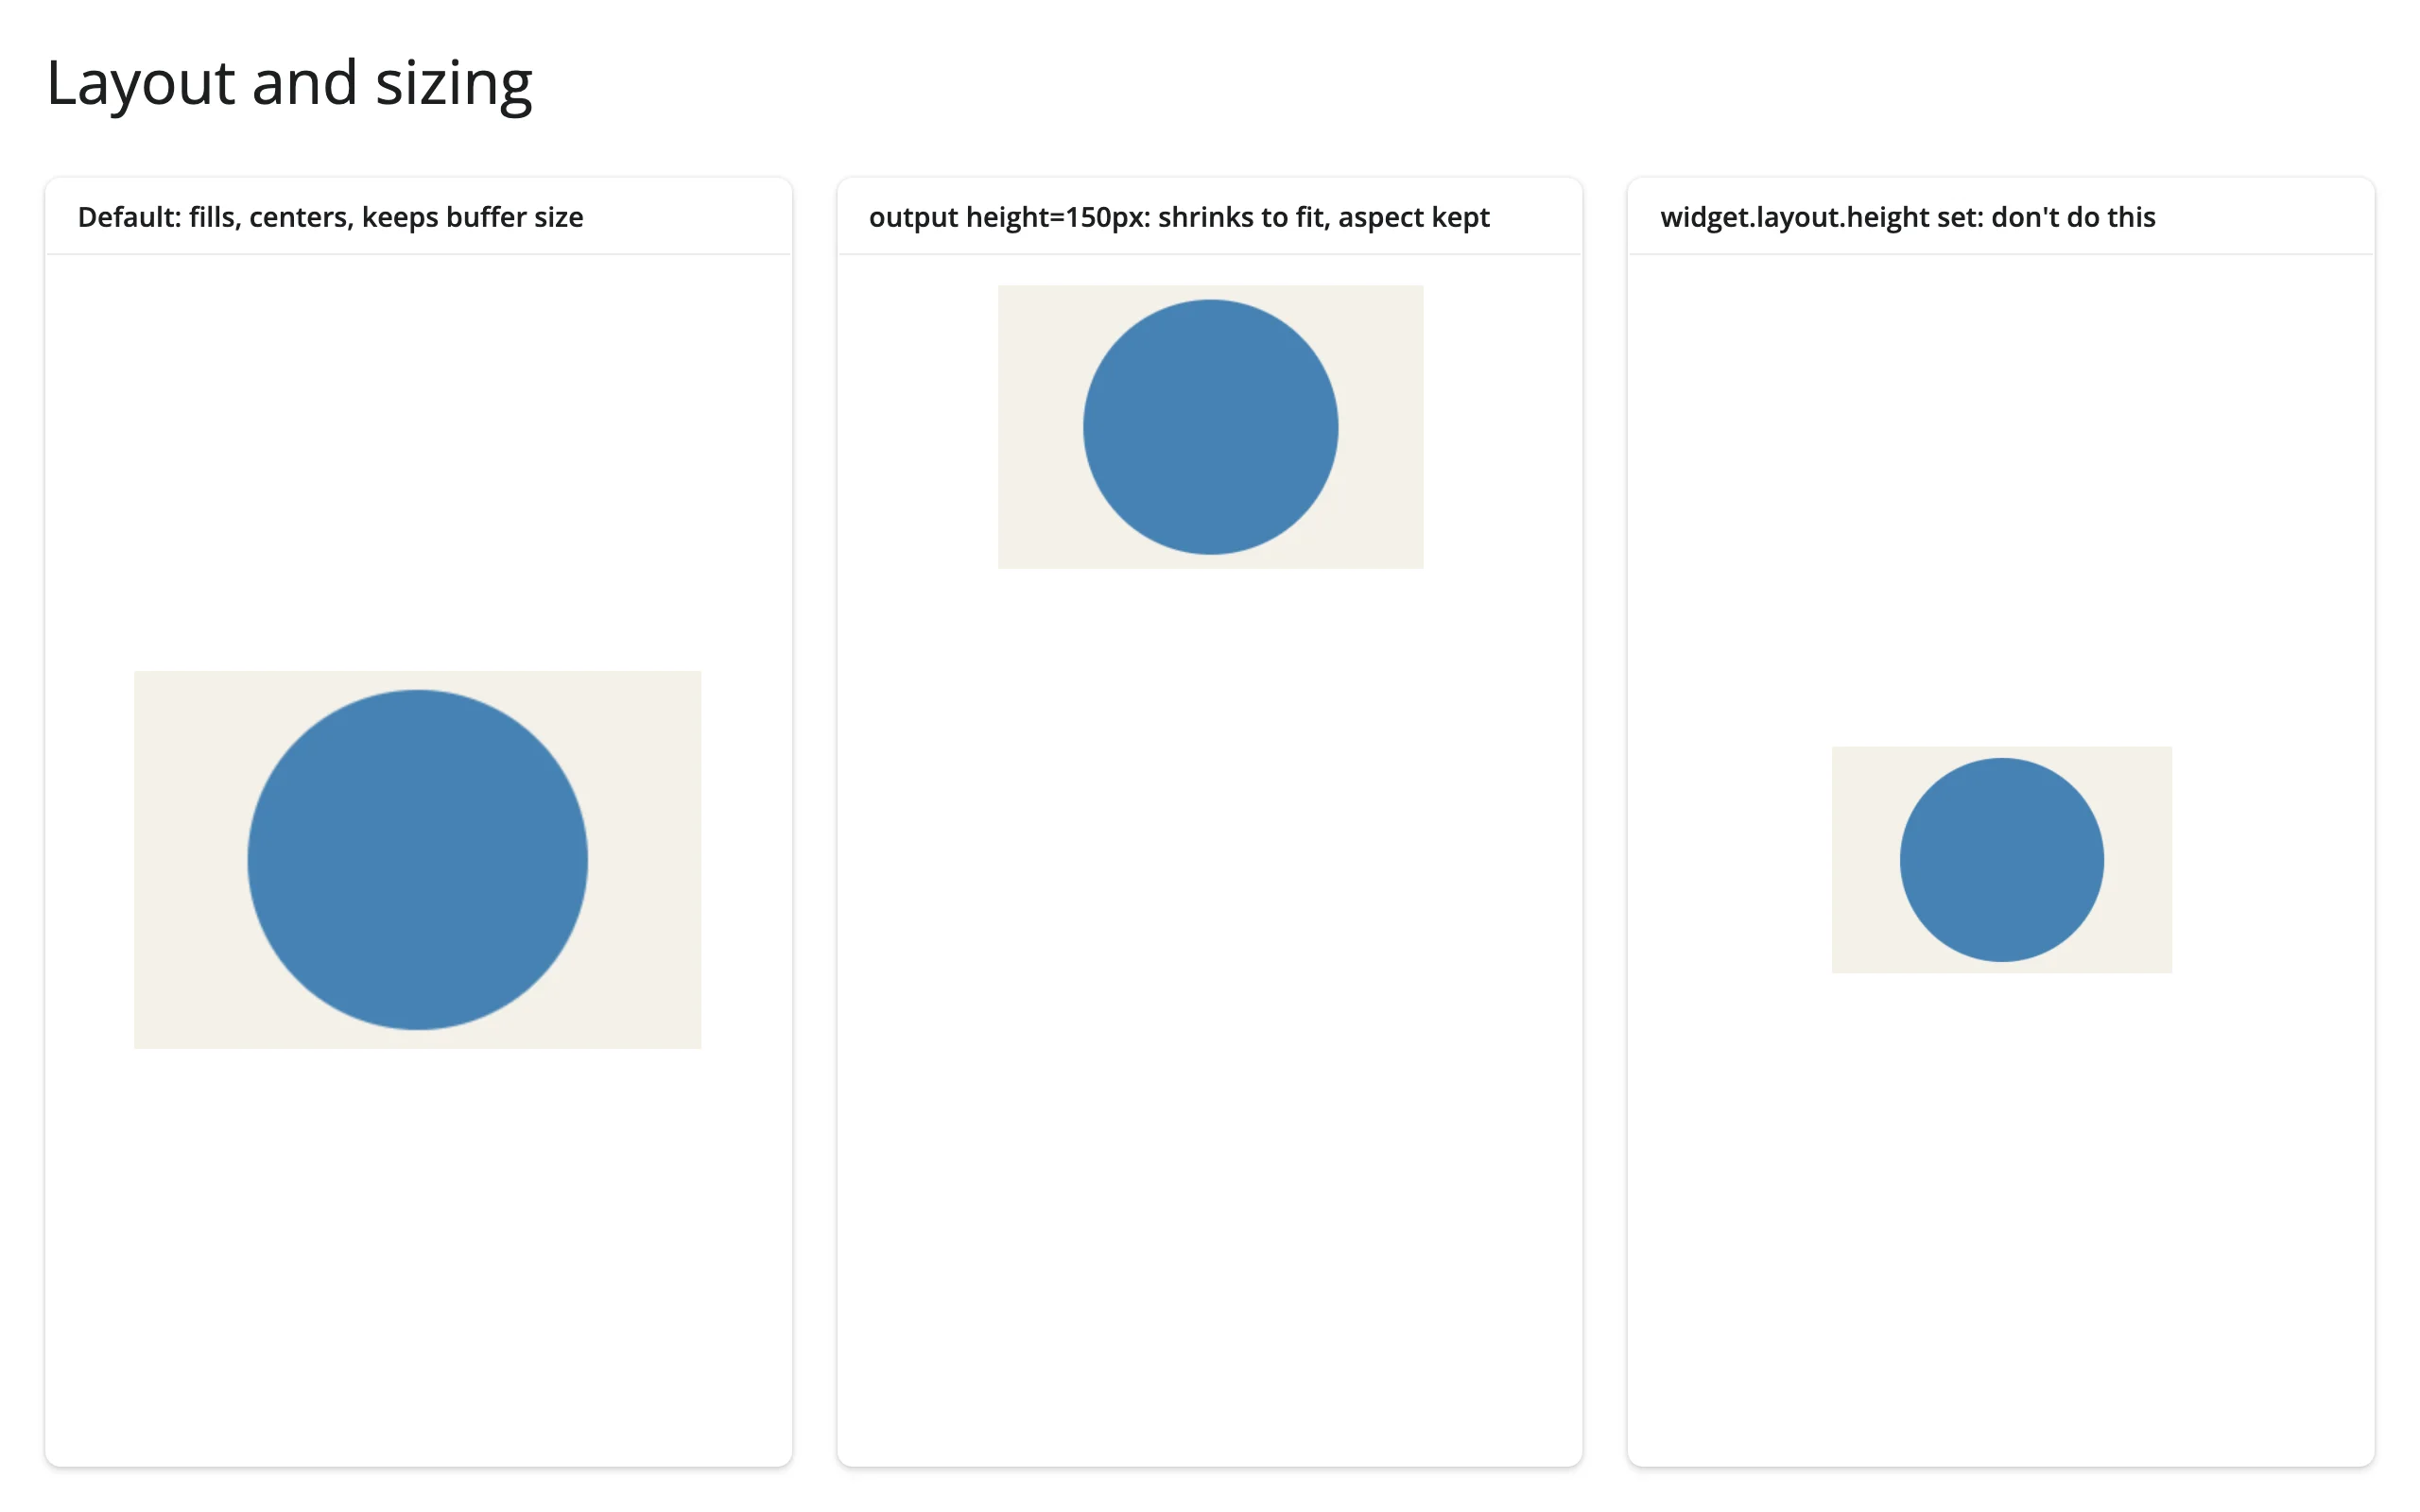
In a filling layout (the default), the canvas keeps its constructor width/height as the drawing-buffer size and centers itself, shrinking (aspect preserved) if the container is smaller. An explicit @render_ipycanvas(height= "150px") opts out of fill but still shrinks-and-centers. Setting widget.layout.height directly also opts out of fill – prefer the constructor or the output’s height= instead, since the buffer size itself is what you’re actually sizing:
@render_ipycanvas(height="150px")
def fixed_height():
    return draw(Canvas(width=300, height=200))
examples/15_layout_sizing.py – measured all three paths in a real browser: the default fills and centers at 300x200; height="150px" shrinks to 225x150 (aspect preserved) and centers; and even widget.layout.height = "120px" (discouraged) now shrinks to 180x120 and centers correctly rather than stretching, on current main.
Gotchas and limitations
- No accessors. Use the
canvas.read("image_data")recipe above for anything that needs to see pixels; everything else goes through plain mouse/keyboard callbacks. hold_canvas()is a no-op (verified above) – harmless to use, just doesn’t batch.- Canvas content is stateless. Draw commands aren’t part of widget state, so a browser refresh (a new Shiny session) starts blank, and there’s no built-in undo. Keep your own list of what you’ve drawn if you need either.
- A reactive value read and written inside an
invalidate_later()loop can starve input events. The classic animation-loop linegeneration.set(generation() + 1)makes the tick effect depend on the very value it writes, so it re-invalidates itself continuously and button clicks stop registering (verified in plain core Shiny, no shinywidgets or ipycanvas involved: the play/pause button’s@reactive.event-gated effect never ran). Two fixes, both verified: keep animation-loop state in a plain mutable Python object and have each writer redraw the widget directly (theexamples/05_game_of_life.pypattern), or keep thereactive.valuebut read it insidewith reactive.isolate():so the tick effect doesn’t take a dependency on it. Ordinary reactive-semantics footgun, not an ipycanvas or shinywidgets issue. See NOTES.md for the full investigation. - Touch events are declared (
on_touch_start/end/move/cancel) but unverified in this guide: headless Chromium via Playwright doesn’t have a simple way to synthesize multi-touch, so this wasn’t exercised. MultiCanvasrenders as a single<canvas>element. The browser composites every sub-canvas into one; don’t expectnseparate DOM canvases when writing tests or custom JS.- Size with the constructor, not
layout.height. See Layout and sizing above – both now behave the same (shrink, center, preserve aspect), but the constructor is the one place that also controls pixel resolution.
Gallery candidates
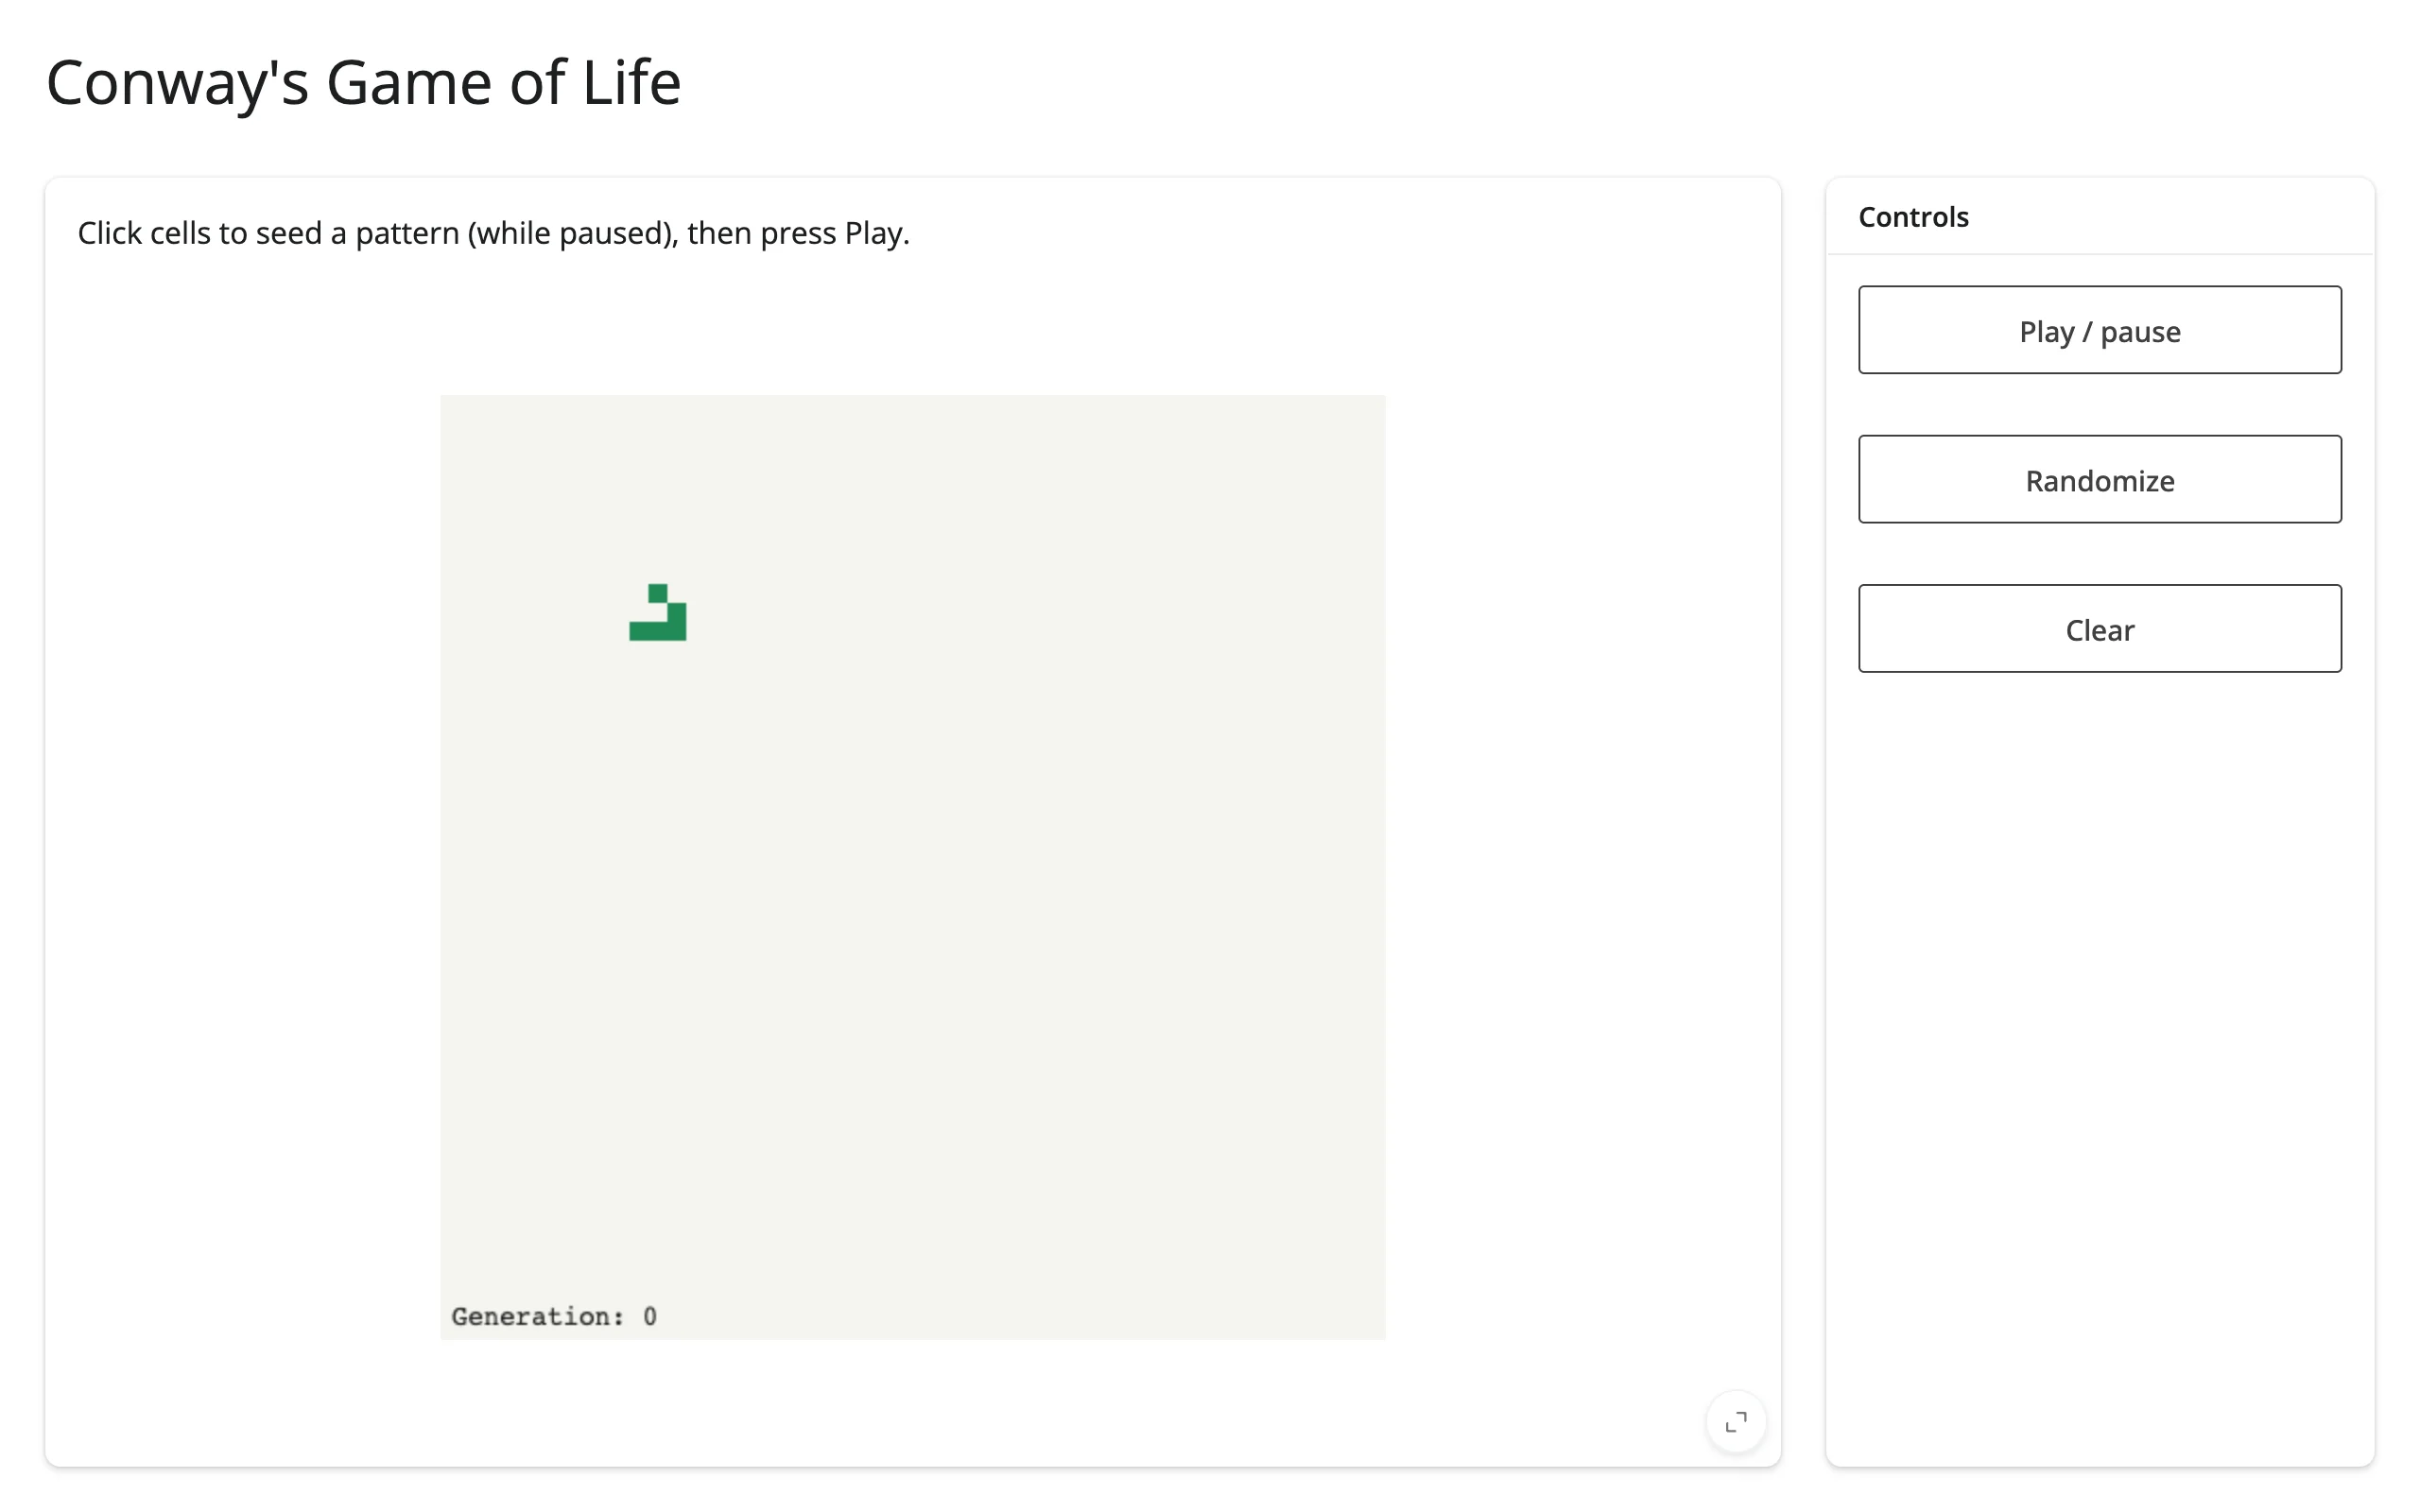
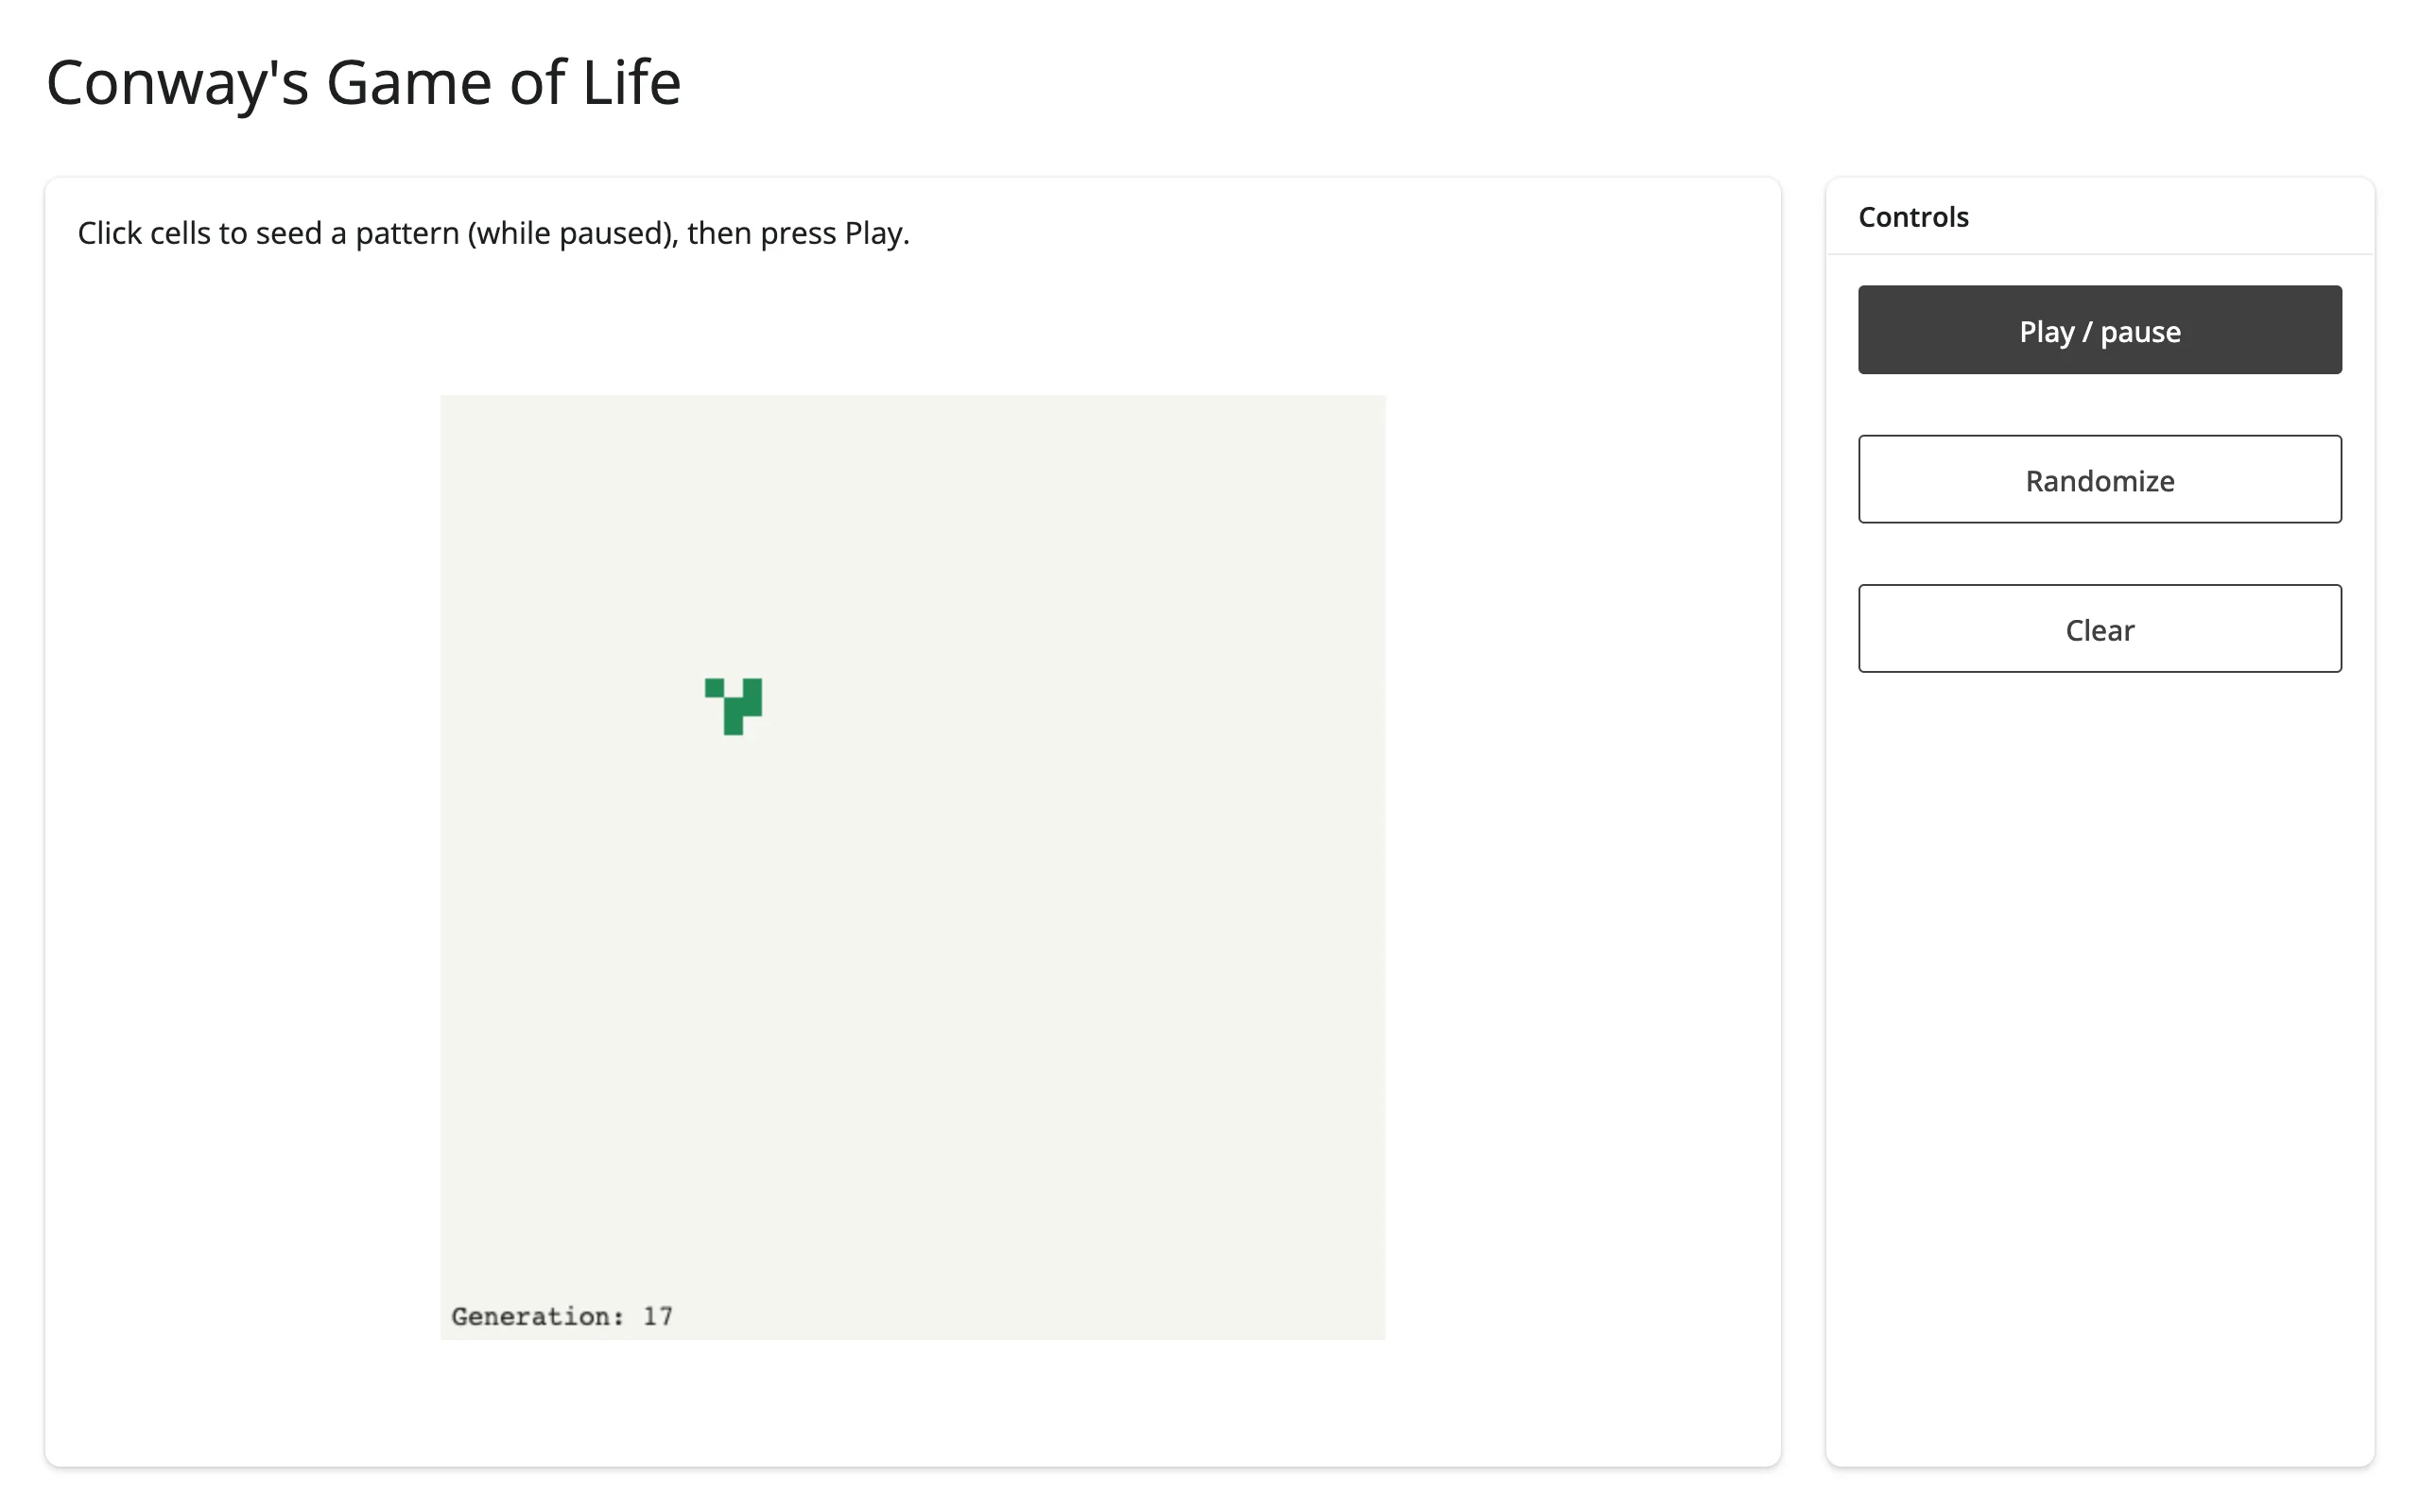
template_game_of_life.py – template
Click cells to seed a pattern while paused, then press Play to watch a reactive.invalidate_later() loop step Conway’s Game of Life. A clean, ~100-line starting point for anything that mixes click-to-edit state with a Python-driven animation loop.
Run: uv run shiny run template_game_of_life.py
| Seeded (paused) | Running |
|---|---|
 |
 |
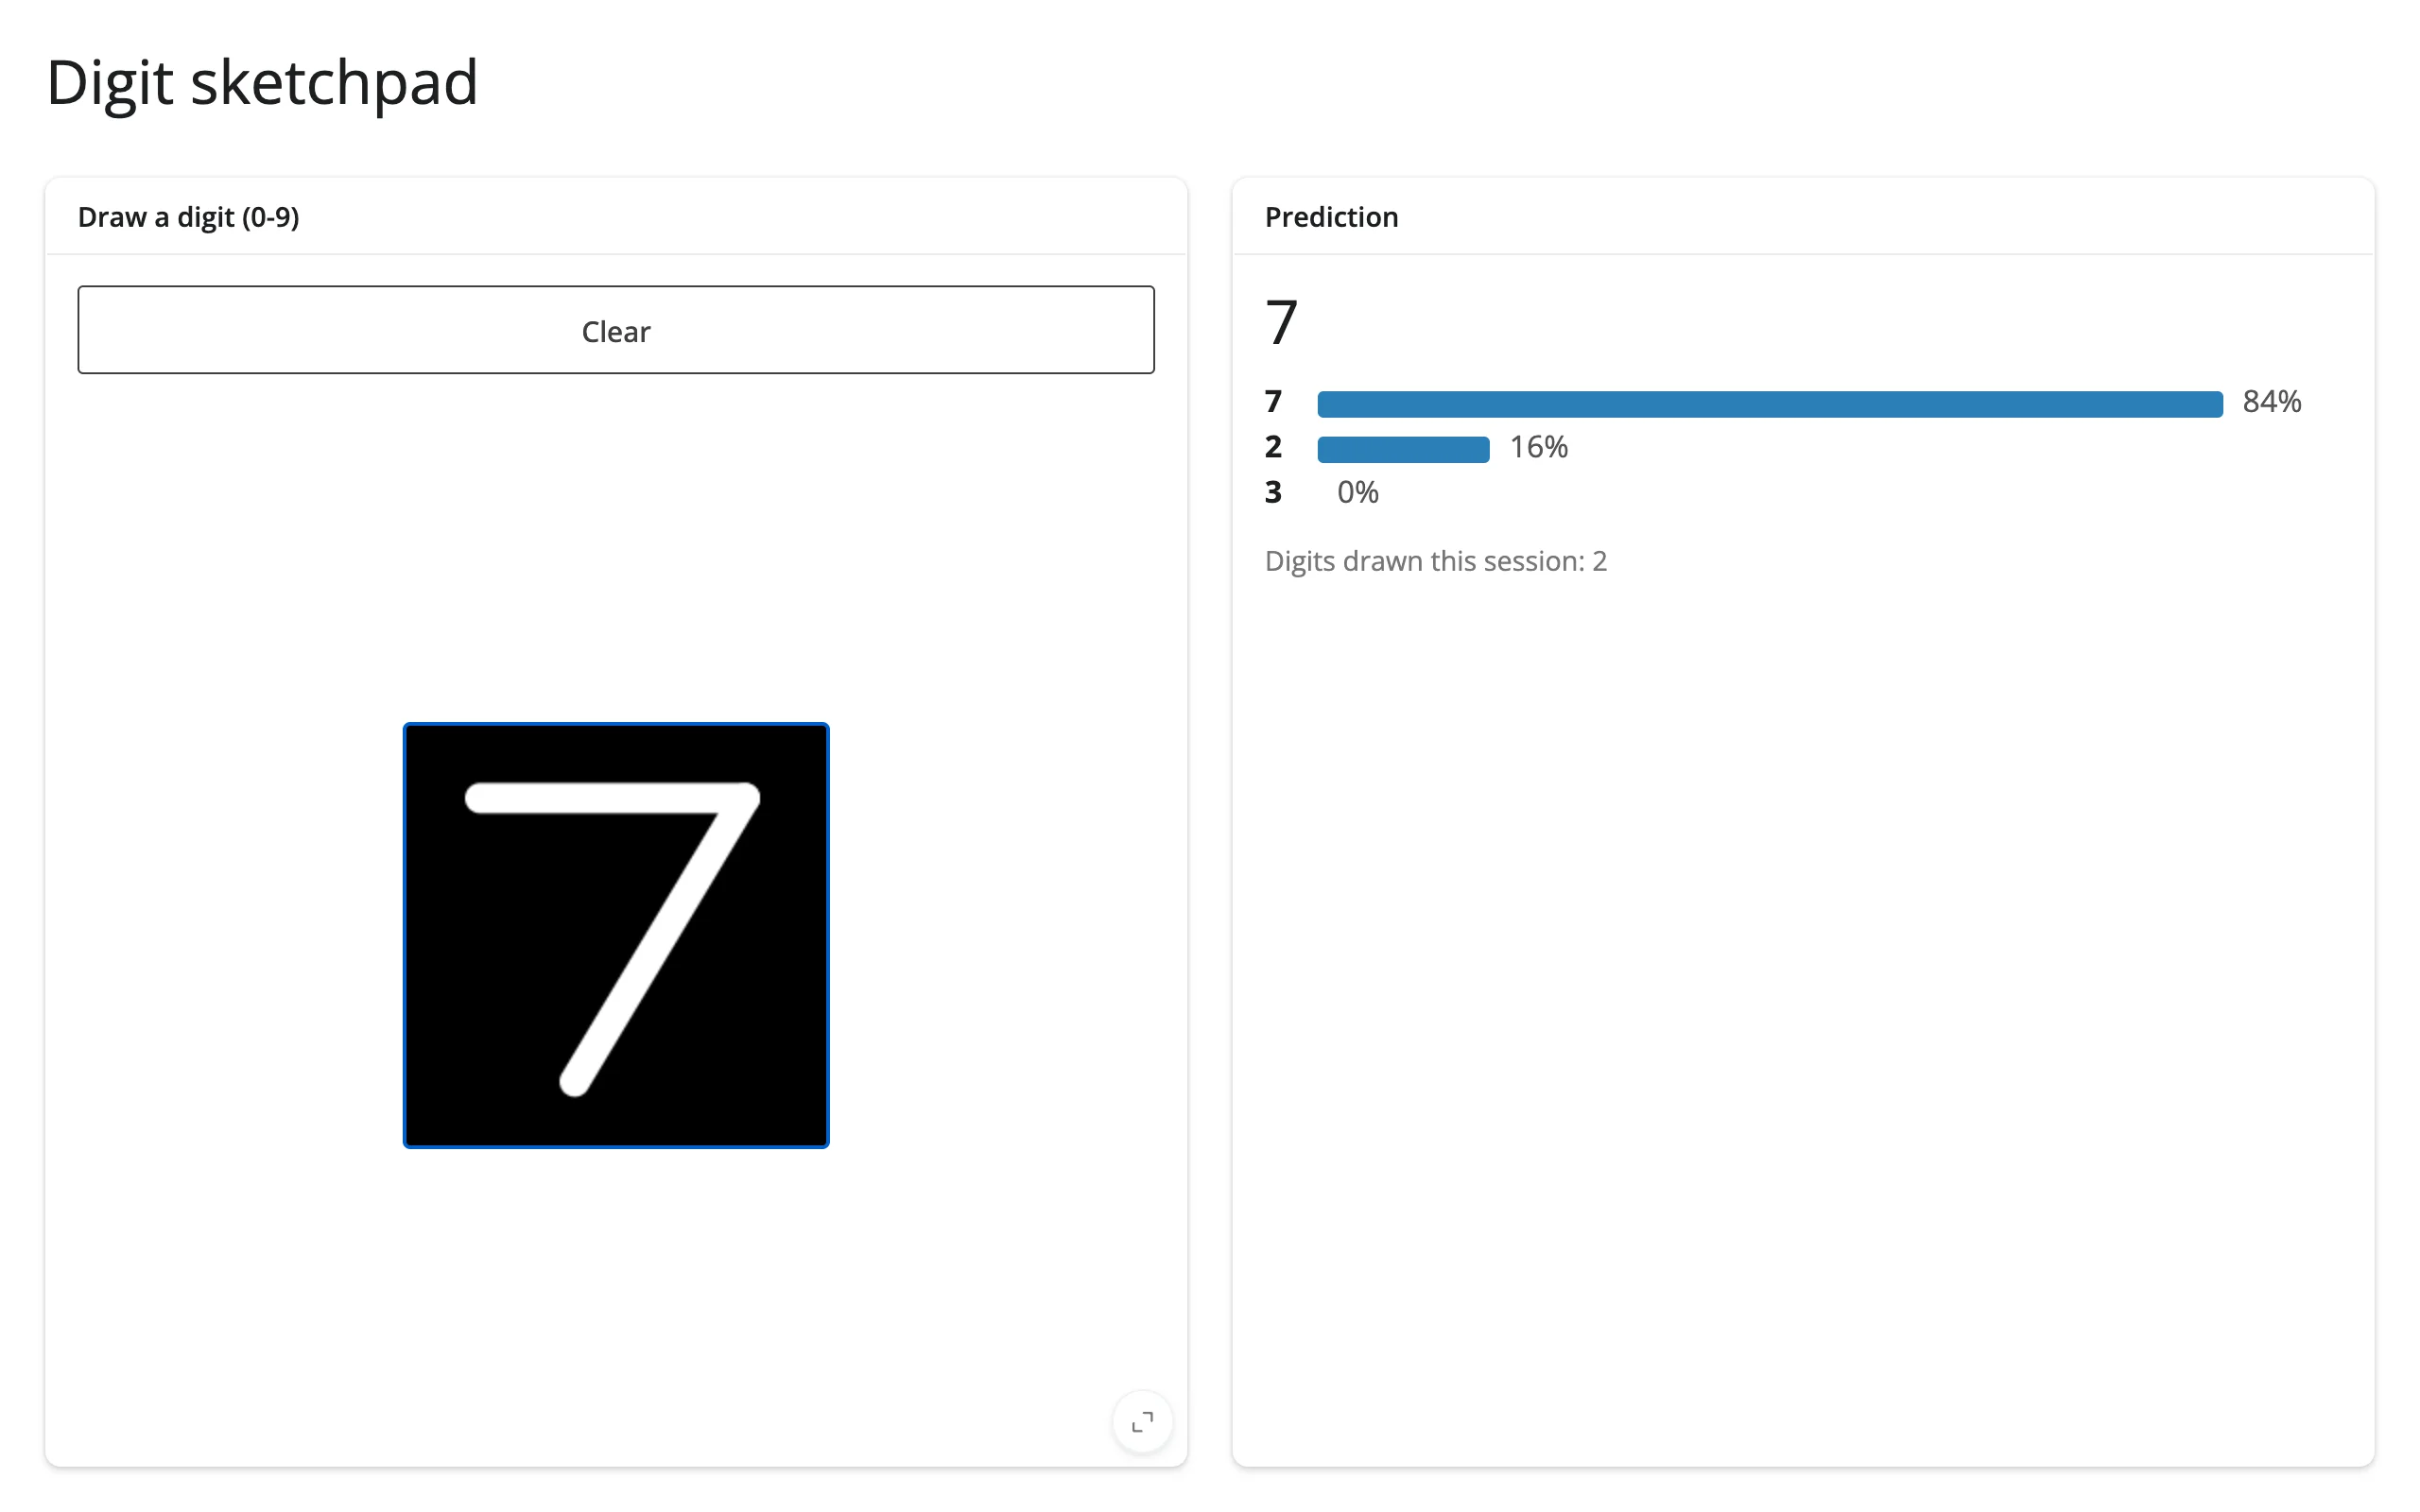
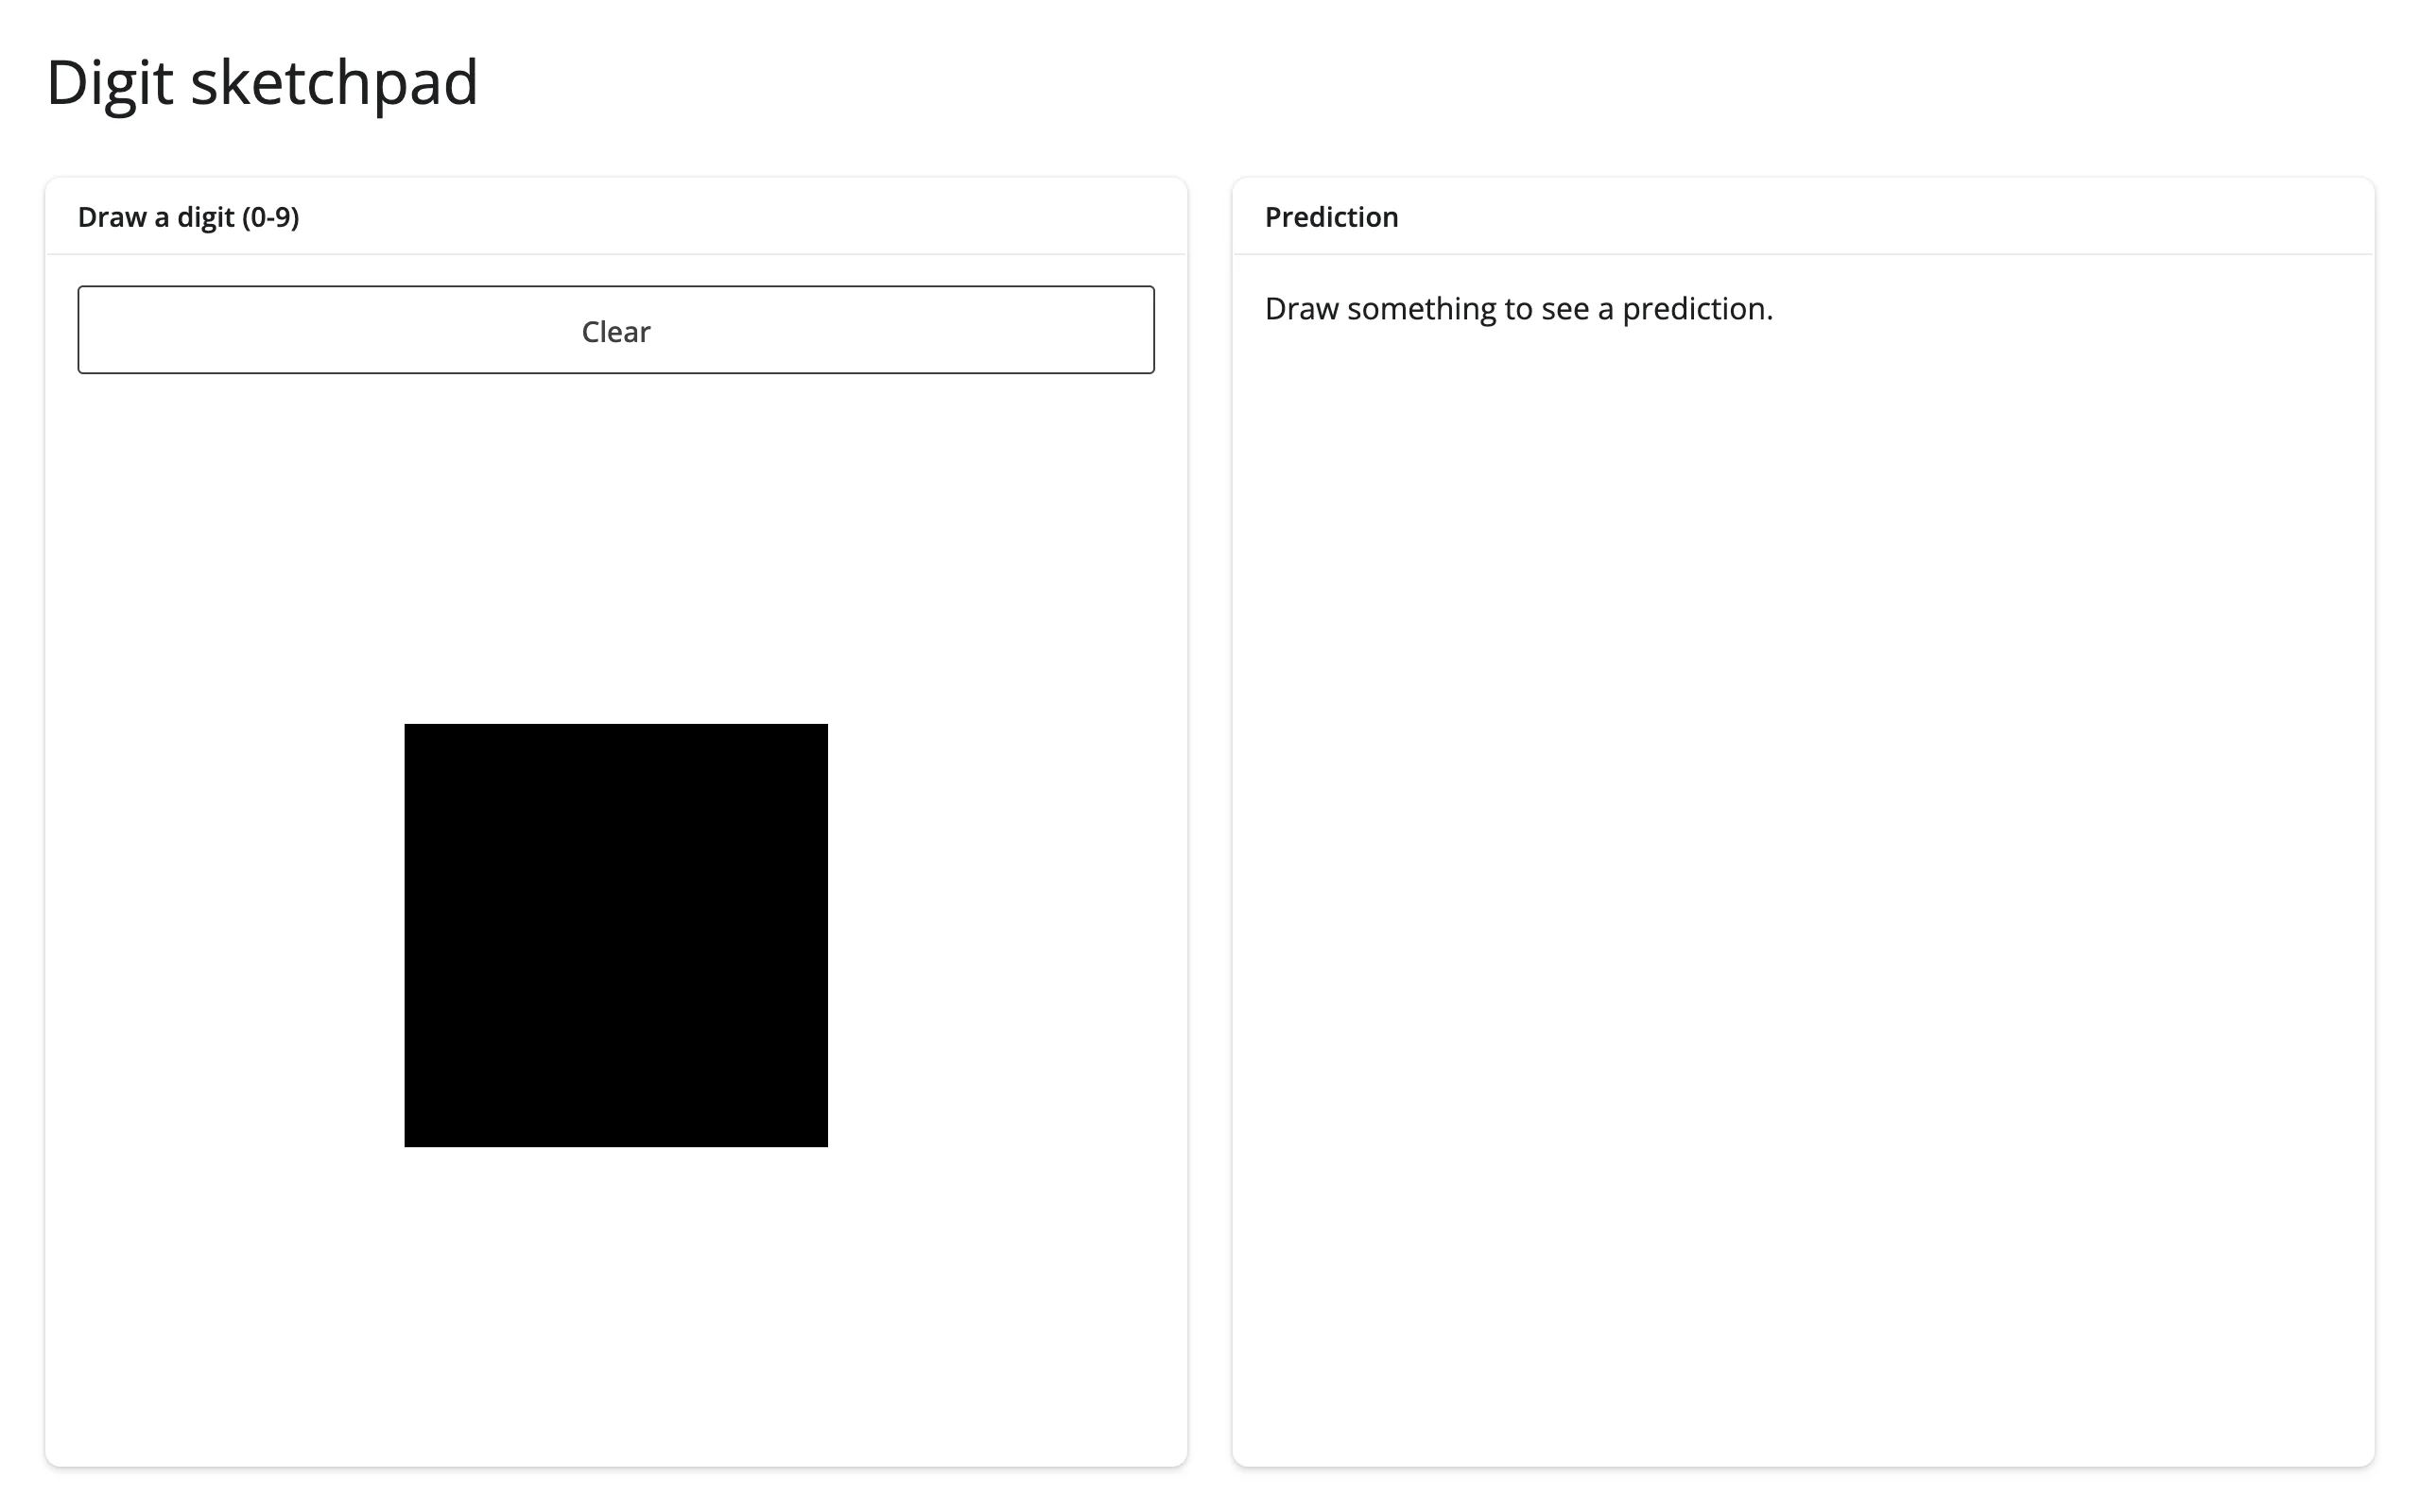
showcase_digit_sketchpad.py – showcase
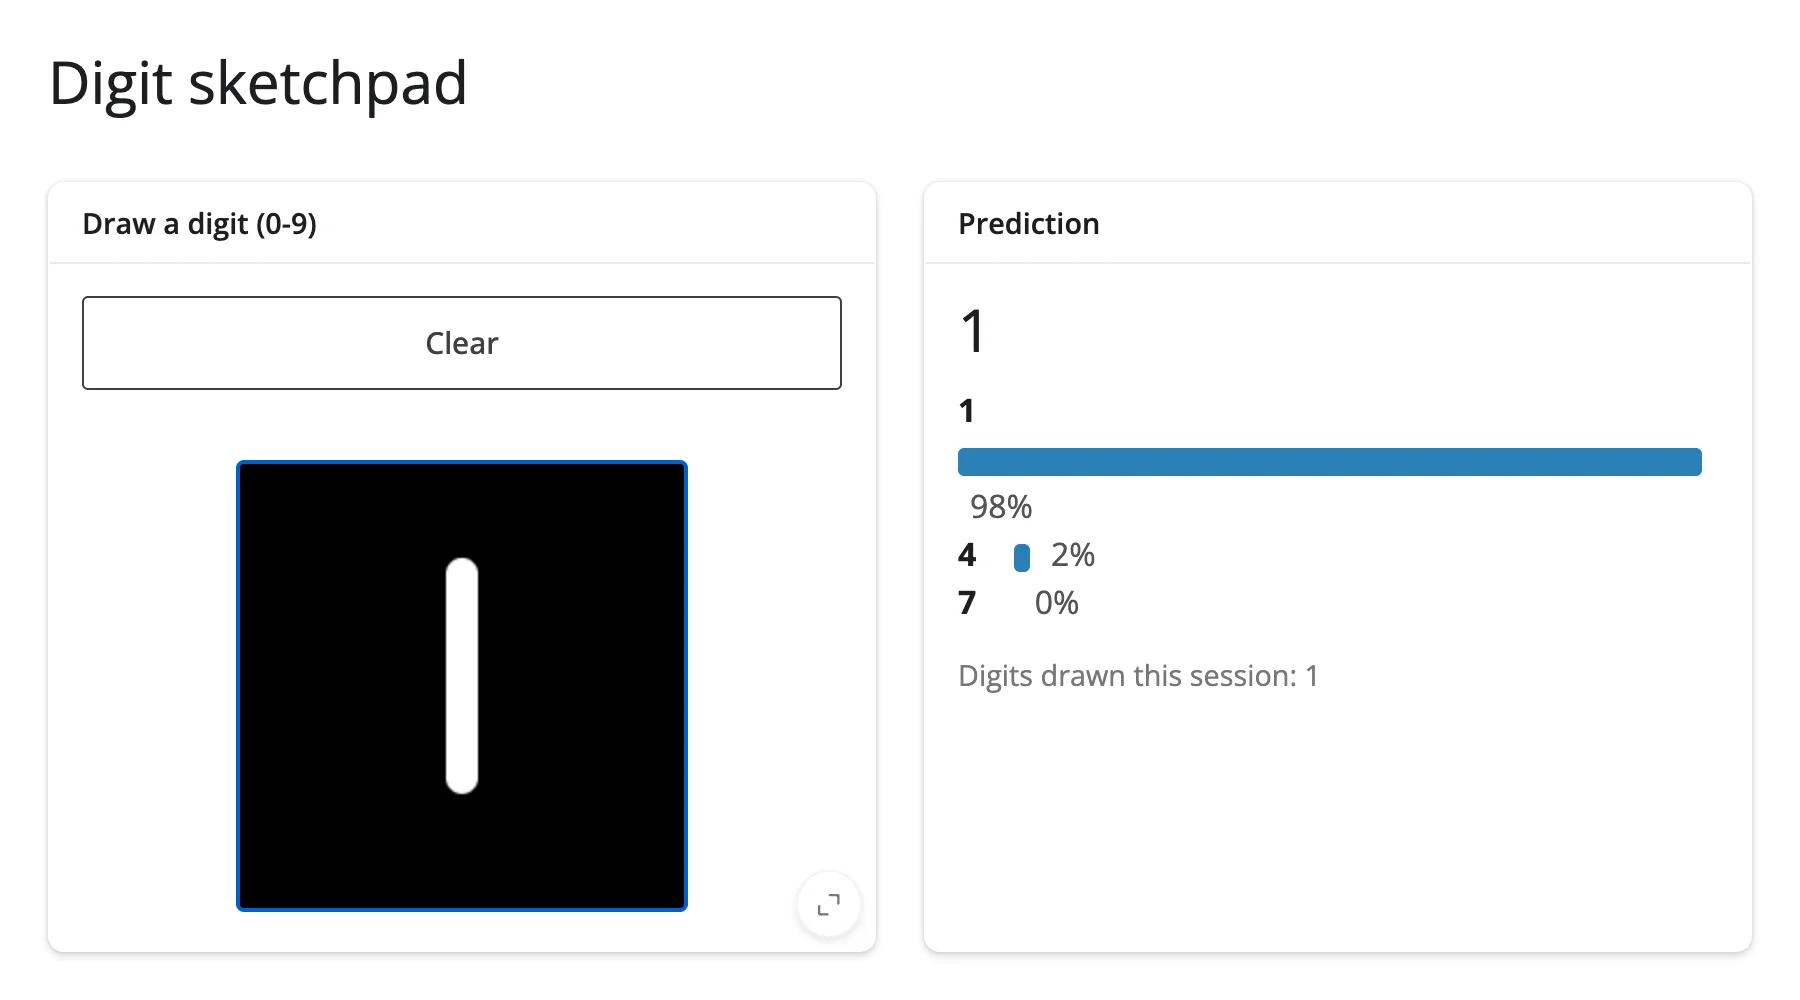
The full digit classifier from “Coordinating multiple views,” with confidence bars for the model’s top 3 guesses and a running count of digits drawn this session. Trains a CalibratedClassifierCV(SVC()) on sklearn.datasets.load_digits() at startup (a few hundred milliseconds), then classifies every stroke live via sync_image_data + .read().
Run: uv run --with scikit-learn shiny run showcase_digit_sketchpad.py
Data: sklearn.datasets.load_digits() (bundled with scikit-learn)
| Before | Drew a “7” |
|---|---|
 |
 |
Learn more
- ipycanvas documentation
- ipycanvas API reference – the full drawing method list, events, and
MultiCanvas/RoughCanvasdetails this guide doesn’t repeat - drawdata guide – a different browser-drawing surface, producing labeled point/line data instead of raw pixels
- matplotlib guide and pythreejs guide – for chart- and 3D-scene-shaped drawing instead of a raw 2D canvas