GeoLibre
GeoLibre is not a map widget – it’s a full GIS application (layer panel, styling tools, drawing and measuring, algorithms, a basemap gallery) built on MapLibre GL JS and shipped as an anywidget. Where most Python mapping libraries give you a canvas you draw layers onto, GeoLibre gives you the application a GIS analyst would open: every layer you add from Python shows up in a real layer panel with its own opacity slider, style editor, and visibility toggle, and the app’s own toolbar carries a measuring tool, a search box, bookmarks, and more, with zero extra code.
@render_geolibre renders a geolibre.Map as a Shiny output. It sizes the embedded app to fill its container (unless the map has an explicit height), and – this is the part that takes real engineering – it serves GeoLibre’s bundled single-page app from the Shiny process itself, including a same-origin proxy for layers backed by files on the server’s disk. That means the integration works the same way locally and deployed (shinyapps.io, Posit Connect), which is not true of a naive embed of a tool designed to run next to a Jupyter kernel.
GeoLibre has no reactive accessors (see the roster comparison below for widgets that do). The interaction story here is two synced-trait tiers instead: register event callbacks (on_click(), on_selection_change(), on_layer_change()) inside your render function to get clicks and selections as they happen, and map.read("project") to read the map’s whole live document – its view, layers, and styling – whenever the user changes it. Driving the map back from Python splits into two very different cases: project edits (add_geojson(), set_center(), layer styling) are instant, in-place trait updates, while GeoLibre’s command methods (fly_to(), get_center(), to_image(), …) wait for the running app’s reply – their *_async() variants await that reply on Shiny’s own event loop, but only from inside a reactive.extended_task – a real Shiny-specific wrinkle this guide covers in detail. Requires Python 3.11 or later.
Reach for GeoLibre when you want users to explore, style, and annotate spatial data themselves inside your app – not just look at a map you built. If you want a lightweight, fully programmatic map you drive entirely from Python, see maplibre or leafmap. If your map needs to render millions of points, see lonboard.
Installation
pip install 'shinywidgets[geolibre]'This pulls in geolibre>=3.6.0 (the version floor with *_async() command-method variants; see “Updating the widget from Python” below) and is only installable on Python 3.11+.
Quick start
from __future__ import annotations

from geolibre import Map
from shiny.express import ui

from shinywidgets import render_geolibre

ui.page_opts(title="GeoLibre quickstart", fillable=True)

US_STATES = (
    "https://raw.githubusercontent.com/PublicaMundi/MappingAPI/"
    "master/data/geojson/us-states.json"
)

with ui.card(full_screen=True):
    ui.card_header("The full GeoLibre app, as a Shiny output")

    @render_geolibre
    def map():
        m = Map(center=(-98.5, 39.8), zoom=4)
        m.add_geojson(US_STATES, name="US States", fillColor="#2a6fdb", fillOpacity=0.25)
        return m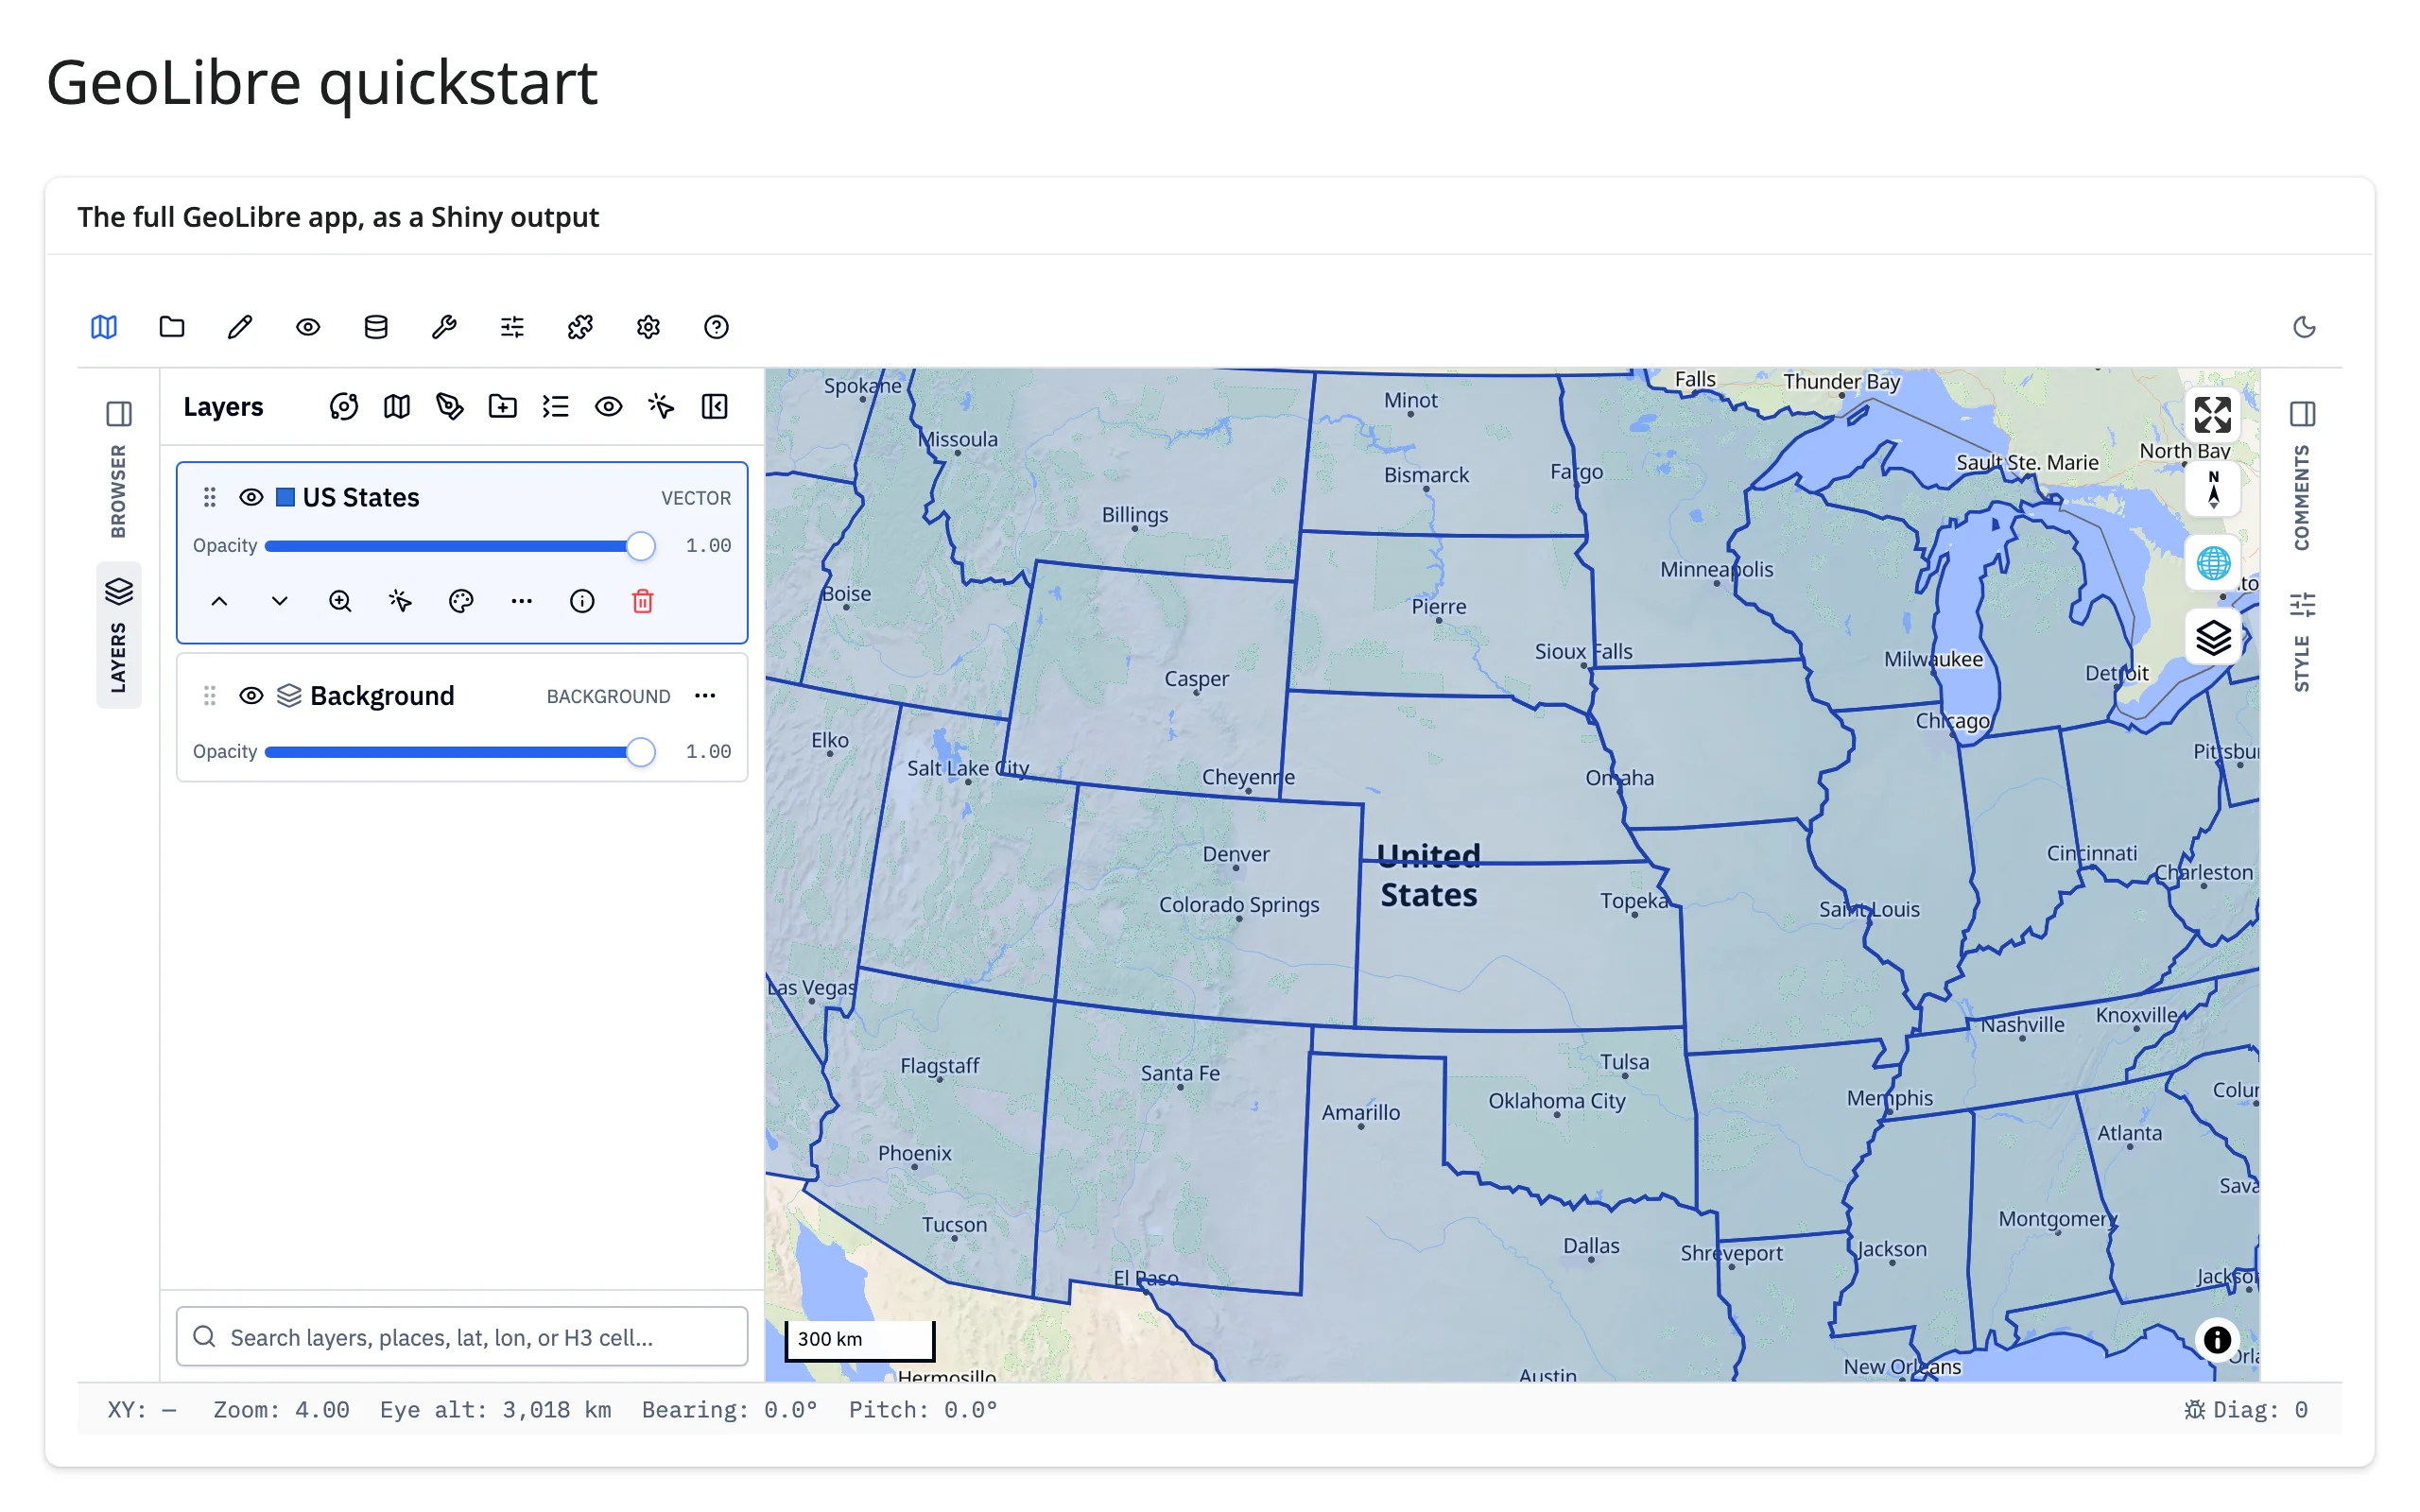
One add_geojson() call gives you the map and a layer panel entry with a visibility toggle, an opacity slider, a style editor, and a delete button – all of GeoLibre’s, none of yours.
What you can build
Real layer types, not just one
Map has dozens of add_* methods for vector data (add_geojson(), add_vector(), add_gdf(), add_csv(), …), rasters (add_cog(), add_raster()), and point data (add_markers(), add_circle_markers(), add_heatmap(), add_choropleth(), …). Each adds its own entry to the layer panel, so a polygon layer and a point layer coexist with independent styling.
    @render_geolibre
    def map():
        m = Map(center=(-98.5, 39.8), zoom=3.5)
        m.add_geojson(US_STATES, name="US States", fillColor="#cbd5e0", fillOpacity=0.25)
        m.add_circle_markers(
            [(lng, lat) for _, lng, lat, _ in CITIES],
            name="Largest cities",
            radius=10,
            fillColor="#e3342f",
        )
        return m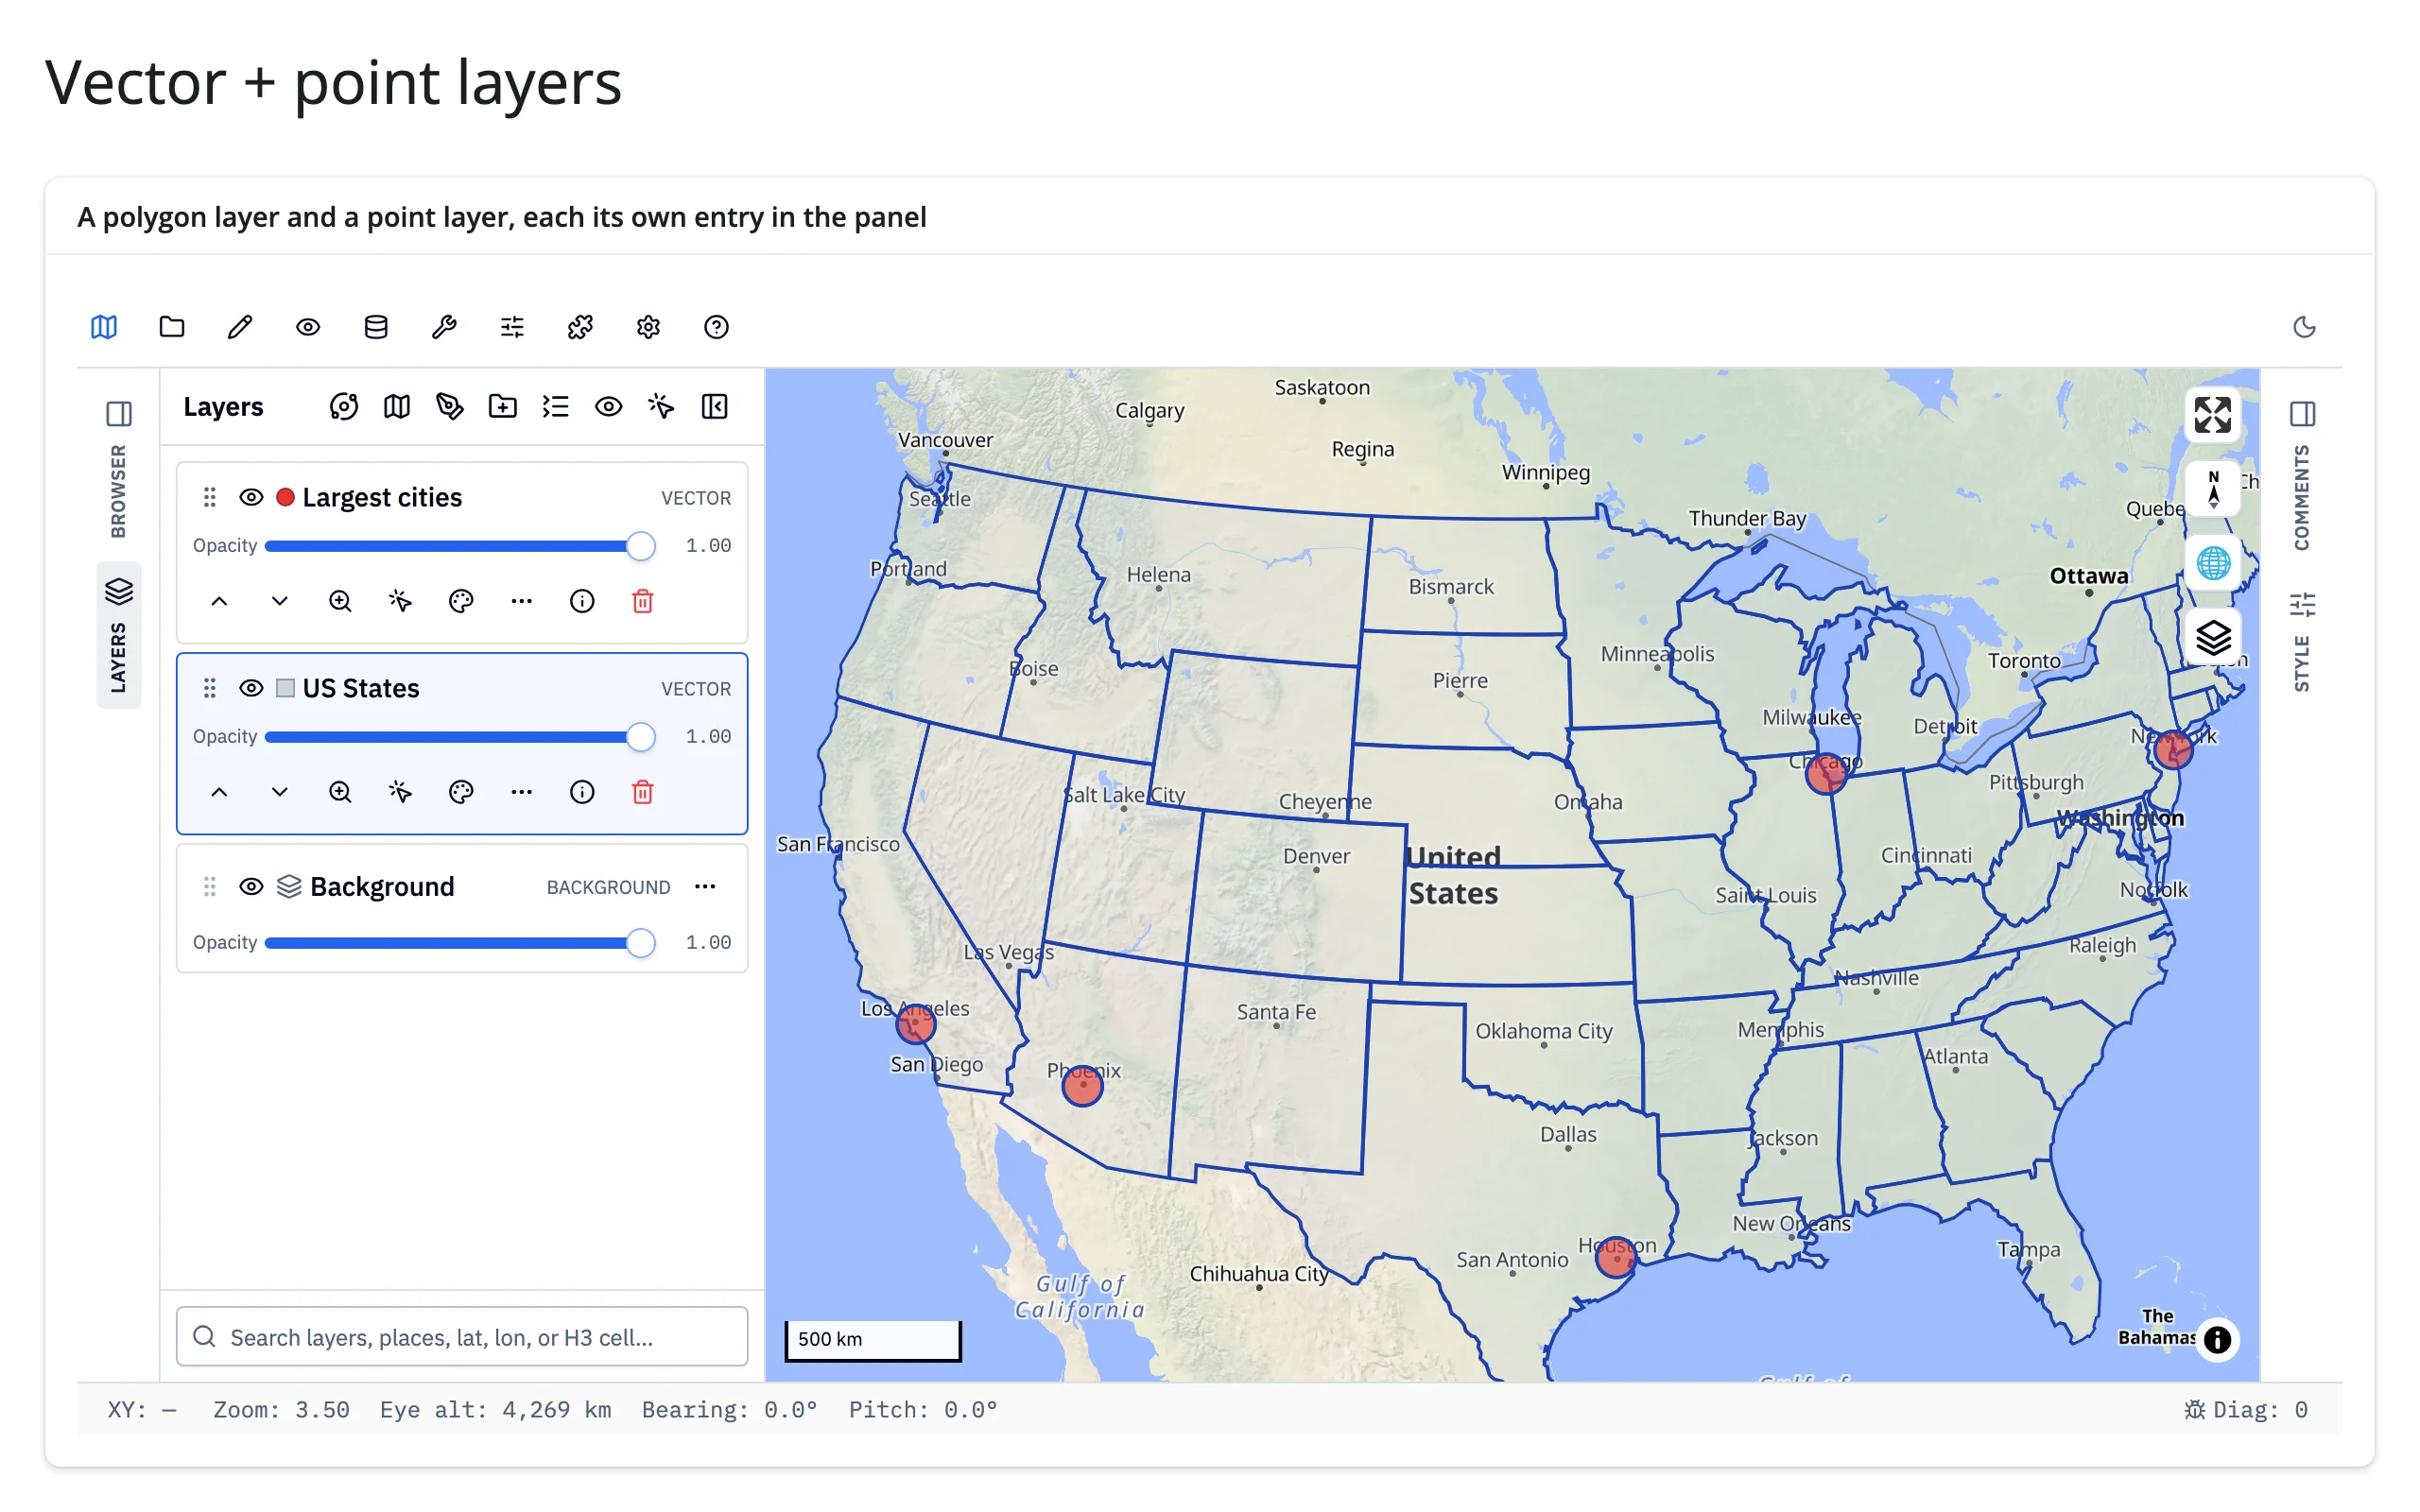
Style layers and configure popups from Python
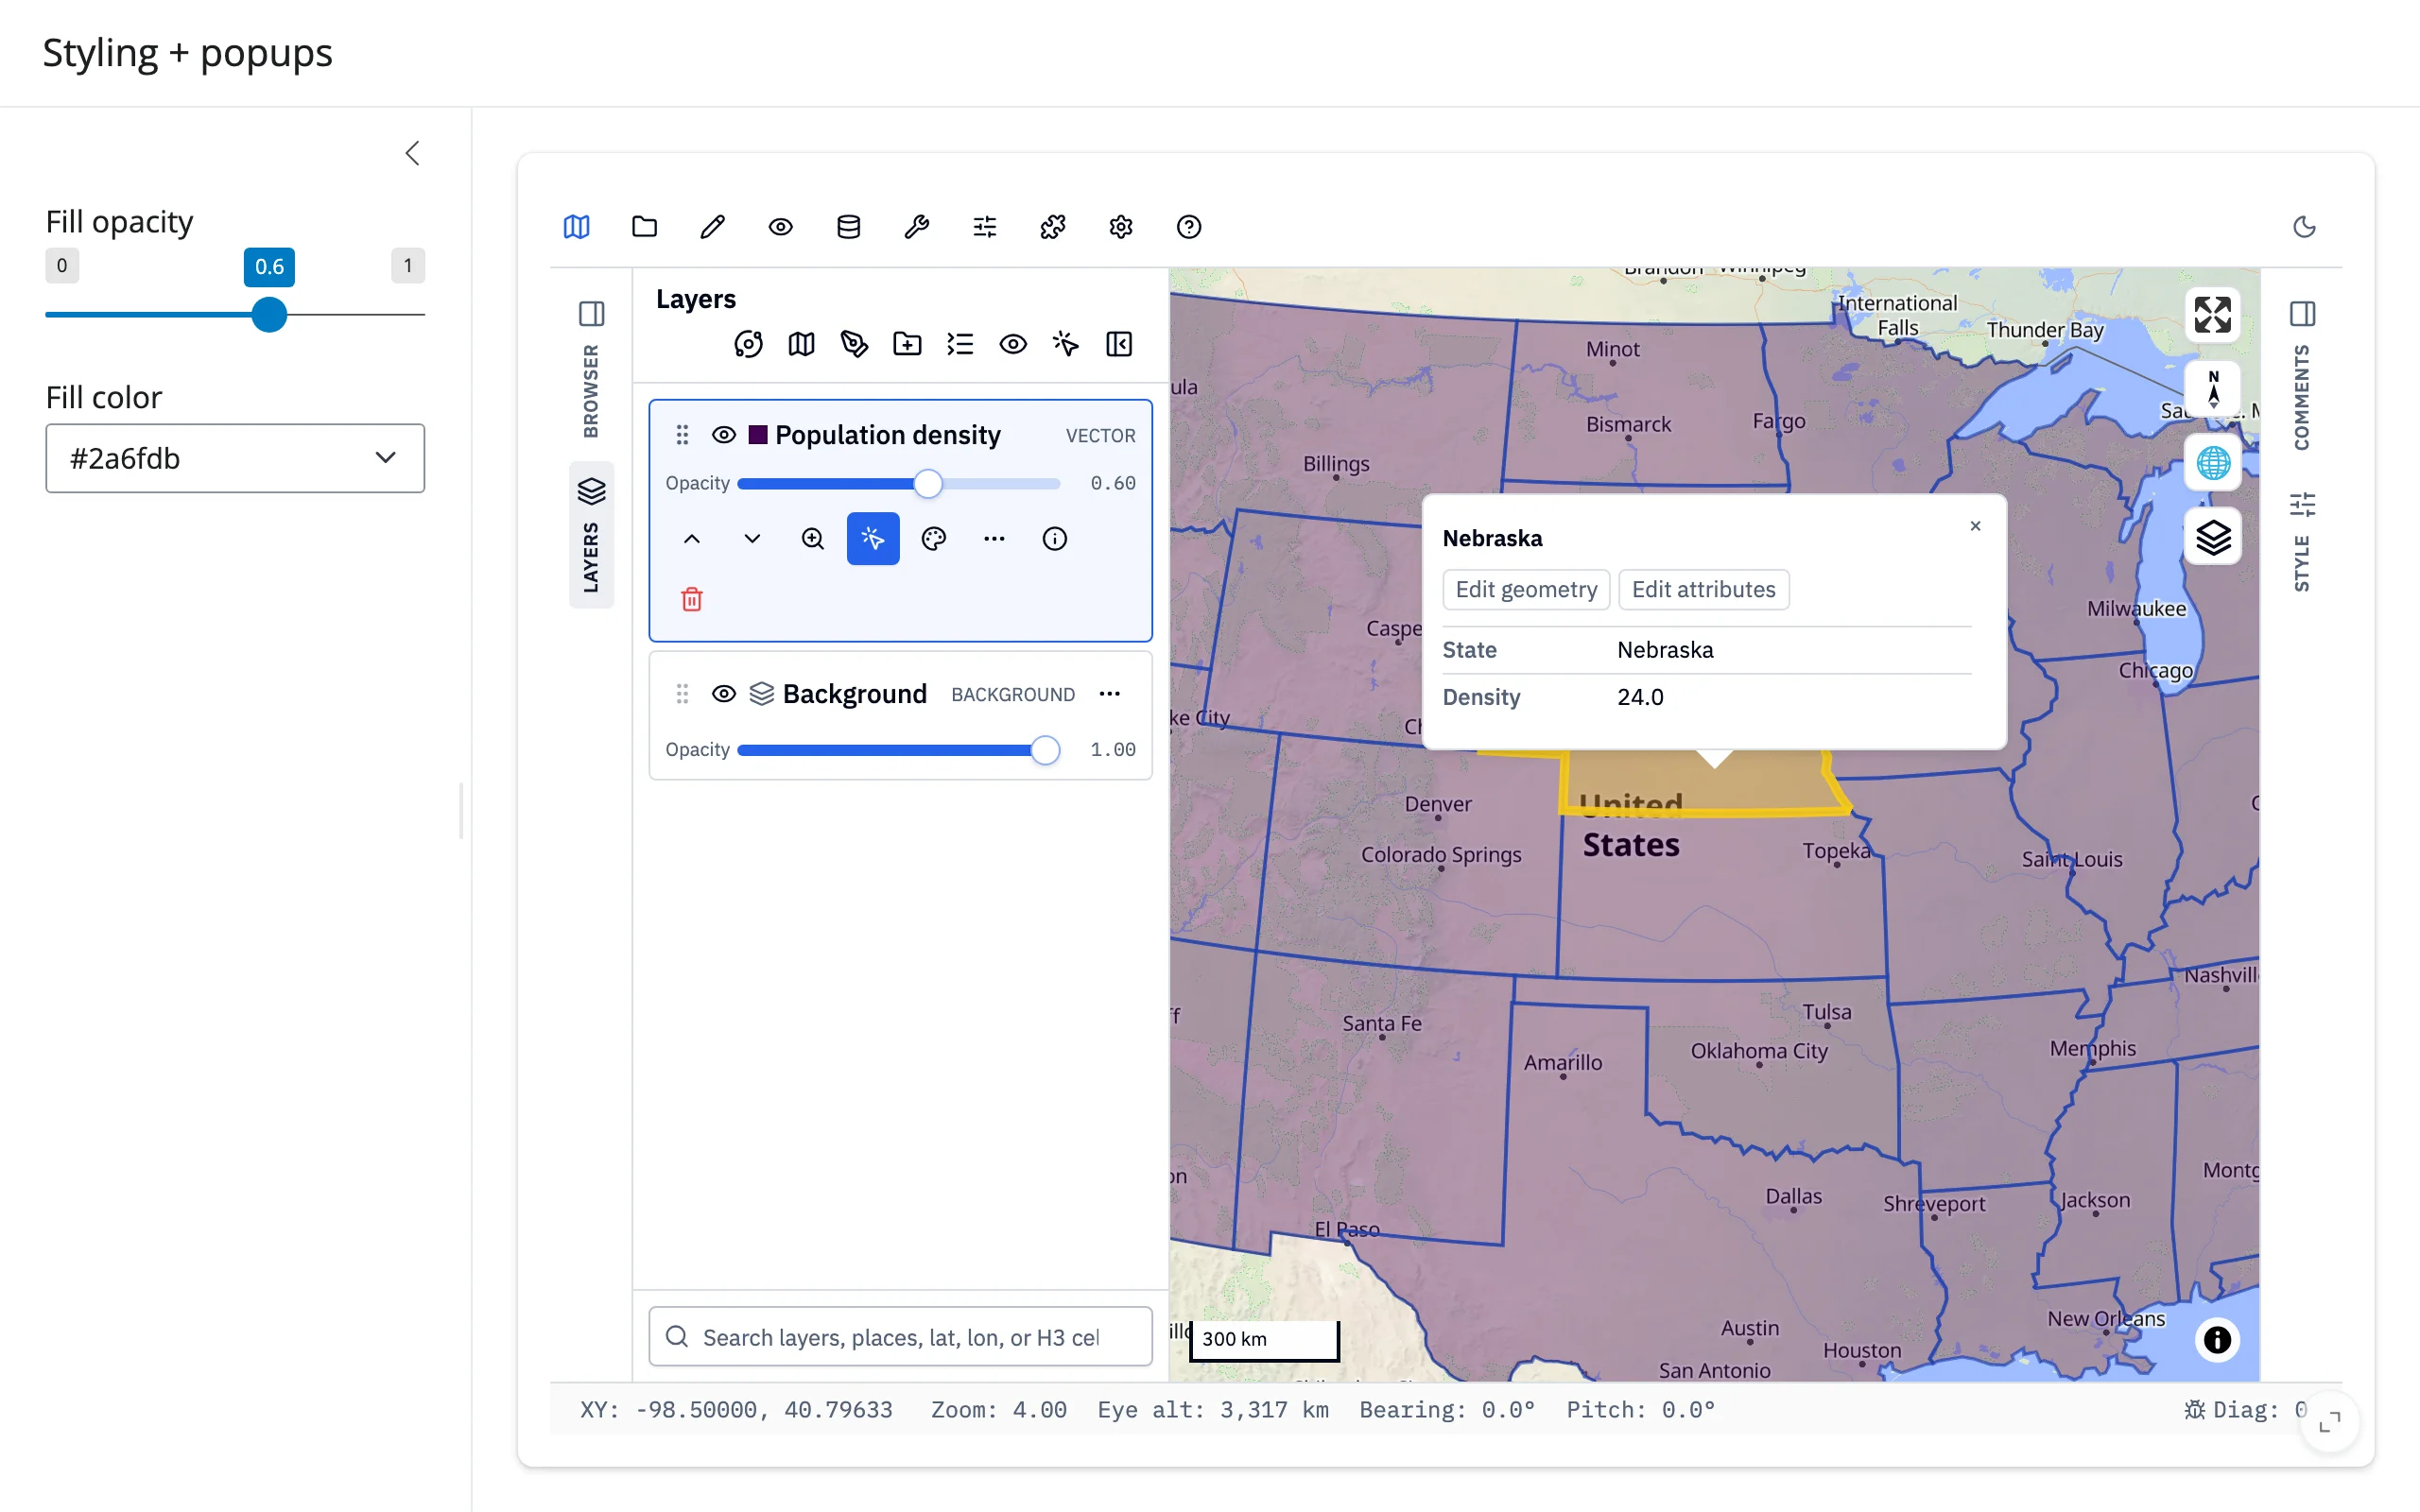
layer.opacity = ... and layer.set_style(**paint_overrides) restyle a layer in place. set_popup() picks which fields show in a layer’s click popup, with per-field labels, number formatting, and more; set_identify() arms the Identify tool so a plain click opens that popup (normally a user turns this on from the Layers panel).
    @render_geolibre
    def map():
        m = Map(center=(-98.5, 39.8), zoom=4)
        layer_id = m.add_choropleth(US_STATES, column="density", name="Population density")
        layer = m.get_layer(layer_id)
        # A click opens a popup with just these two fields, titled by name
        m.set_popup(
            layer,
            [
                {"field": "name", "label": "State"},
                {"field": "density", "label": "Density", "kind": "number", "decimals": 1},
            ],
            title="name",
            show_feature_id=False,
        )
        m.set_identify(layer)  # arm Identify so a click opens the popup
        return m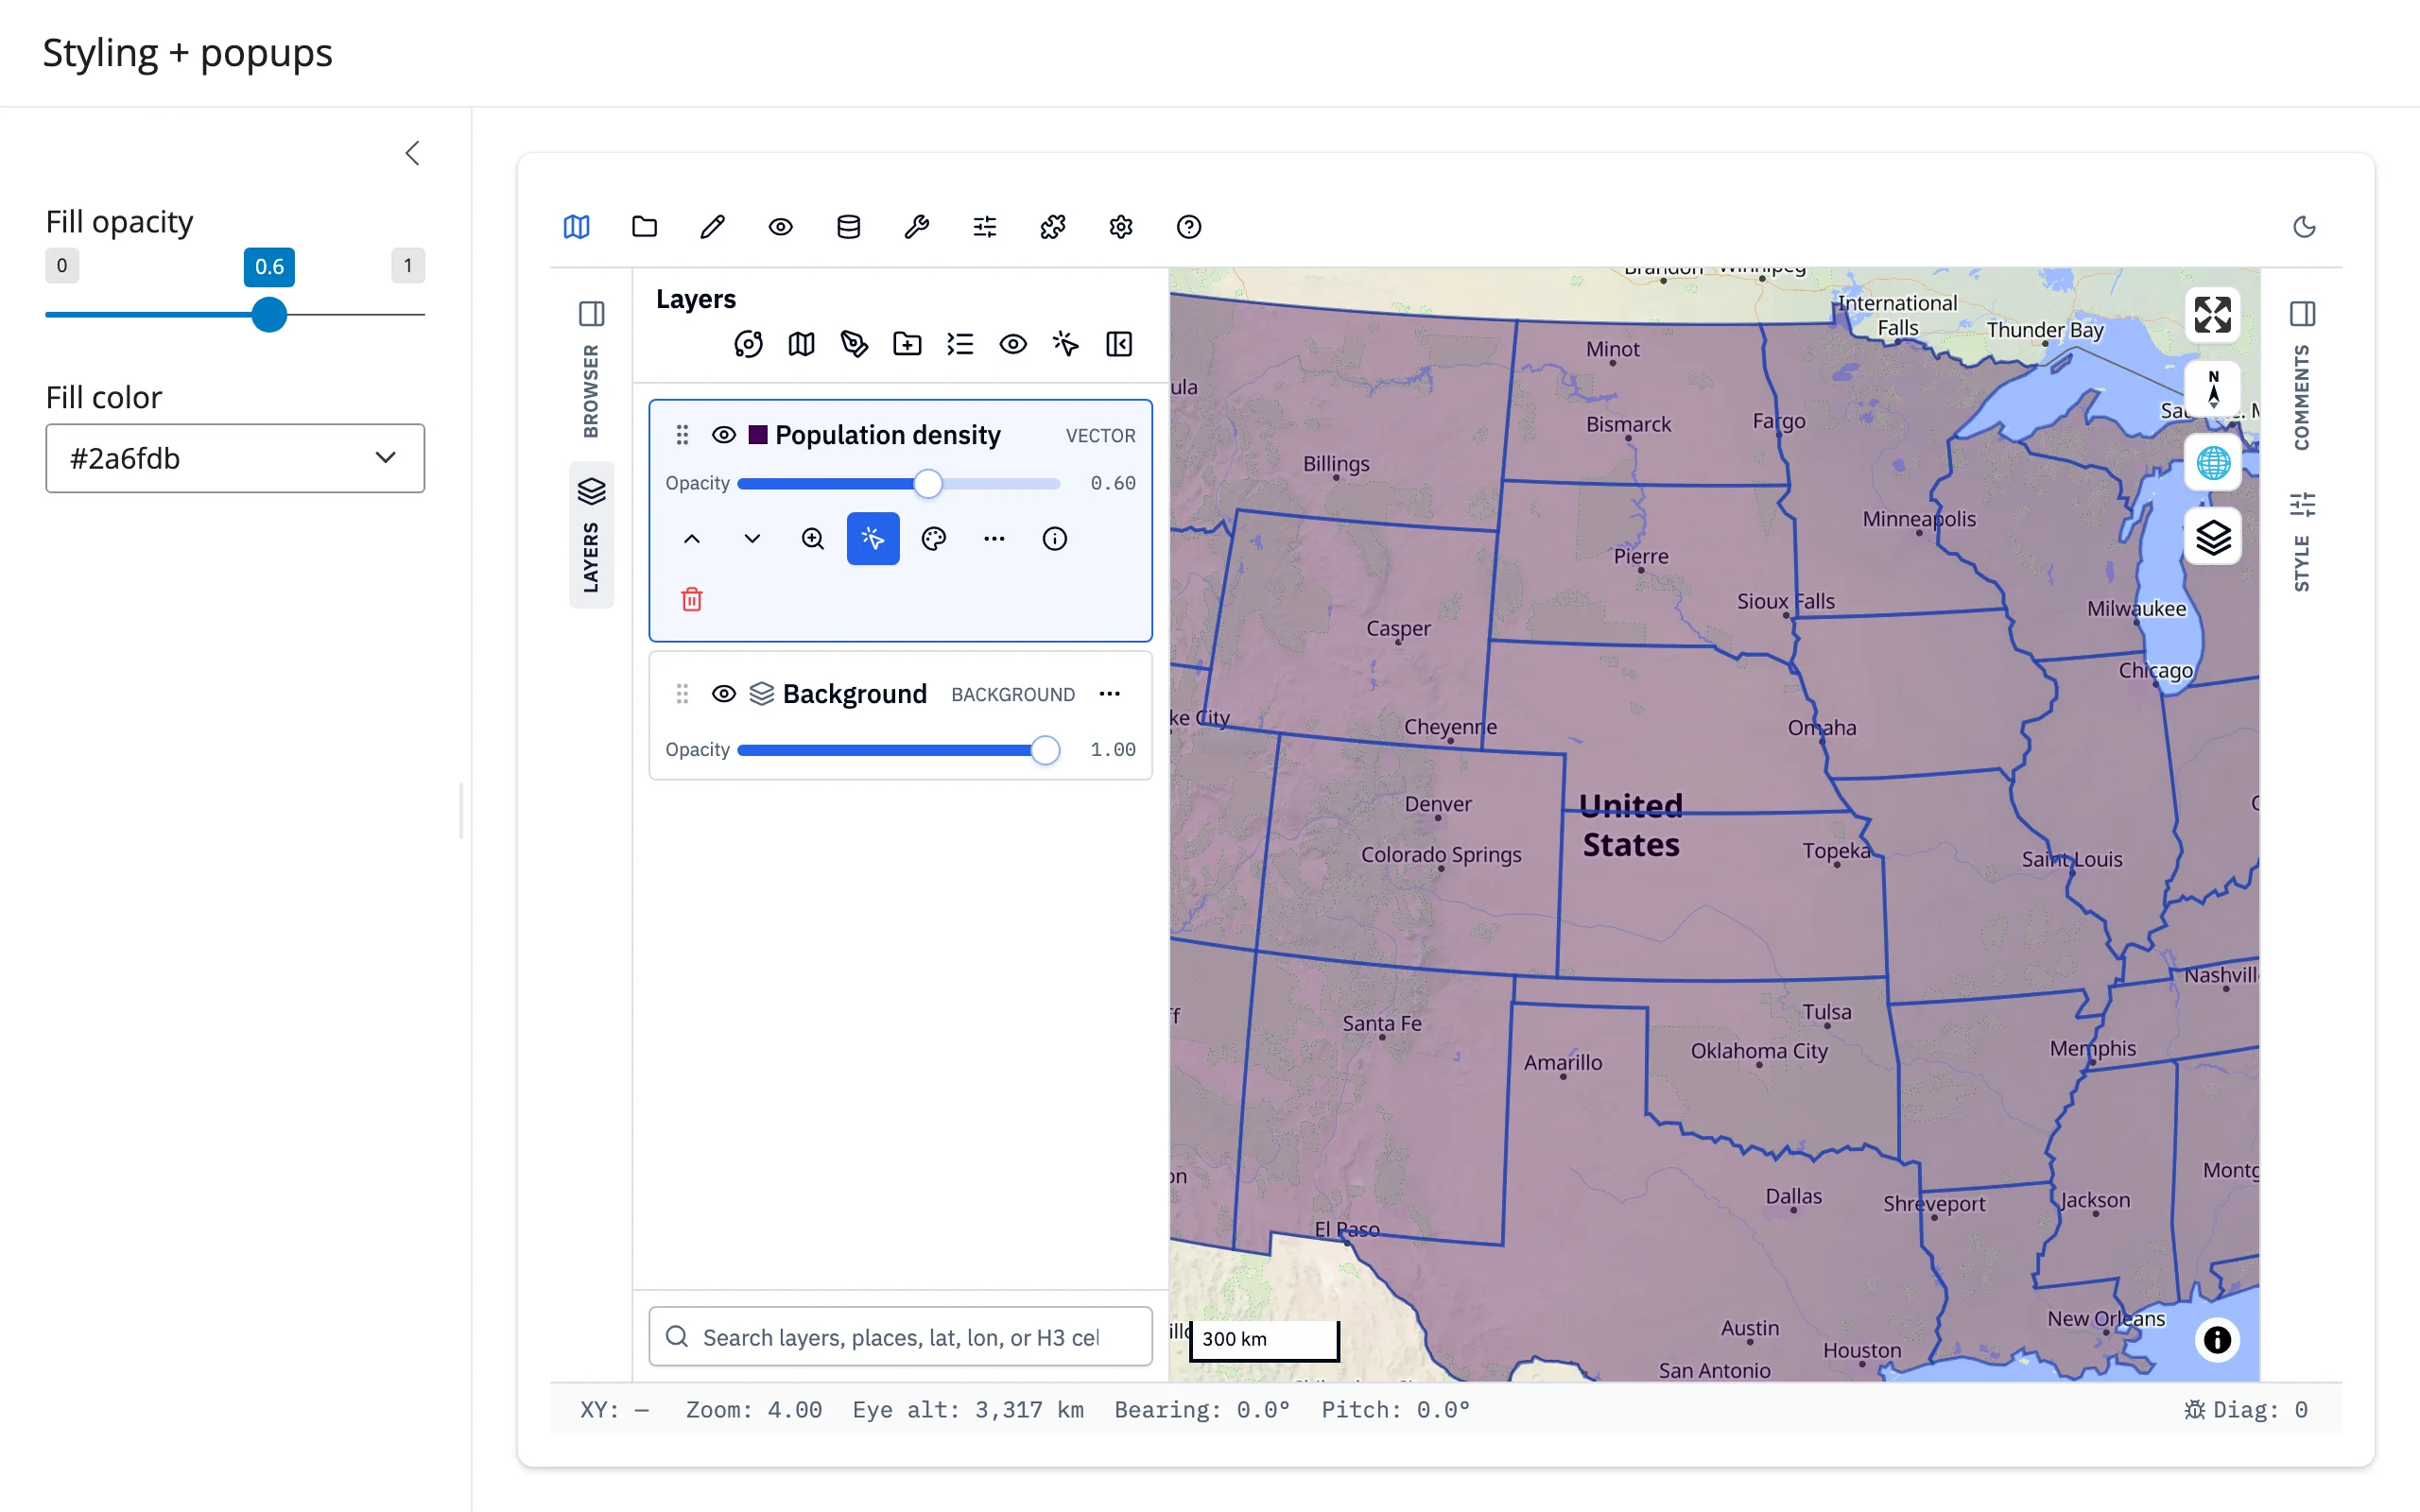
Export the current view as an image
to_image() asks the running app to render its current view to a PNG and returns the bytes. It’s a command method that waits for the app’s reply (see “Updating the widget from Python” below); its to_image_async() variant awaits that reply directly, which works here because a @render.download_button handler runs outside Shiny’s reactive flush.
        # to_image_async() awaits the app's reply, so it runs directly on
        # Shiny's event loop -- a download handler isn't part of the
        # reactive flush, so (unlike a reactive.effect) awaiting it here
        # doesn't block the reply from being delivered.
        @render.download_button(filename="map.png", label="Download PNG")
        async def snapshot():
            yield await map.widget.to_image_async()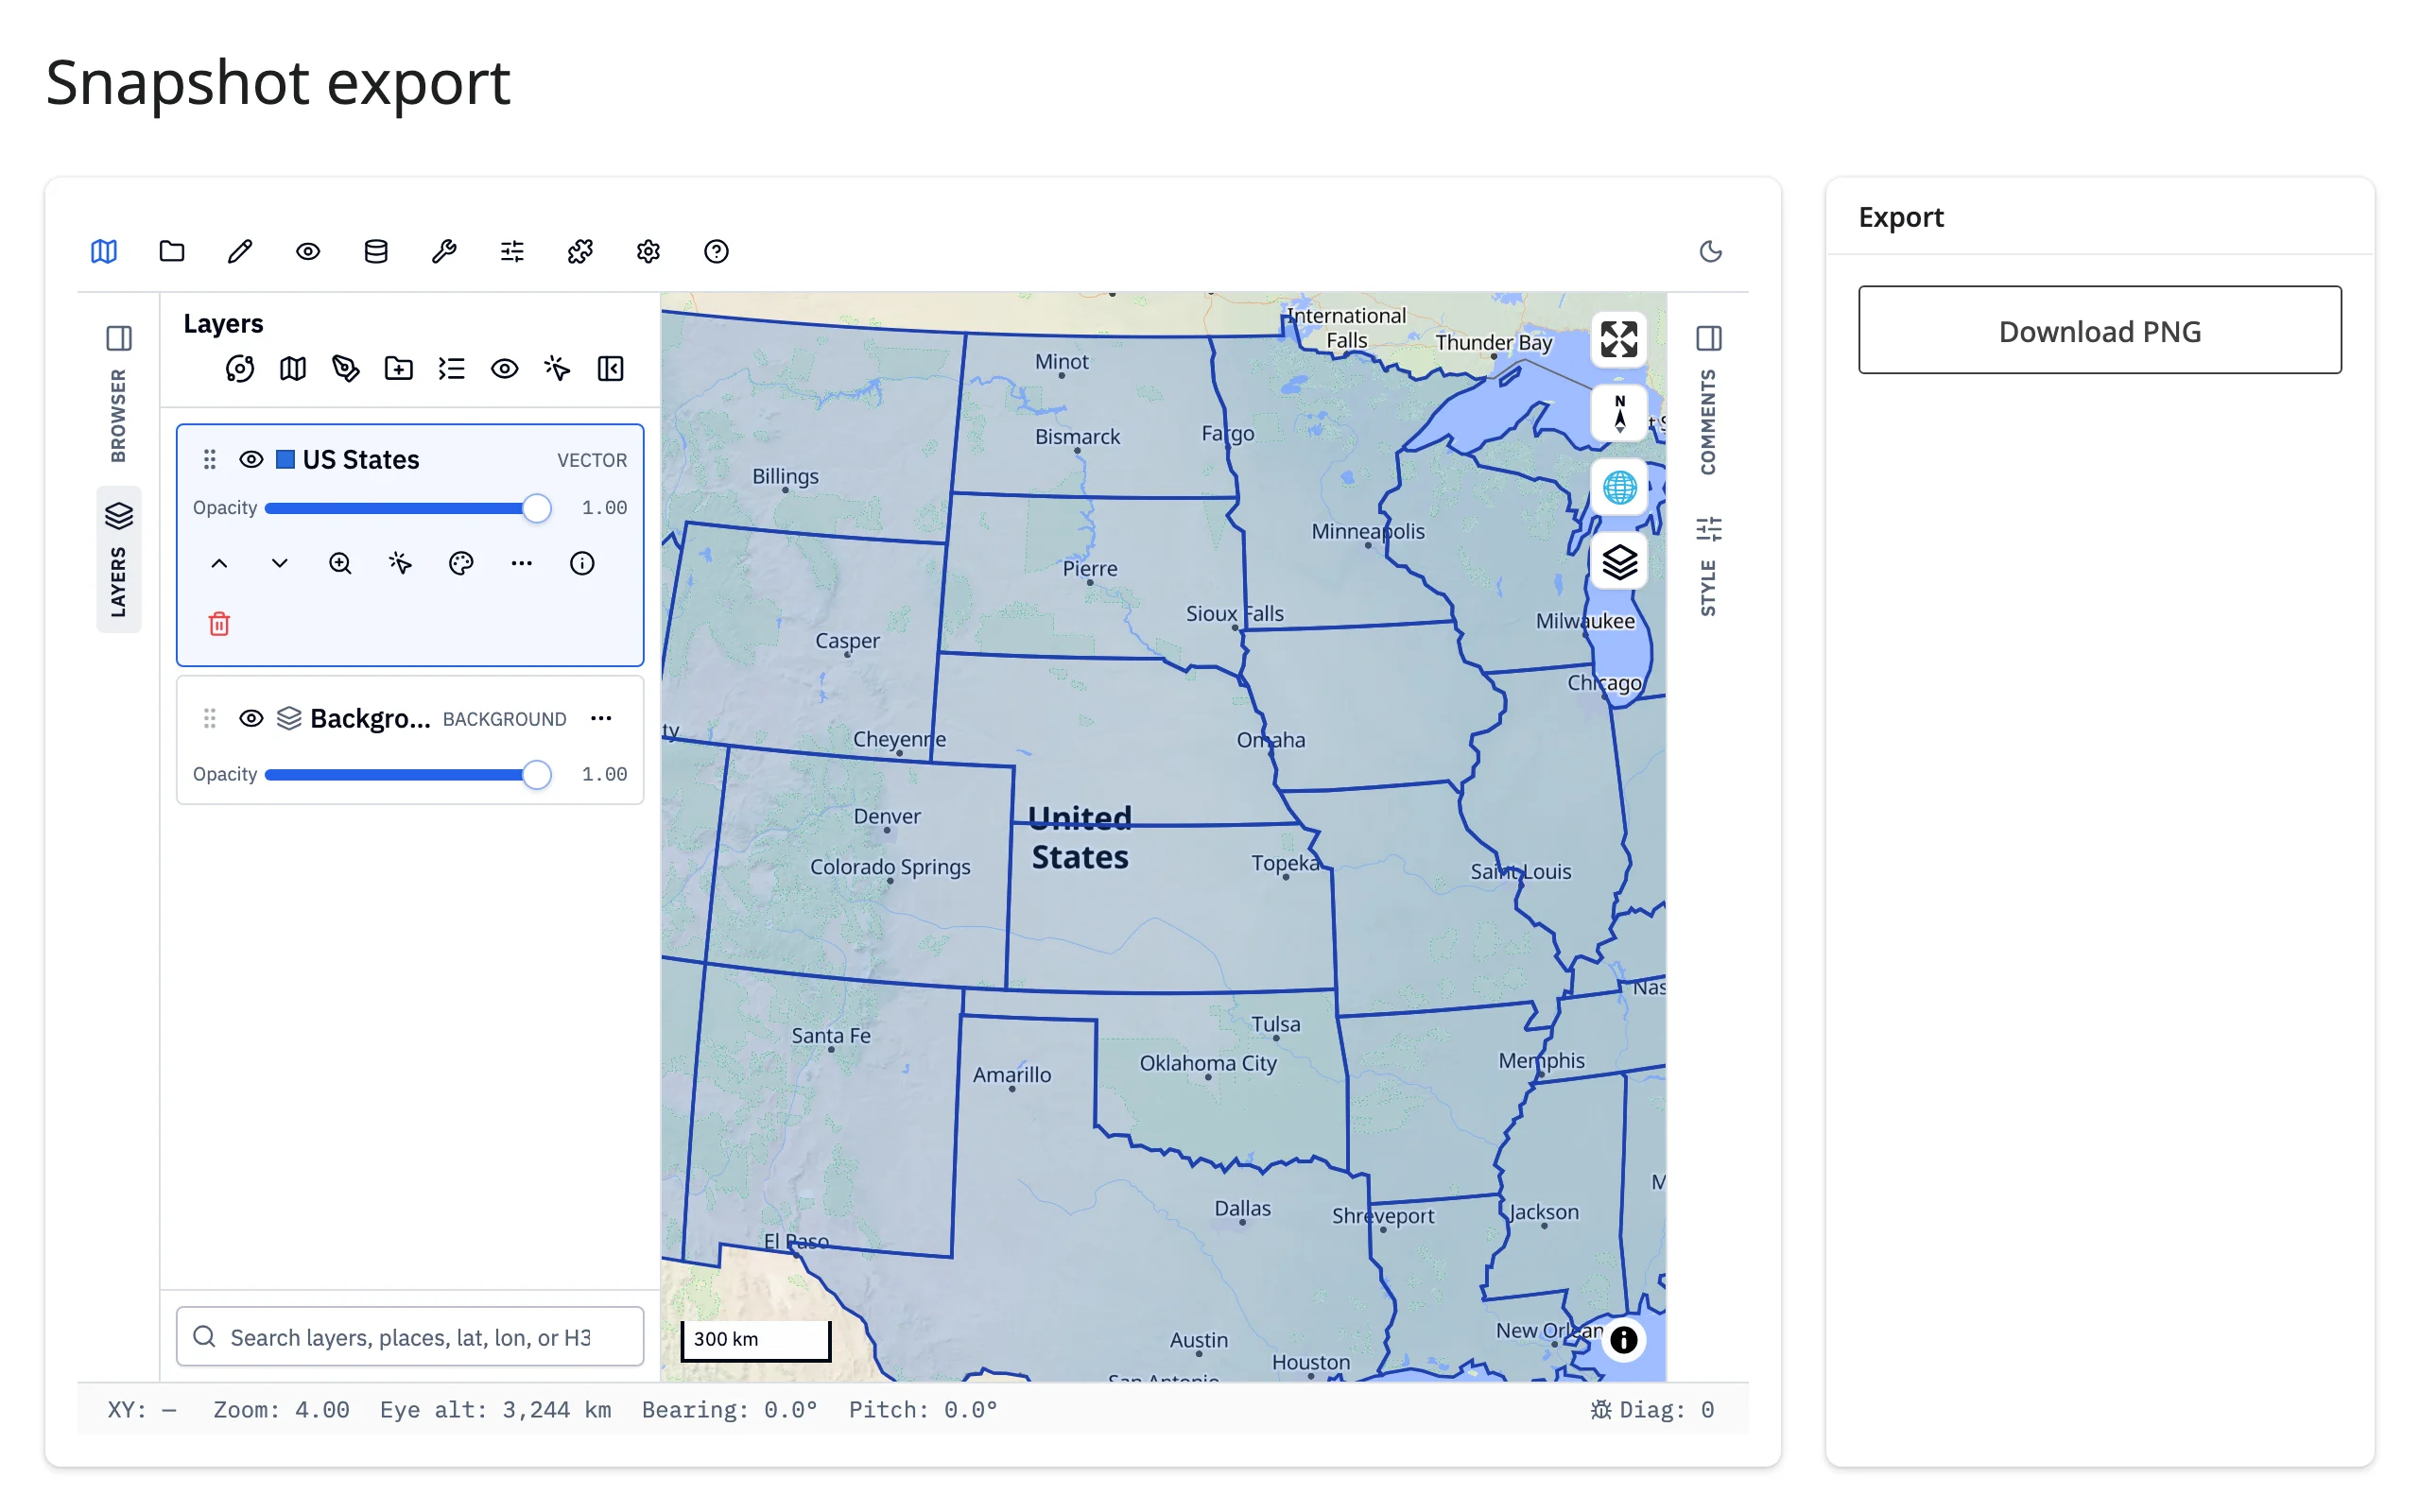
The toolset ships for free
add_legend() and show_control() reach into the app’s own Controls menu – bookmarks, search, a minimap, and the Measure panel (distance, area, and circle tools, with configurable units) – all built, styled, and already wired to the map.
    @render_geolibre
    def map():
        m = Map(center=(-98.5, 39.8), zoom=3.5)
        m.add_circle_markers(
            [(lng, lat) for _, lng, lat in CITIES],
            name="Major cities",
            radius=10,
            fillColor="#e3342f",
        )
        m.add_legend("Cities", legend_dict={"Population > 1M": "#e3342f"})
        m.show_control("measure", collapsed=False, distance_unit="miles")
        return m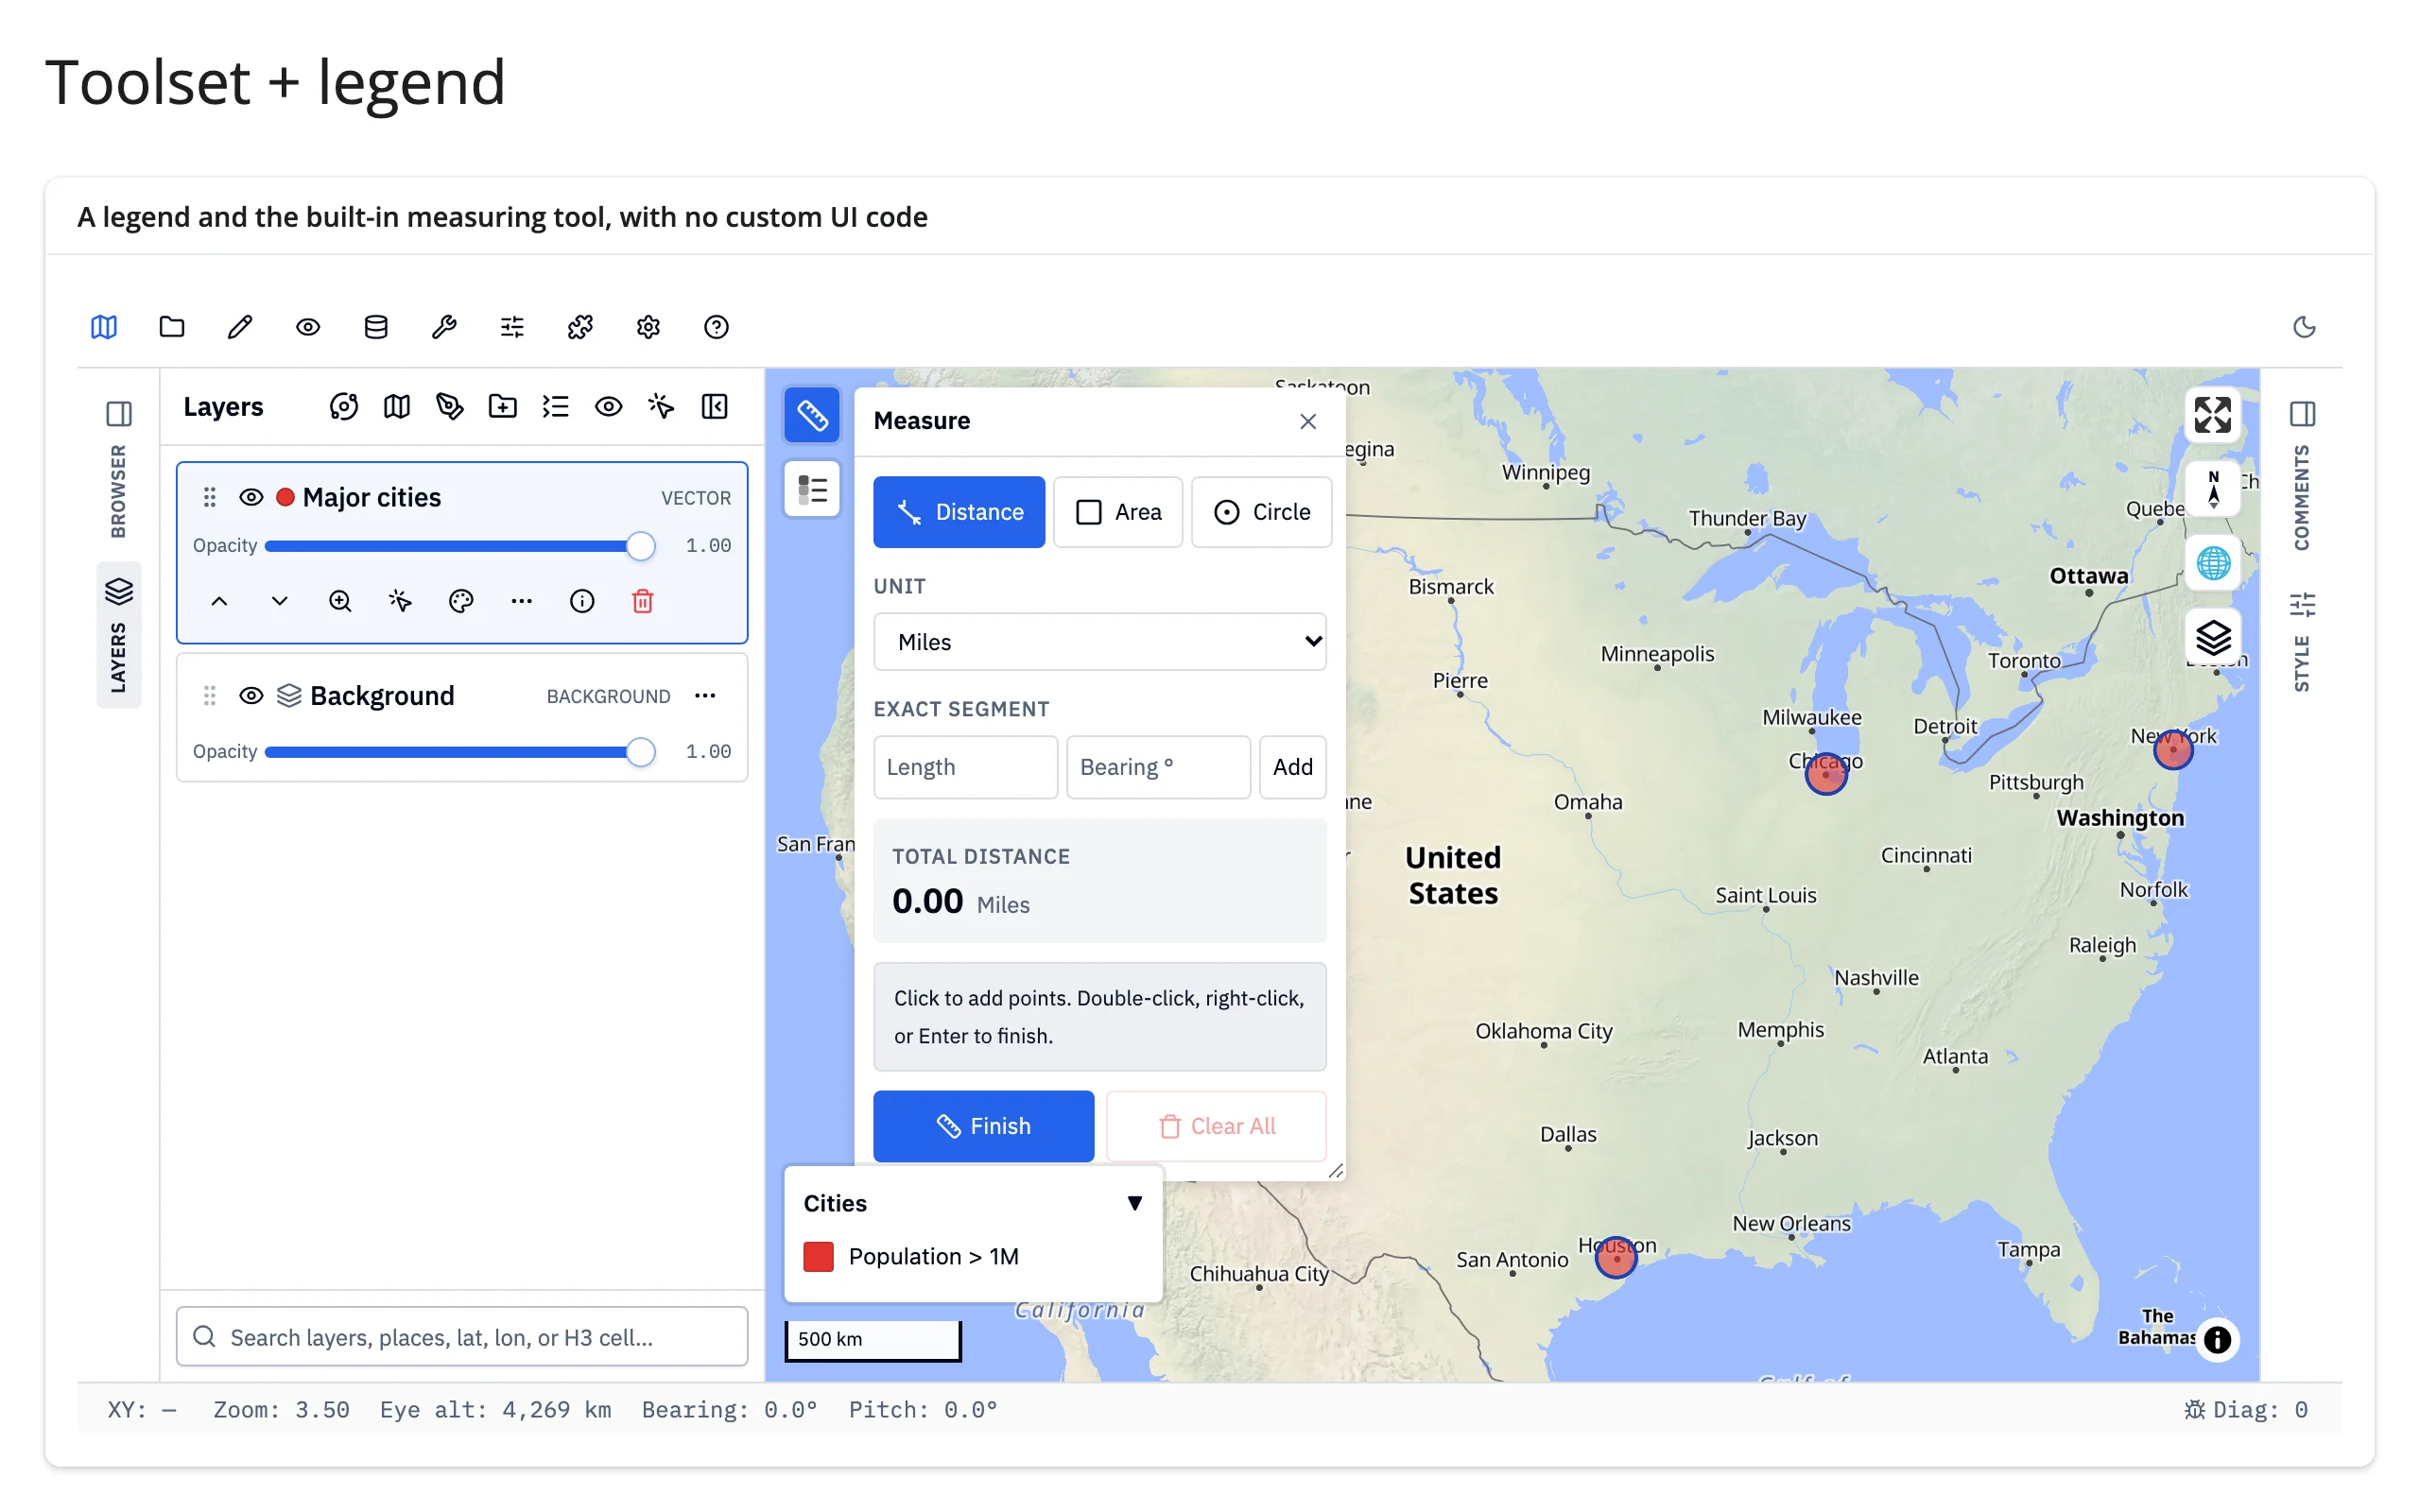
Reacting to user interaction
GeoLibre has no reactive accessors – no map.clicked() method you call from a render function. Instead there are two tiers, both built on geolibre.Map’s own API: event callbacks you register once, and .read("project") on the output – GeoLibre’s own synced project trait.
Event callbacks
on_click(), on_selection_change(), and on_layer_change() register a plain Python callback, called with an event dict whenever the user clicks the map, changes the selected feature, or adds/removes a layer. Register them inside the render function (they need the freshly created widget) and have the callback set a reactive.value, exactly like wiring up an ipywidgets trait observer.
With set_identify() armed, a map click’s event dict carries a "features" list with each clicked feature’s properties and geometry – not just the lngLat you’d get otherwise – which is enough to build a detail card with no extra round trip.
        @render_geolibre
        def map():
            m = Map(center=(-98.5, 39.8), zoom=4)
            layer_id = m.add_choropleth(US_STATES, column="density", name="Population density")
            m.set_identify(layer_id)  # include feature properties in click events
            m.on_click(lambda e: last_click.set(e))
            return m

    with ui.card():
        ui.card_header("Clicked state")

        @render.ui
        def detail():
            event = req(last_click())
            features = event.get("features") or []
            if not features:
                return core_ui.value_box("No state here", "click land to select one")
            props = features[0]["properties"]
            return core_ui.value_box(props["name"], f"{props['density']:.1f} people/sq mi")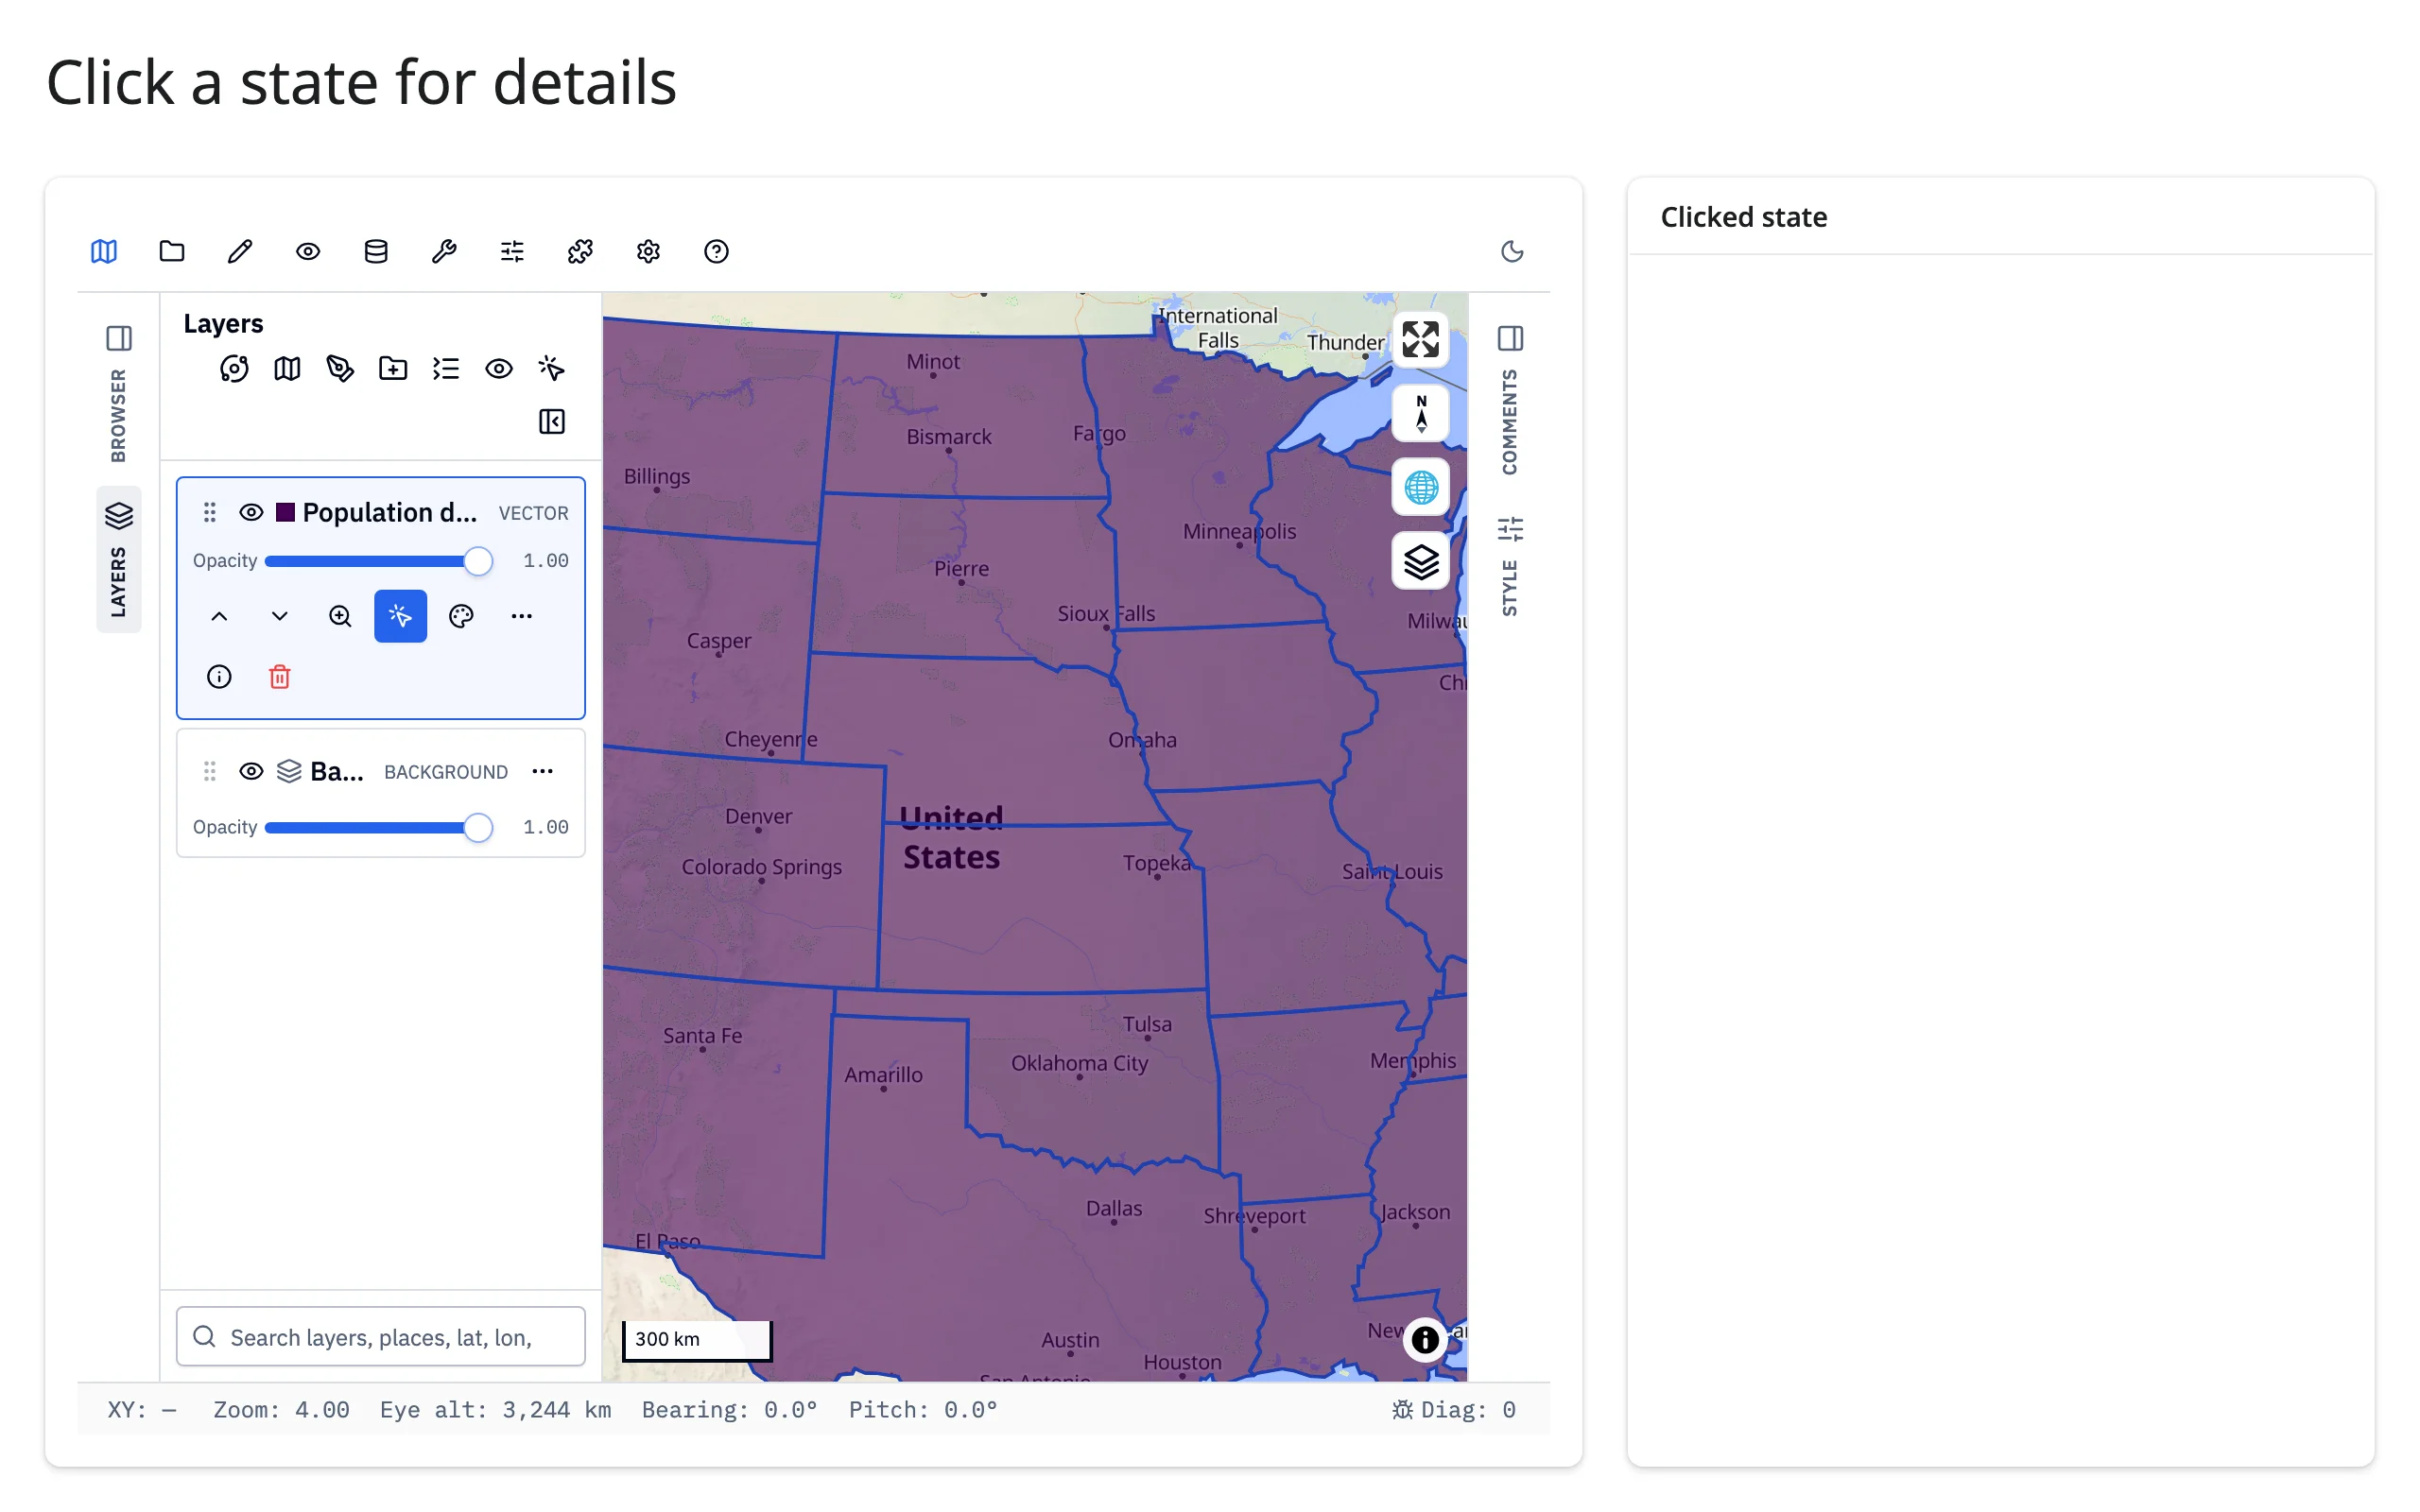
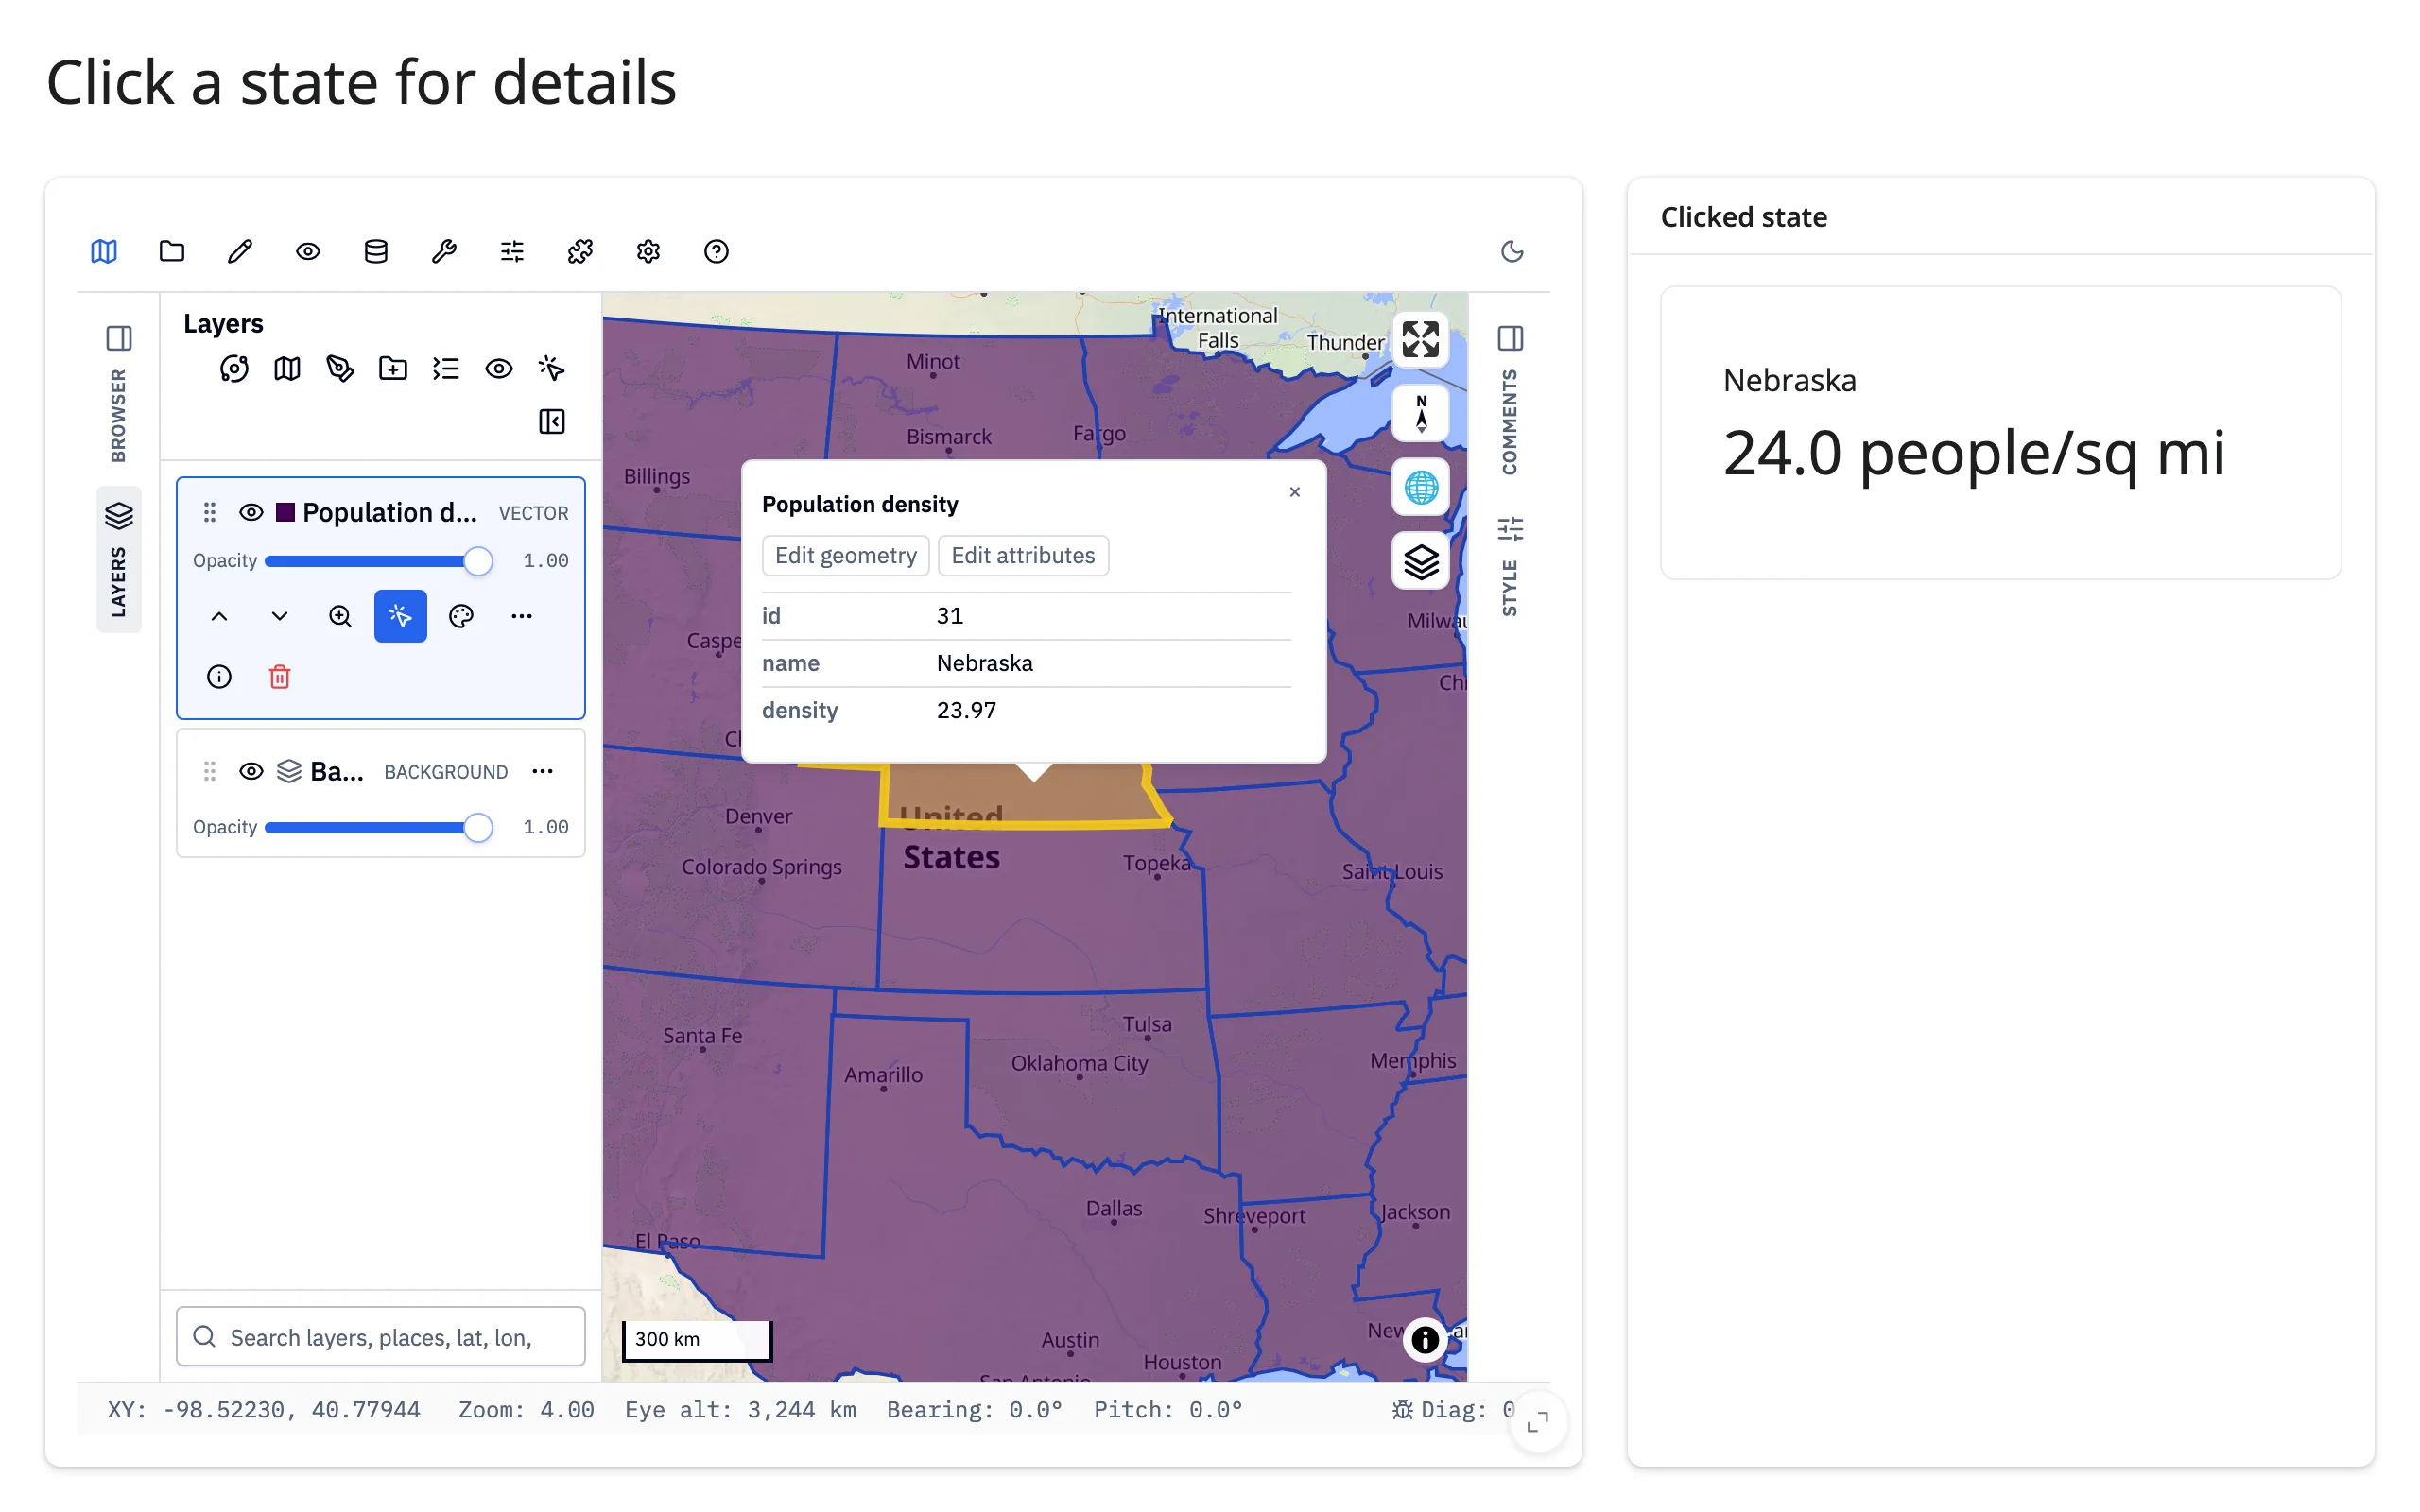
on_click()’s event is {"lngLat": [lng, lat], "features": [...]} – features is only present (and only populated) for layers Identify is armed on; it’s [] for a click that misses every identifiable layer, never None. There’s no built-in rate limit on these callbacks: a reactive.value set from one fires the consuming output on every call.
Beyond callbacks: .read()
map.read("project") gives you GeoLibre’s whole live document: the current view (project["mapView"]: center, zoom, bearing, pitch, and – once the browser’s first state sync has landed, a moment after the app boots – bbox), every layer’s name and style, basemap settings, and more. It invalidates on every pan and zoom, because the whole project re-syncs, not just the view.
        @render.code
        def view_info():
            # Invalidates on every pan and zoom -- the whole project re-syncs,
            # not just the view, so keep downstream consumers cheap (see
            # "Rate limiting" below). "bbox" is filled in once the browser's
            # first sync lands (a moment after the app boots), so treat it as
            # optional rather than indexing it directly.
            project = map.read("project")
            view = project["mapView"]
            bbox = view.get("bbox")
            return json.dumps(
                {
                    "center": [round(c, 2) for c in view["center"]],
                    "zoom": round(view["zoom"], 2),
                    "bbox": [round(b, 2) for b in bbox] if bbox else None,
                    "layers": [layer["name"] for layer in project["layers"]],
                },
                indent=2,
            )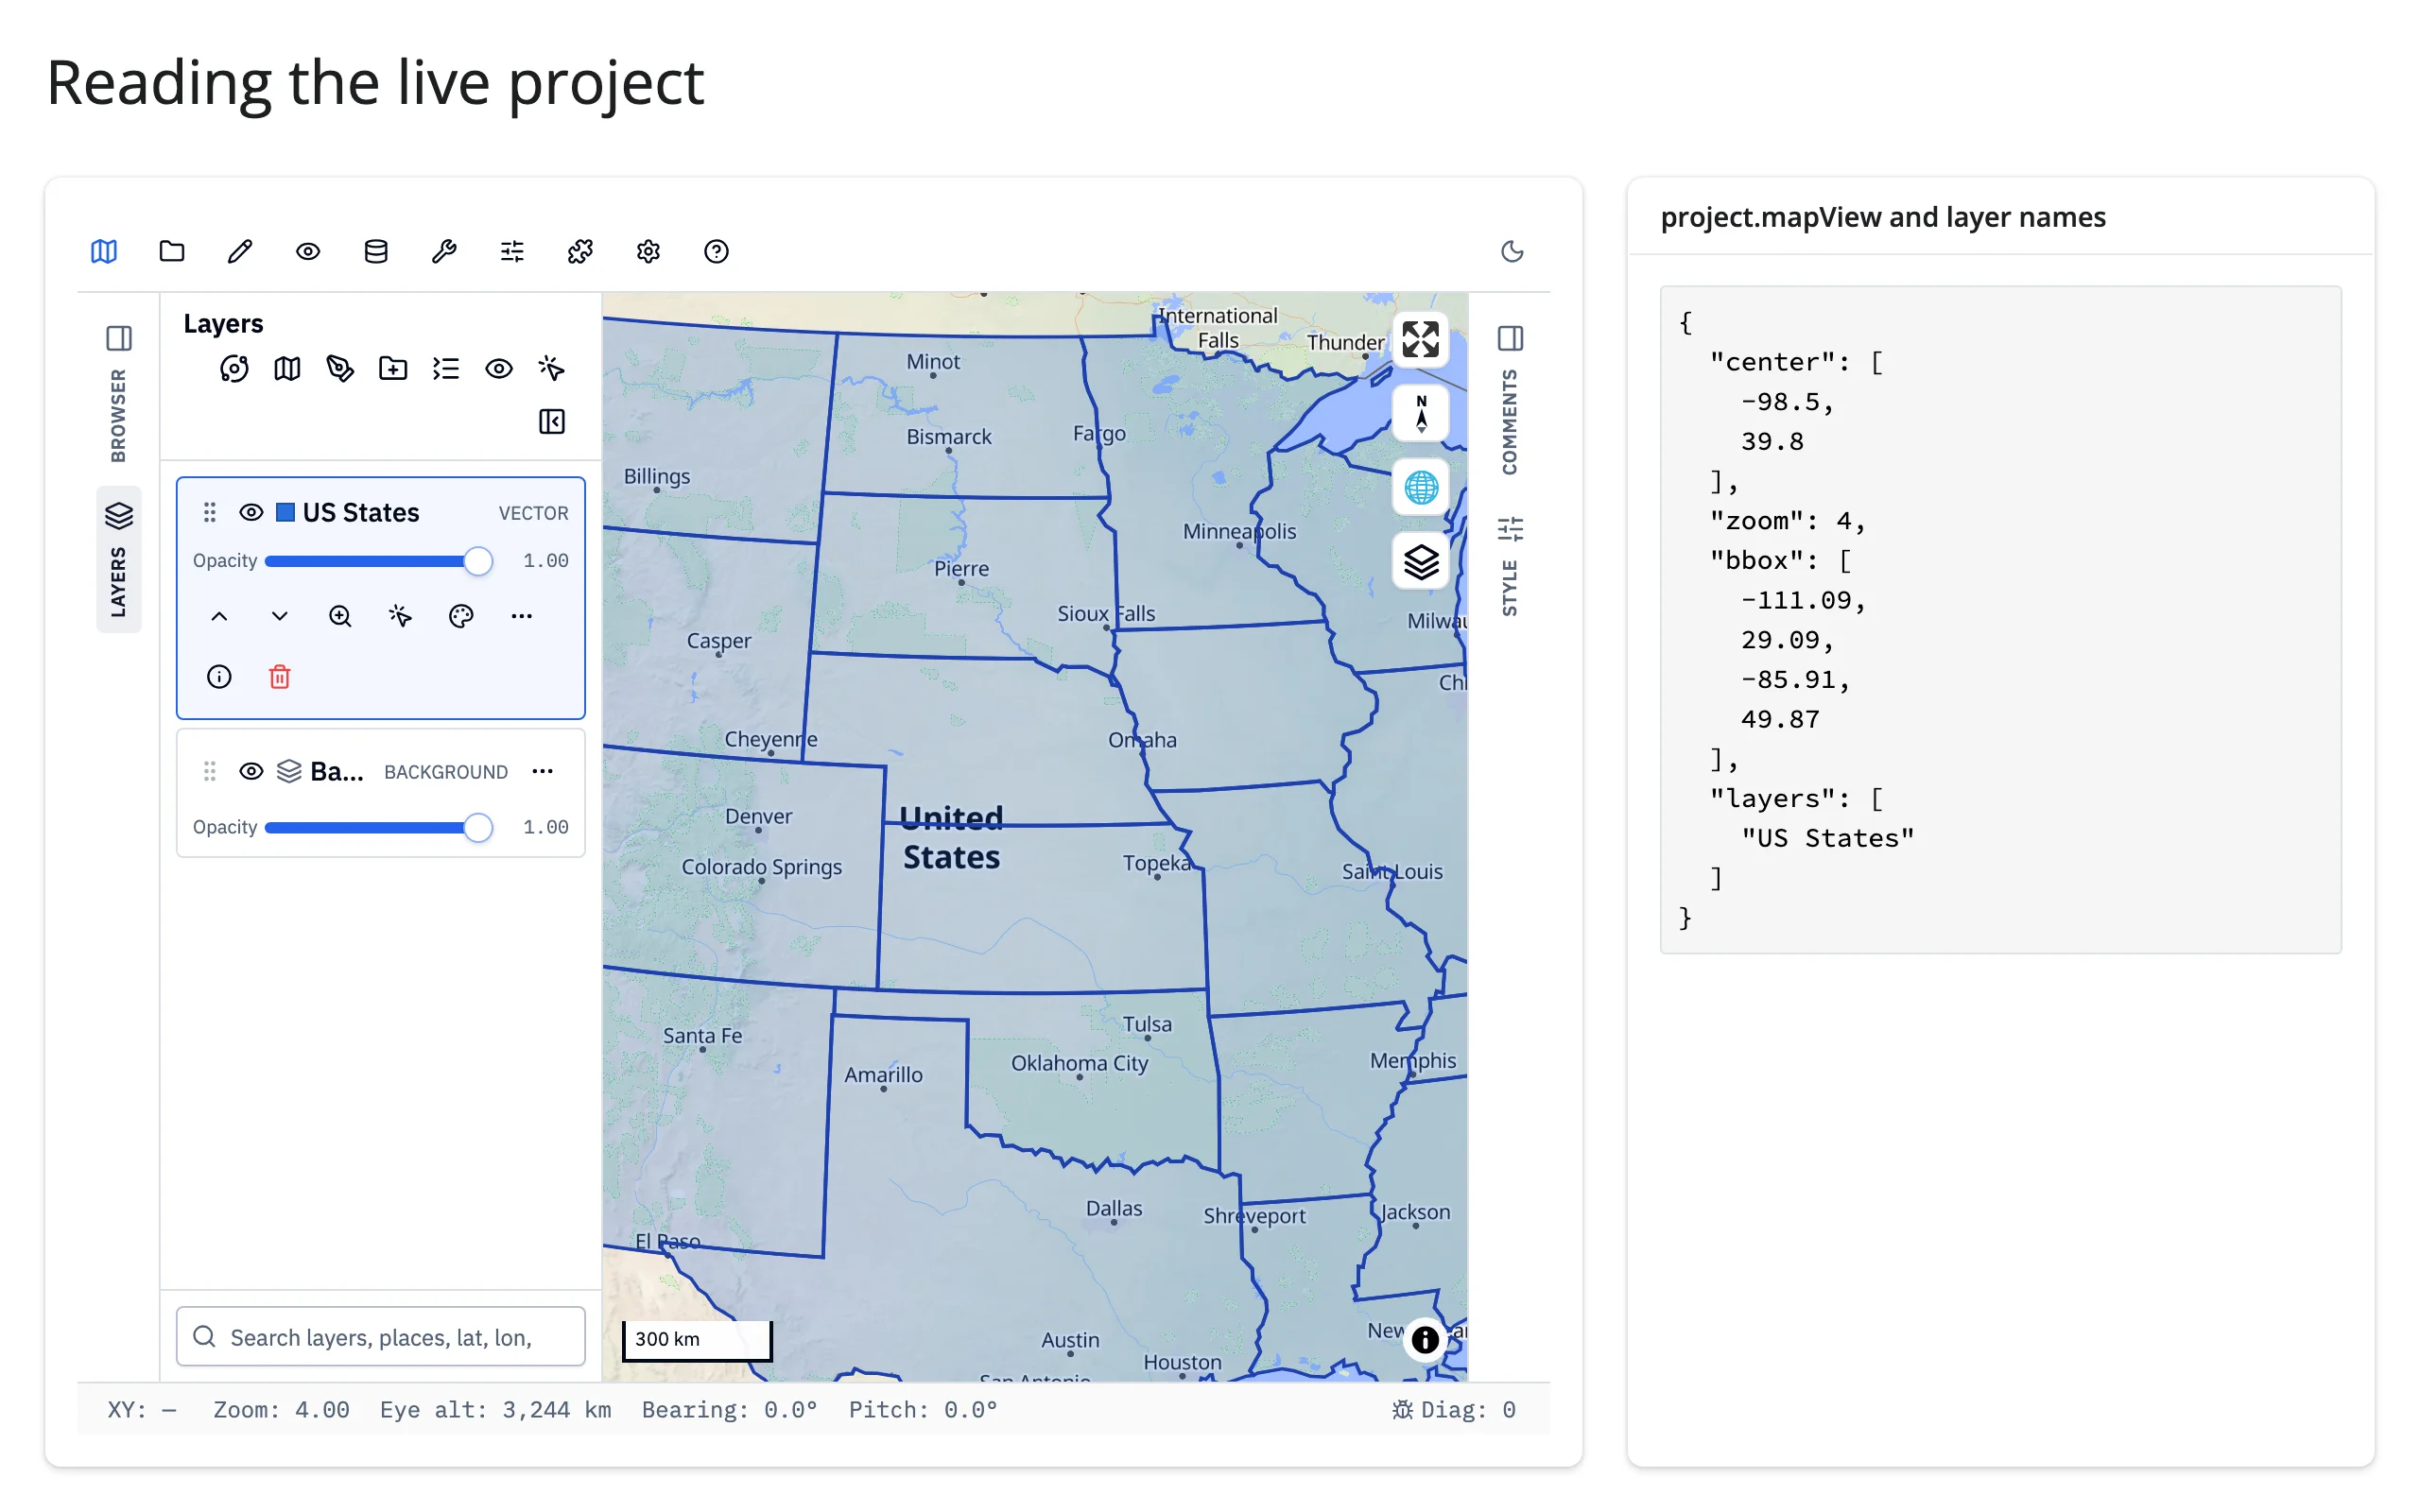
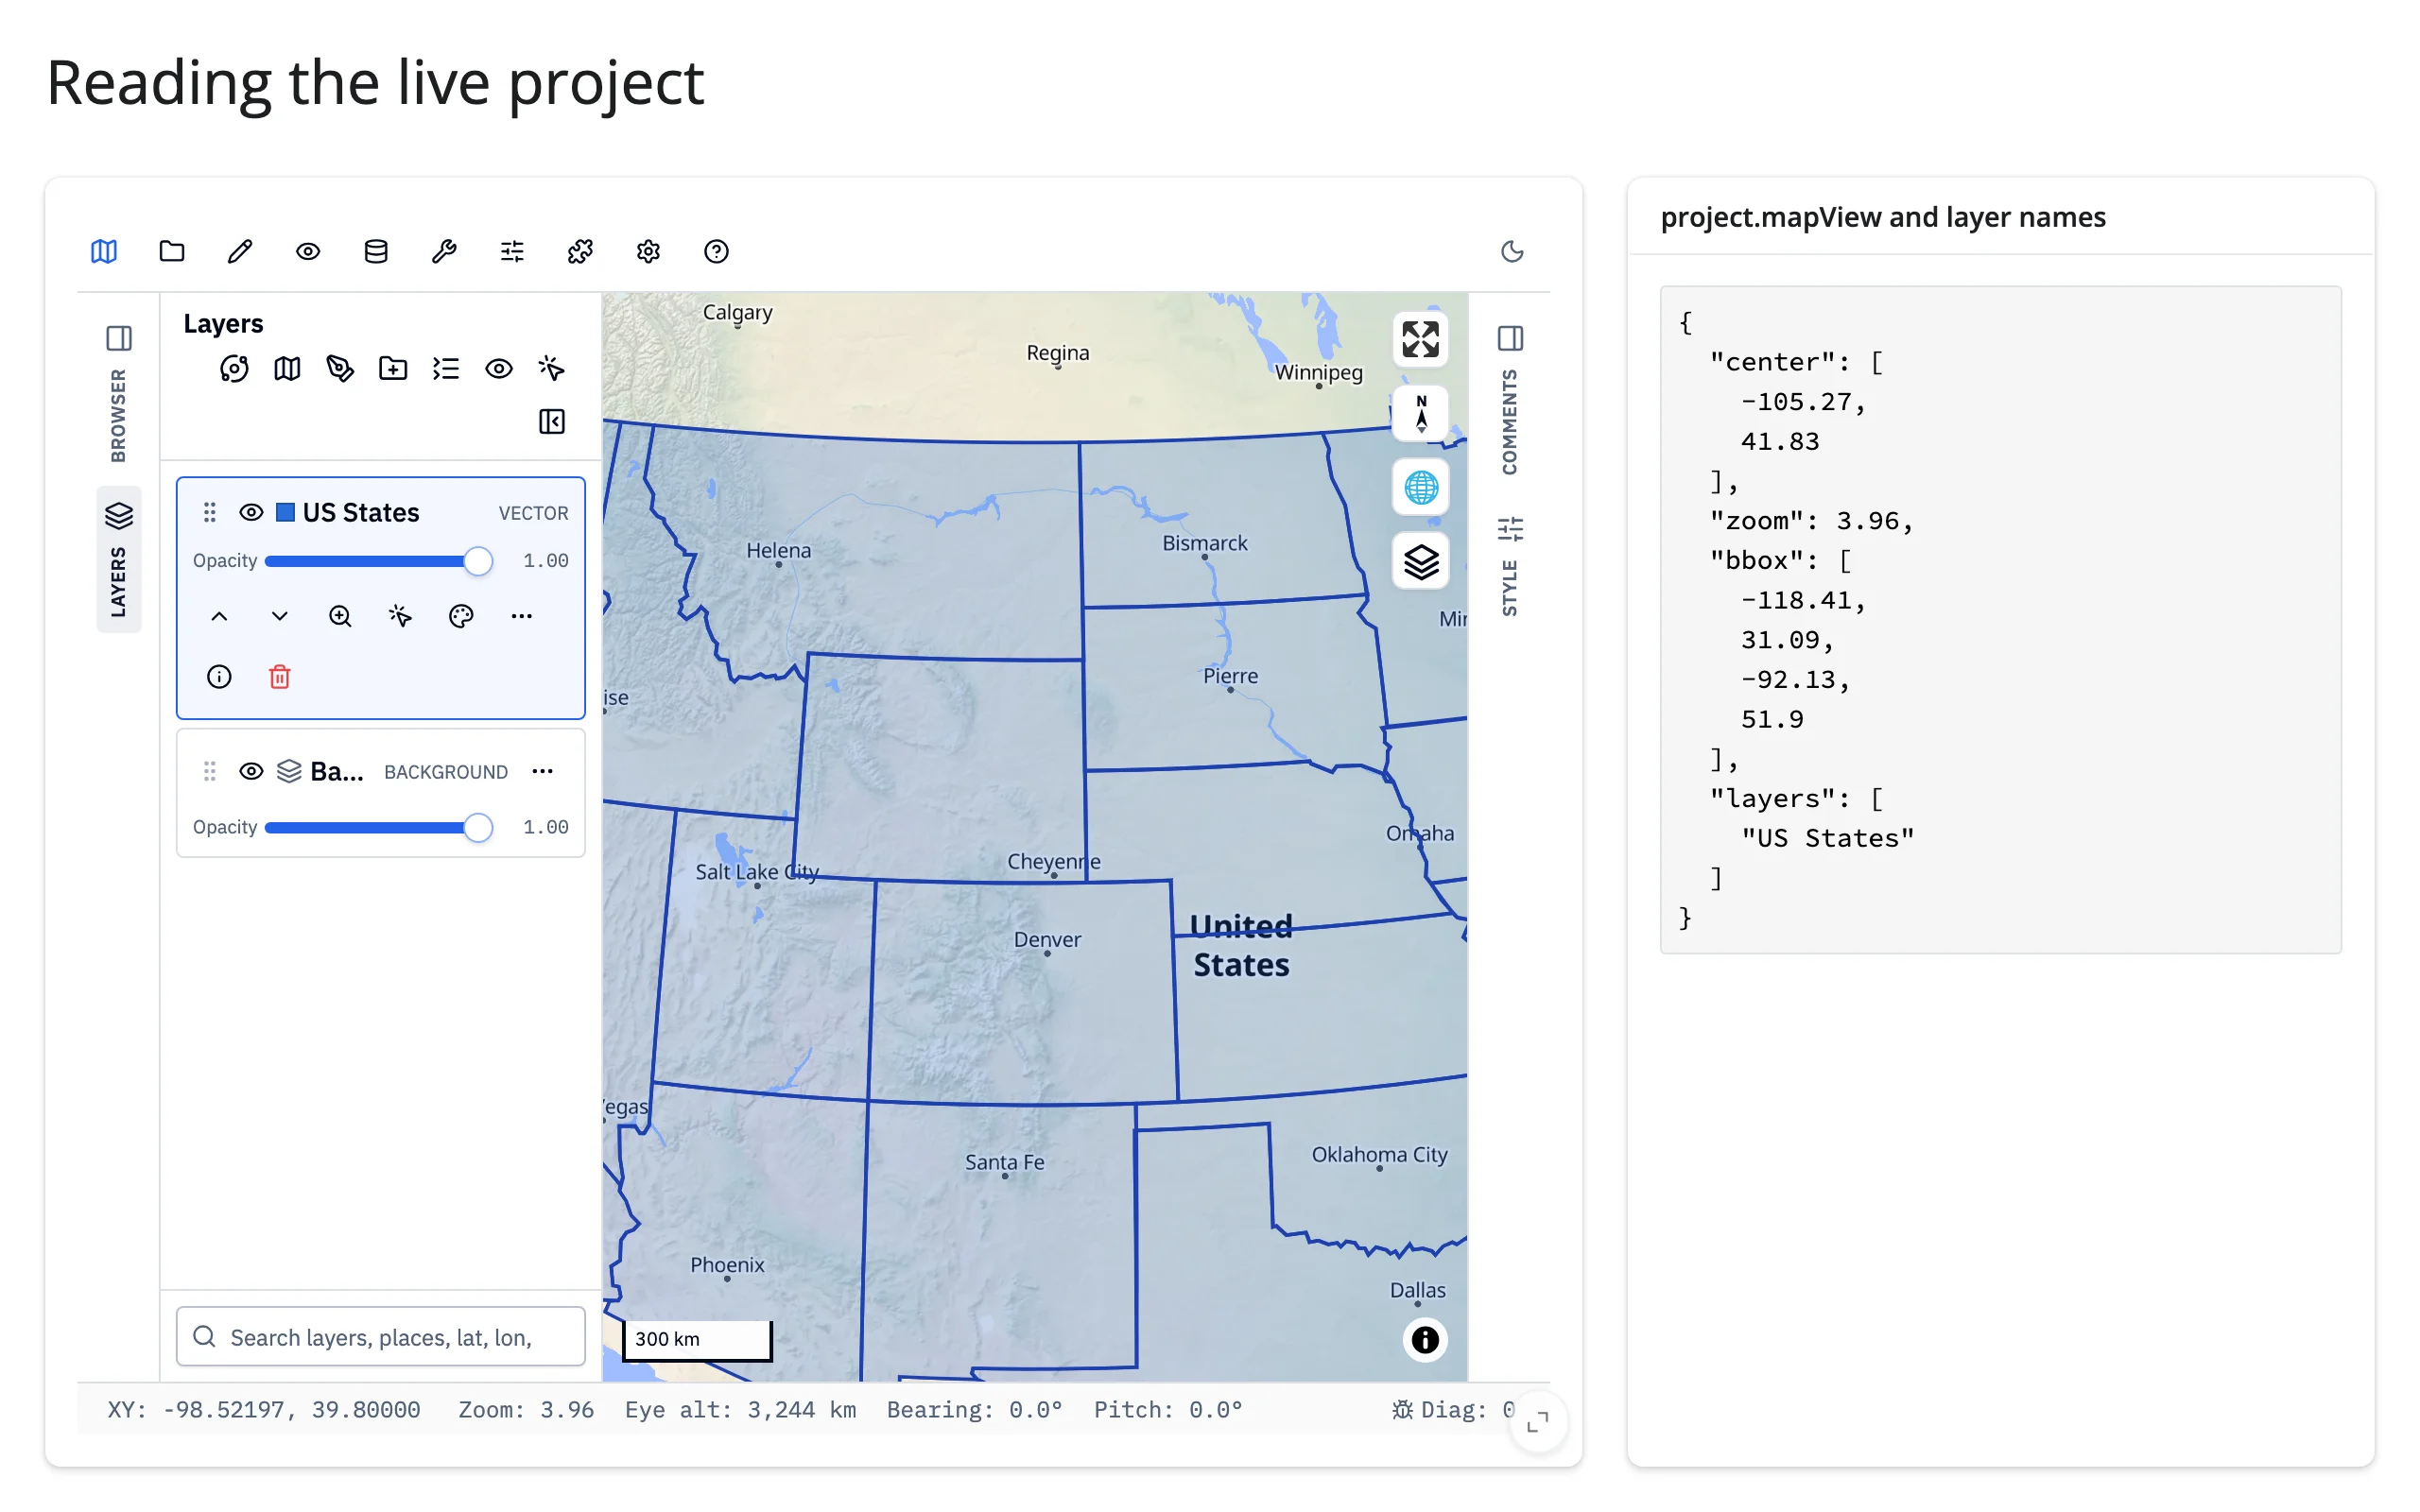
Worth calling out: on the very first render, before the browser has echoed anything back, project["mapView"] has center/zoom/bearing/pitch but not yet bbox – read it with .get(), or req() it, rather than indexing it directly (see Gotchas).
Rate limiting
There’s no accessor-level rate_policy/rate_delay on render_geolibre (those only exist on renderers that declare accessors). map.read("project") is unthrottled, and because it invalidates on every pan/zoom frame-ish event with the entire project payload (including inlined layer data), a consumer that does real work – a chart recompute, a database query – can fall behind during a drag. Prefer the event callbacks for high-frequency interactions, and if you must react to project continuously, debounce it yourself (e.g. with a small reactive.poll() or a manual timer) rather than assuming GeoLibre throttles it for you.
Updating the widget from Python
GeoLibre’s API splits cleanly into two kinds of methods, and only one of them is safe to call directly from a Shiny reactive context.
Project mutations are instant, in-place trait updates. add_geojson()/add_vector()/add_cog()/etc., set_center()/set_zoom()/fit_project_bounds(), and layer styling (layer.opacity = ..., layer.set_style()) all edit the map’s synced project document and sync to the browser on the next flush – call them from a @reactive.effect like any other trait write.
# set_center() mutates the project trait and syncs to the browser -- no
# re-render, so zoom, added layers, and styling are untouched.
@reactive.effect
def _():
    lng, lat = CITIES[input.city()]
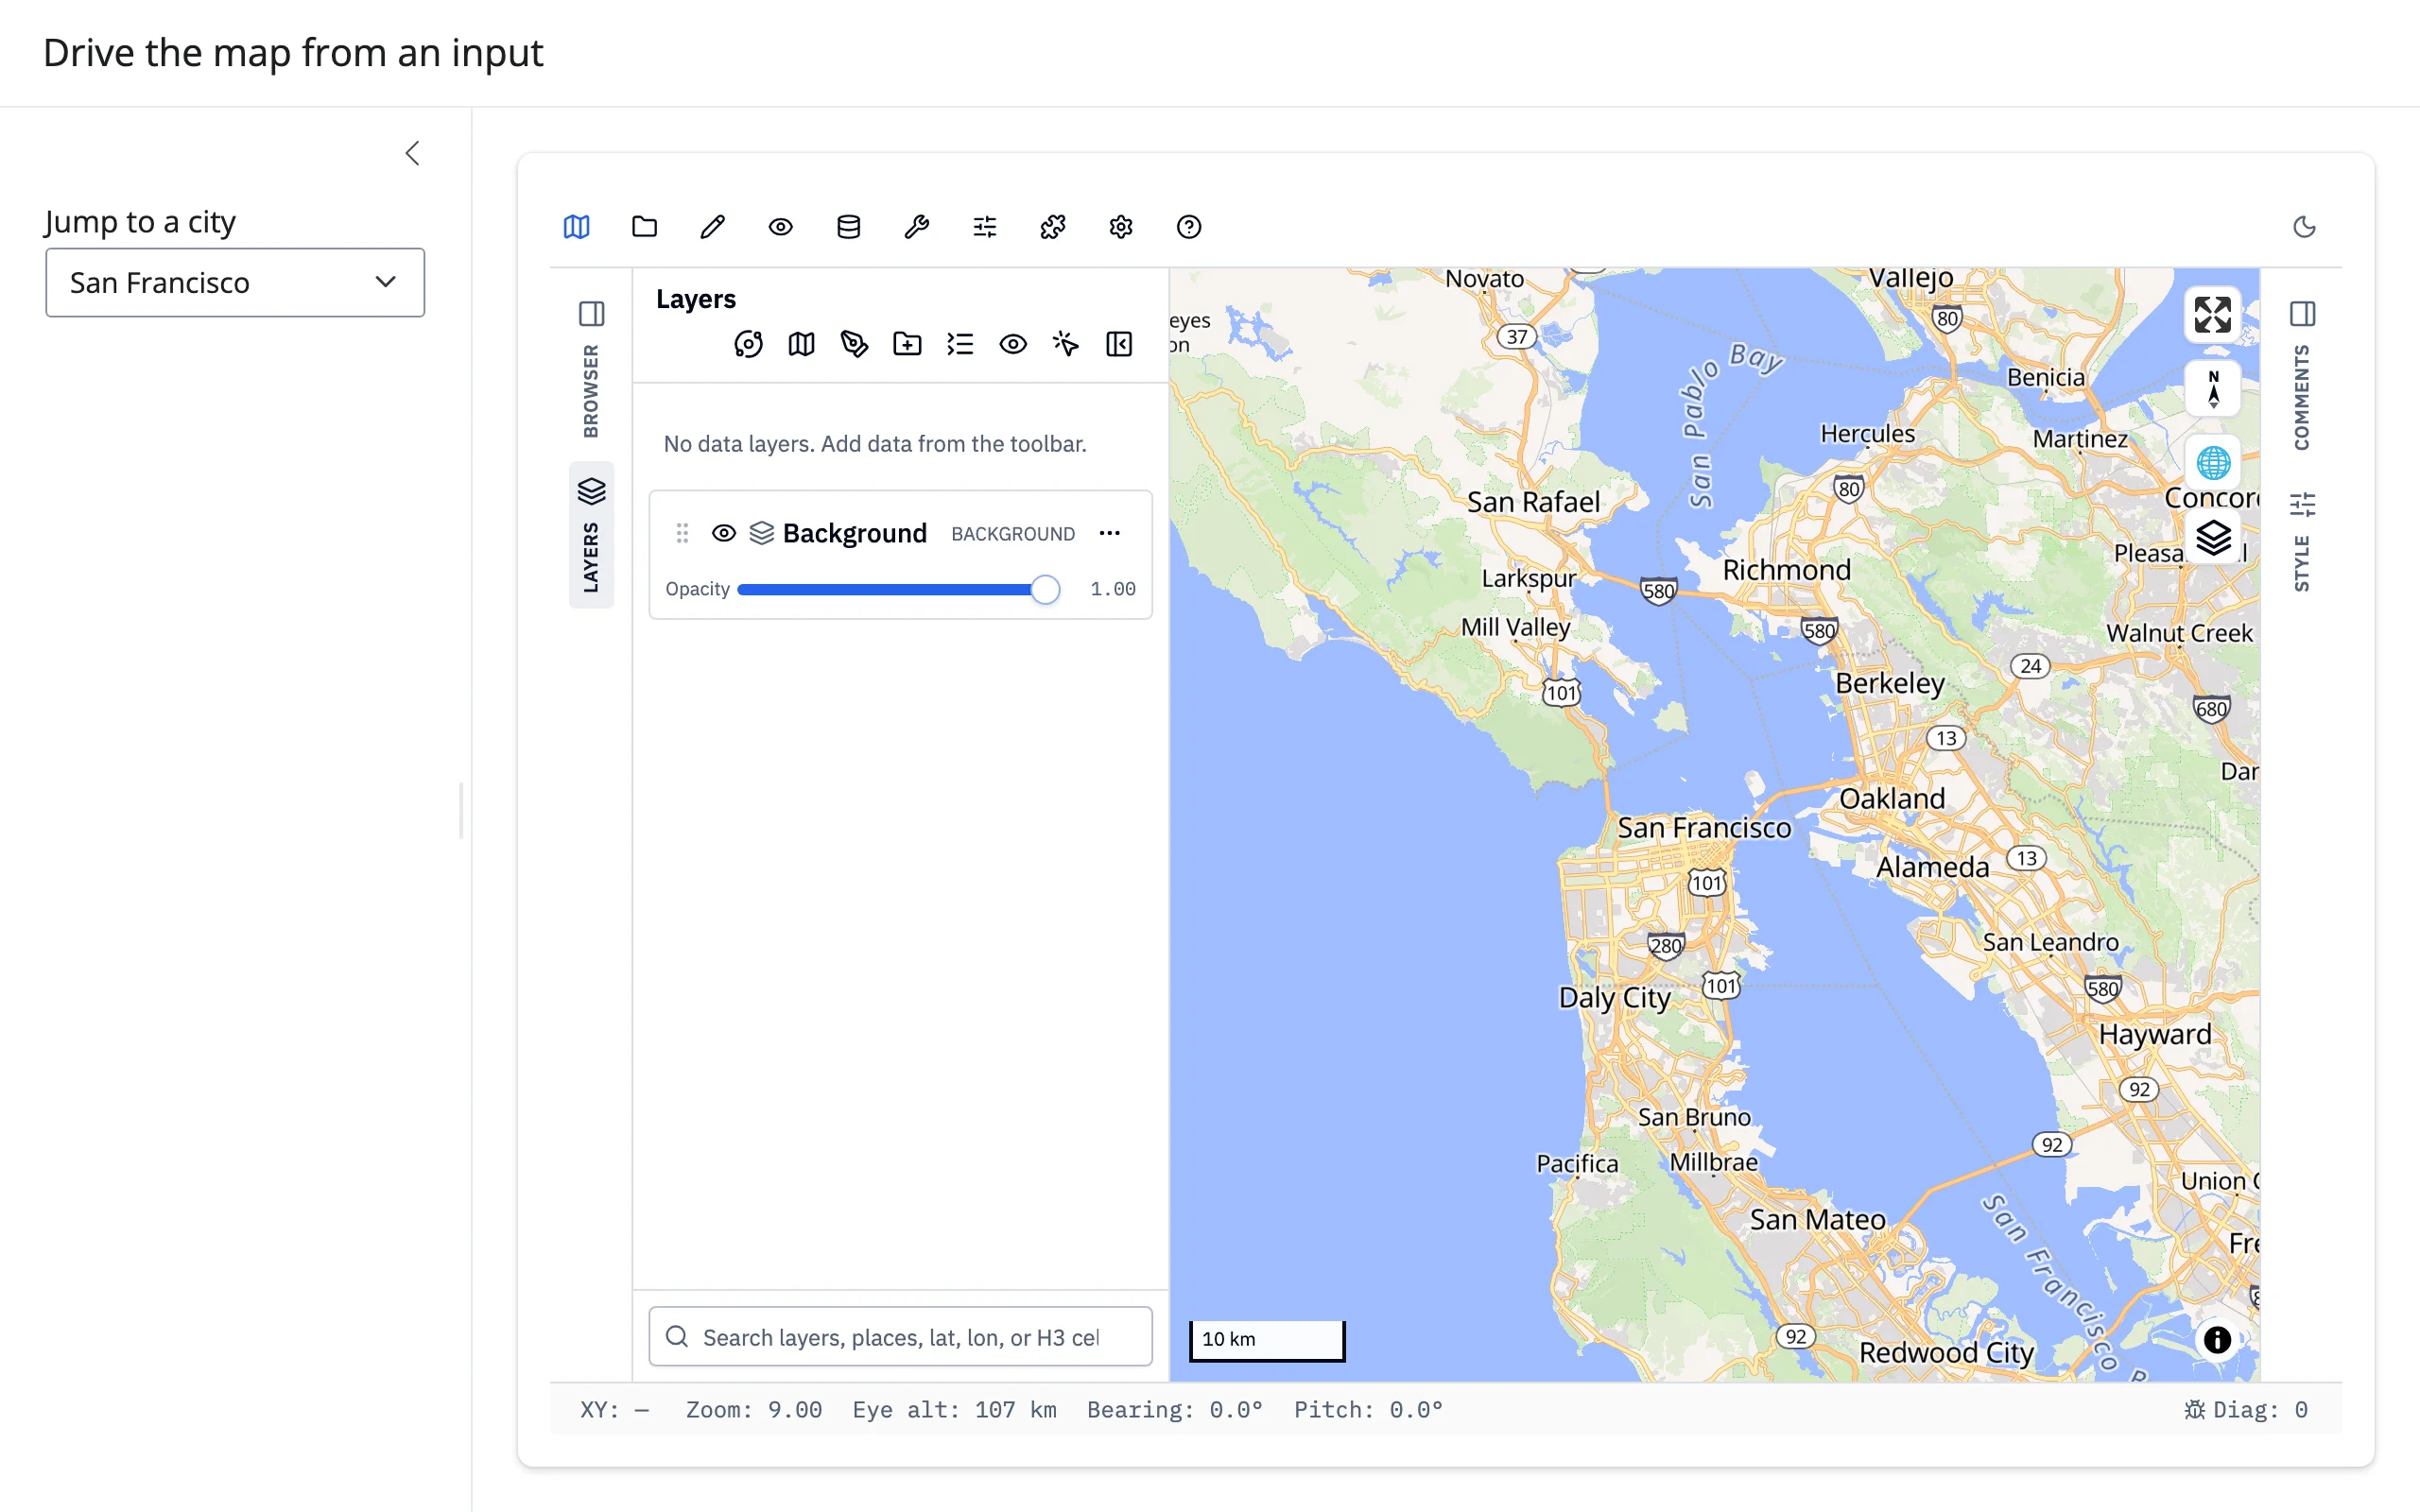
    map.widget.set_center(lng, lat, zoom=9)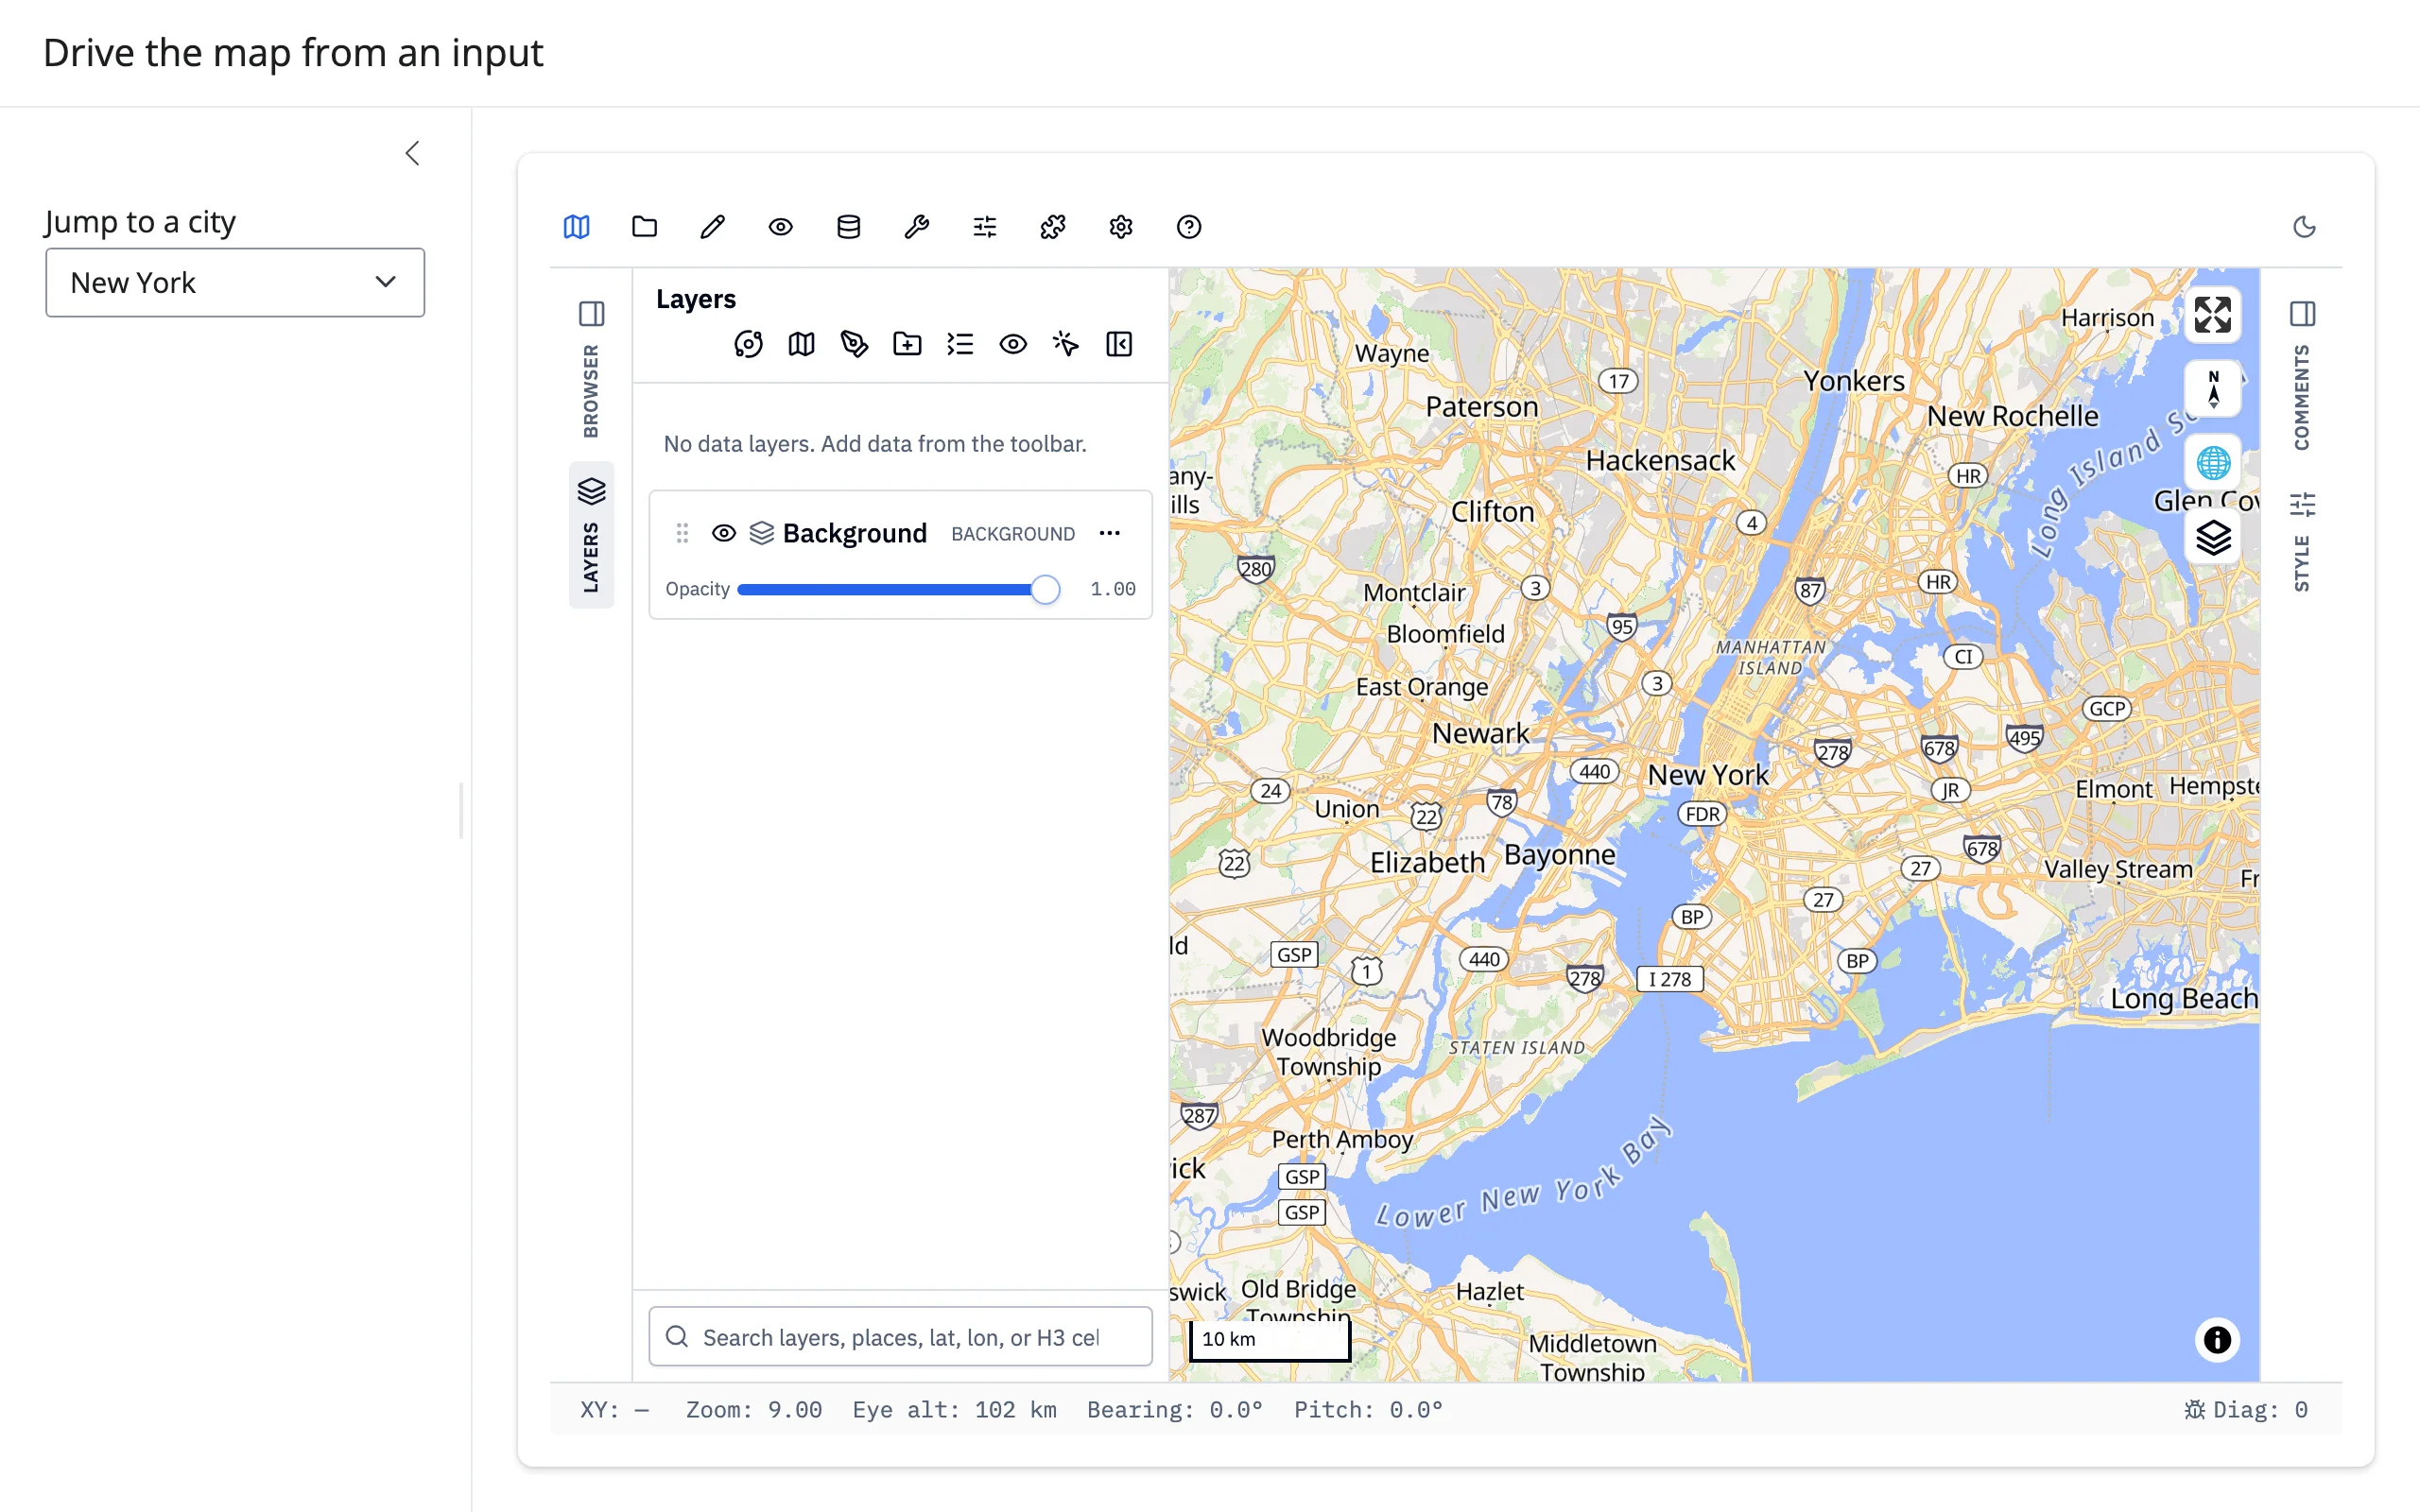
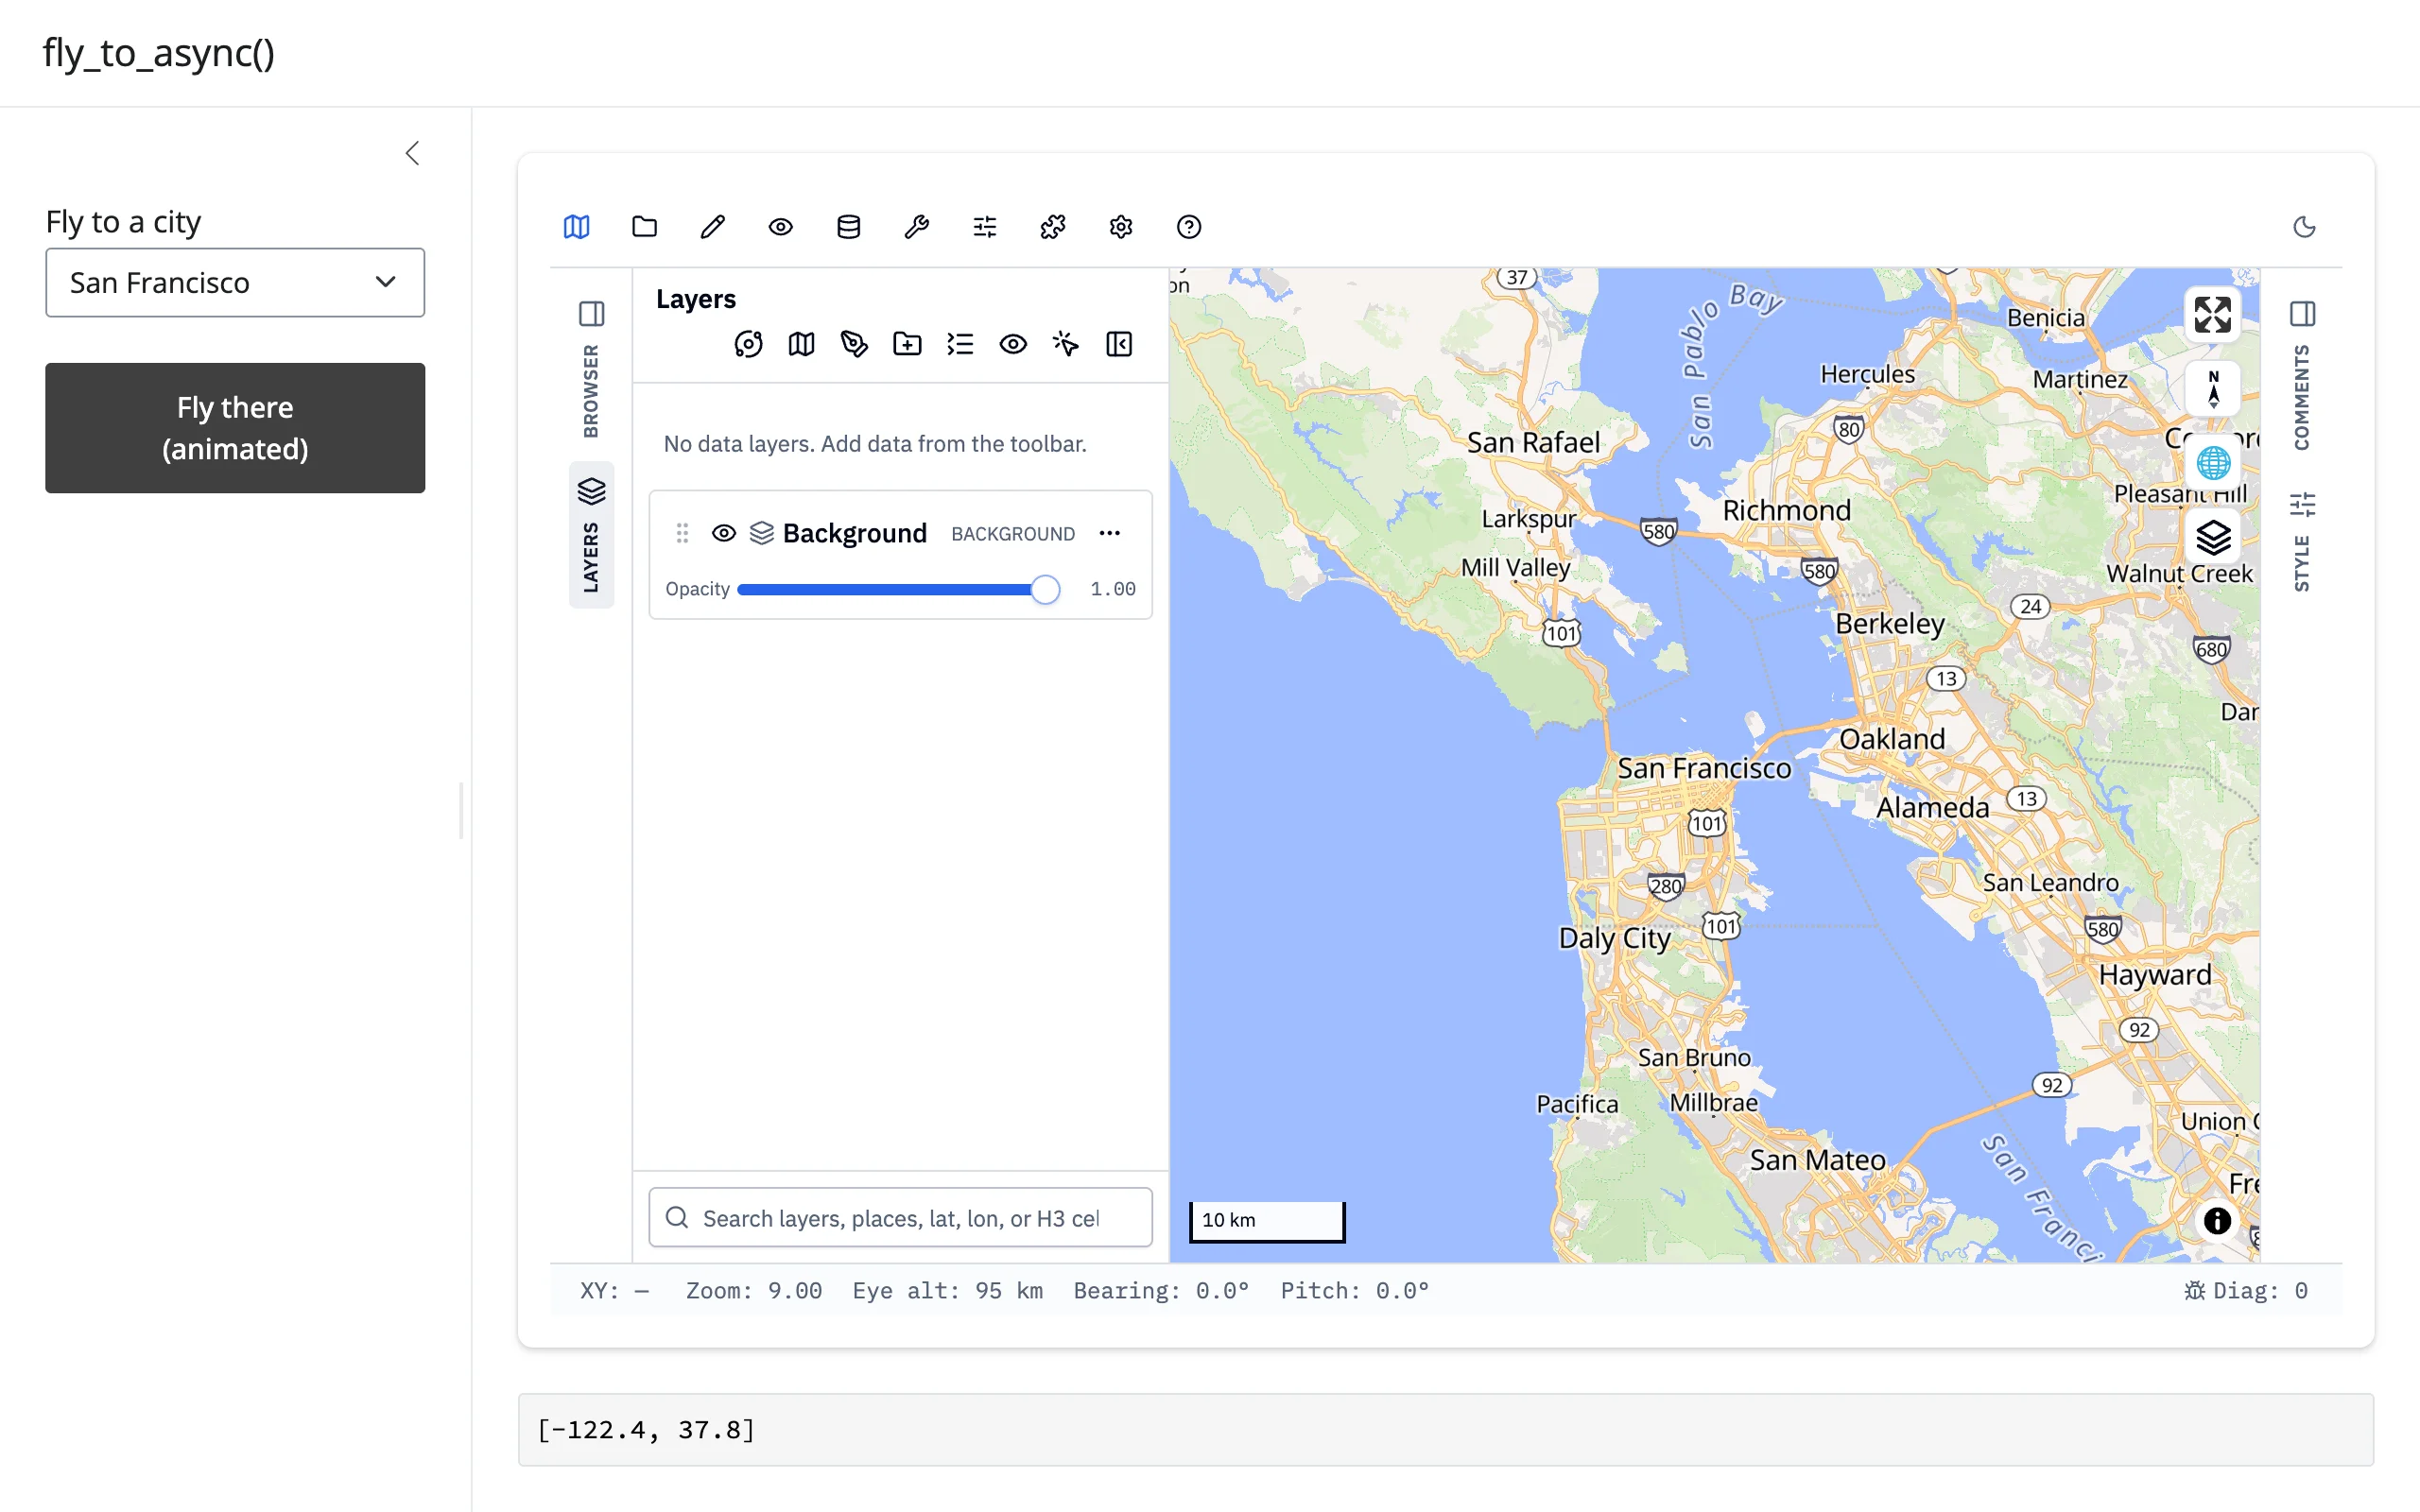
Command methods wait for a reply, and that wait can never happen directly on Shiny’s event-loop thread. fly_to(), fit_bounds(), zoom_to_layer(), identify(), get_center()/get_view()/get_bounds(), get_selected_features()/get_drawn_features(), run_algorithm(), and to_image() all send a command to the running app and wait for its reply. Call the blocking form directly inside a render function, reactive.calc, or any reactive.effect and it would have to block the very event loop that must deliver the reply – deadlock by construction, so GeoLibre raises instead of hanging. Every one of these methods has an async *_async() counterpart (fly_to_async(), get_center_async(), …) that awaits the reply instead of blocking a thread for it, which runs directly on Shiny’s event loop – but only from inside a reactive.extended_task: awaiting it from a plain reactive.effect hits the same deadlock, because the reply can’t be delivered until that effect finishes running. (Verified directly: awaiting fly_to_async() from a bare async @reactive.effect hangs indefinitely; the same call from an extended_task returns normally.)
An extended_task also can’t read reactive sources itself (input.x() inside its body raises) – read what you need before calling .invoke(), and pass it as an argument.
# fly_to_async() awaits the app's reply instead of blocking a thread for it,
# so it runs directly on Shiny's event loop -- but only from inside an
# extended_task: awaiting it from a plain reactive.effect deadlocks, because
# the reply can't be delivered until that effect finishes. An extended_task
# can't read reactive sources itself (input.city() would raise) -- read it
# before invoking, and pass it in as an argument.
@extended_task
async def fly_to_city(lng: float, lat: float):
    await map.widget.fly_to_async(lng, lat, zoom=9, duration=800)
    await asyncio.sleep(1)  # let the animation finish before querying the camera
    return await map.widget.get_center_async()


@reactive.effect
@reactive.event(input.fly)
def _():
    fly_to_city.invoke(*CITIES[input.city()])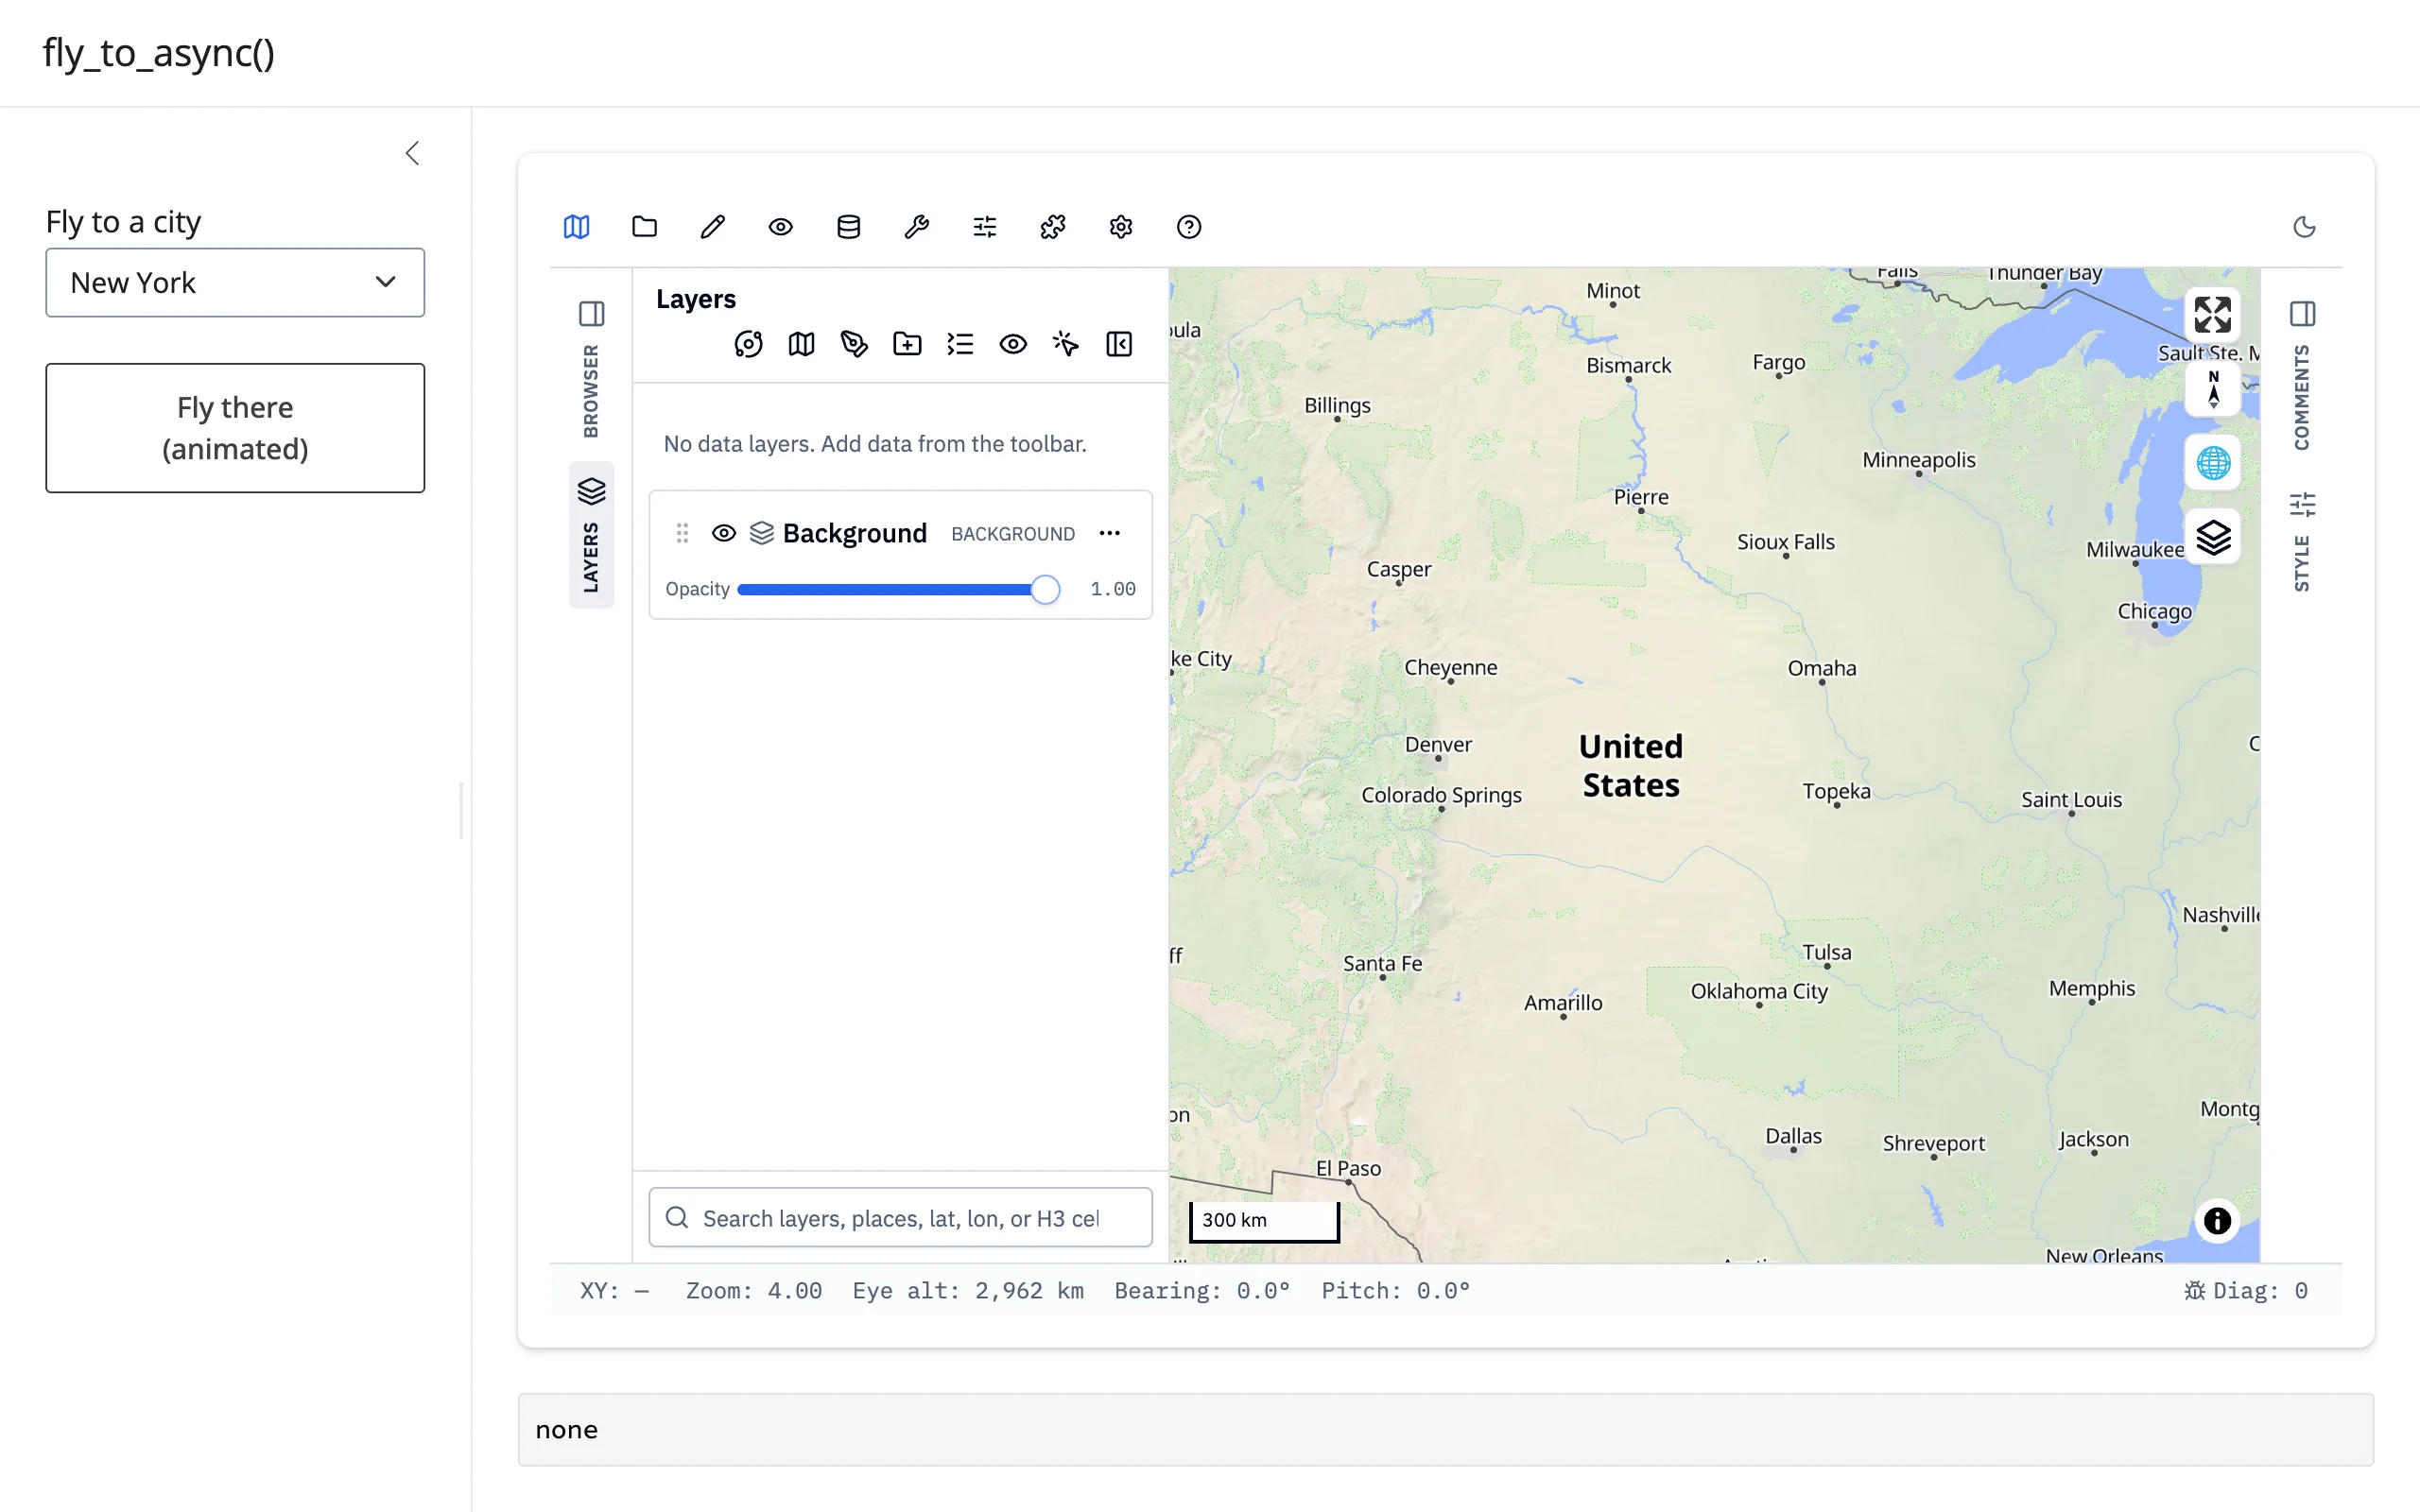
Where a project-mutation alternative exists – set_center() for fly_to(), fit_project_bounds() for fit_bounds(), the synced project trait for the query methods – it’s the cheaper, simpler option. Reach for the extended_task + *_async() pattern for the methods that have no alternative: the camera animation, identify(), run_algorithm(), and to_image().
Coordinating multiple views
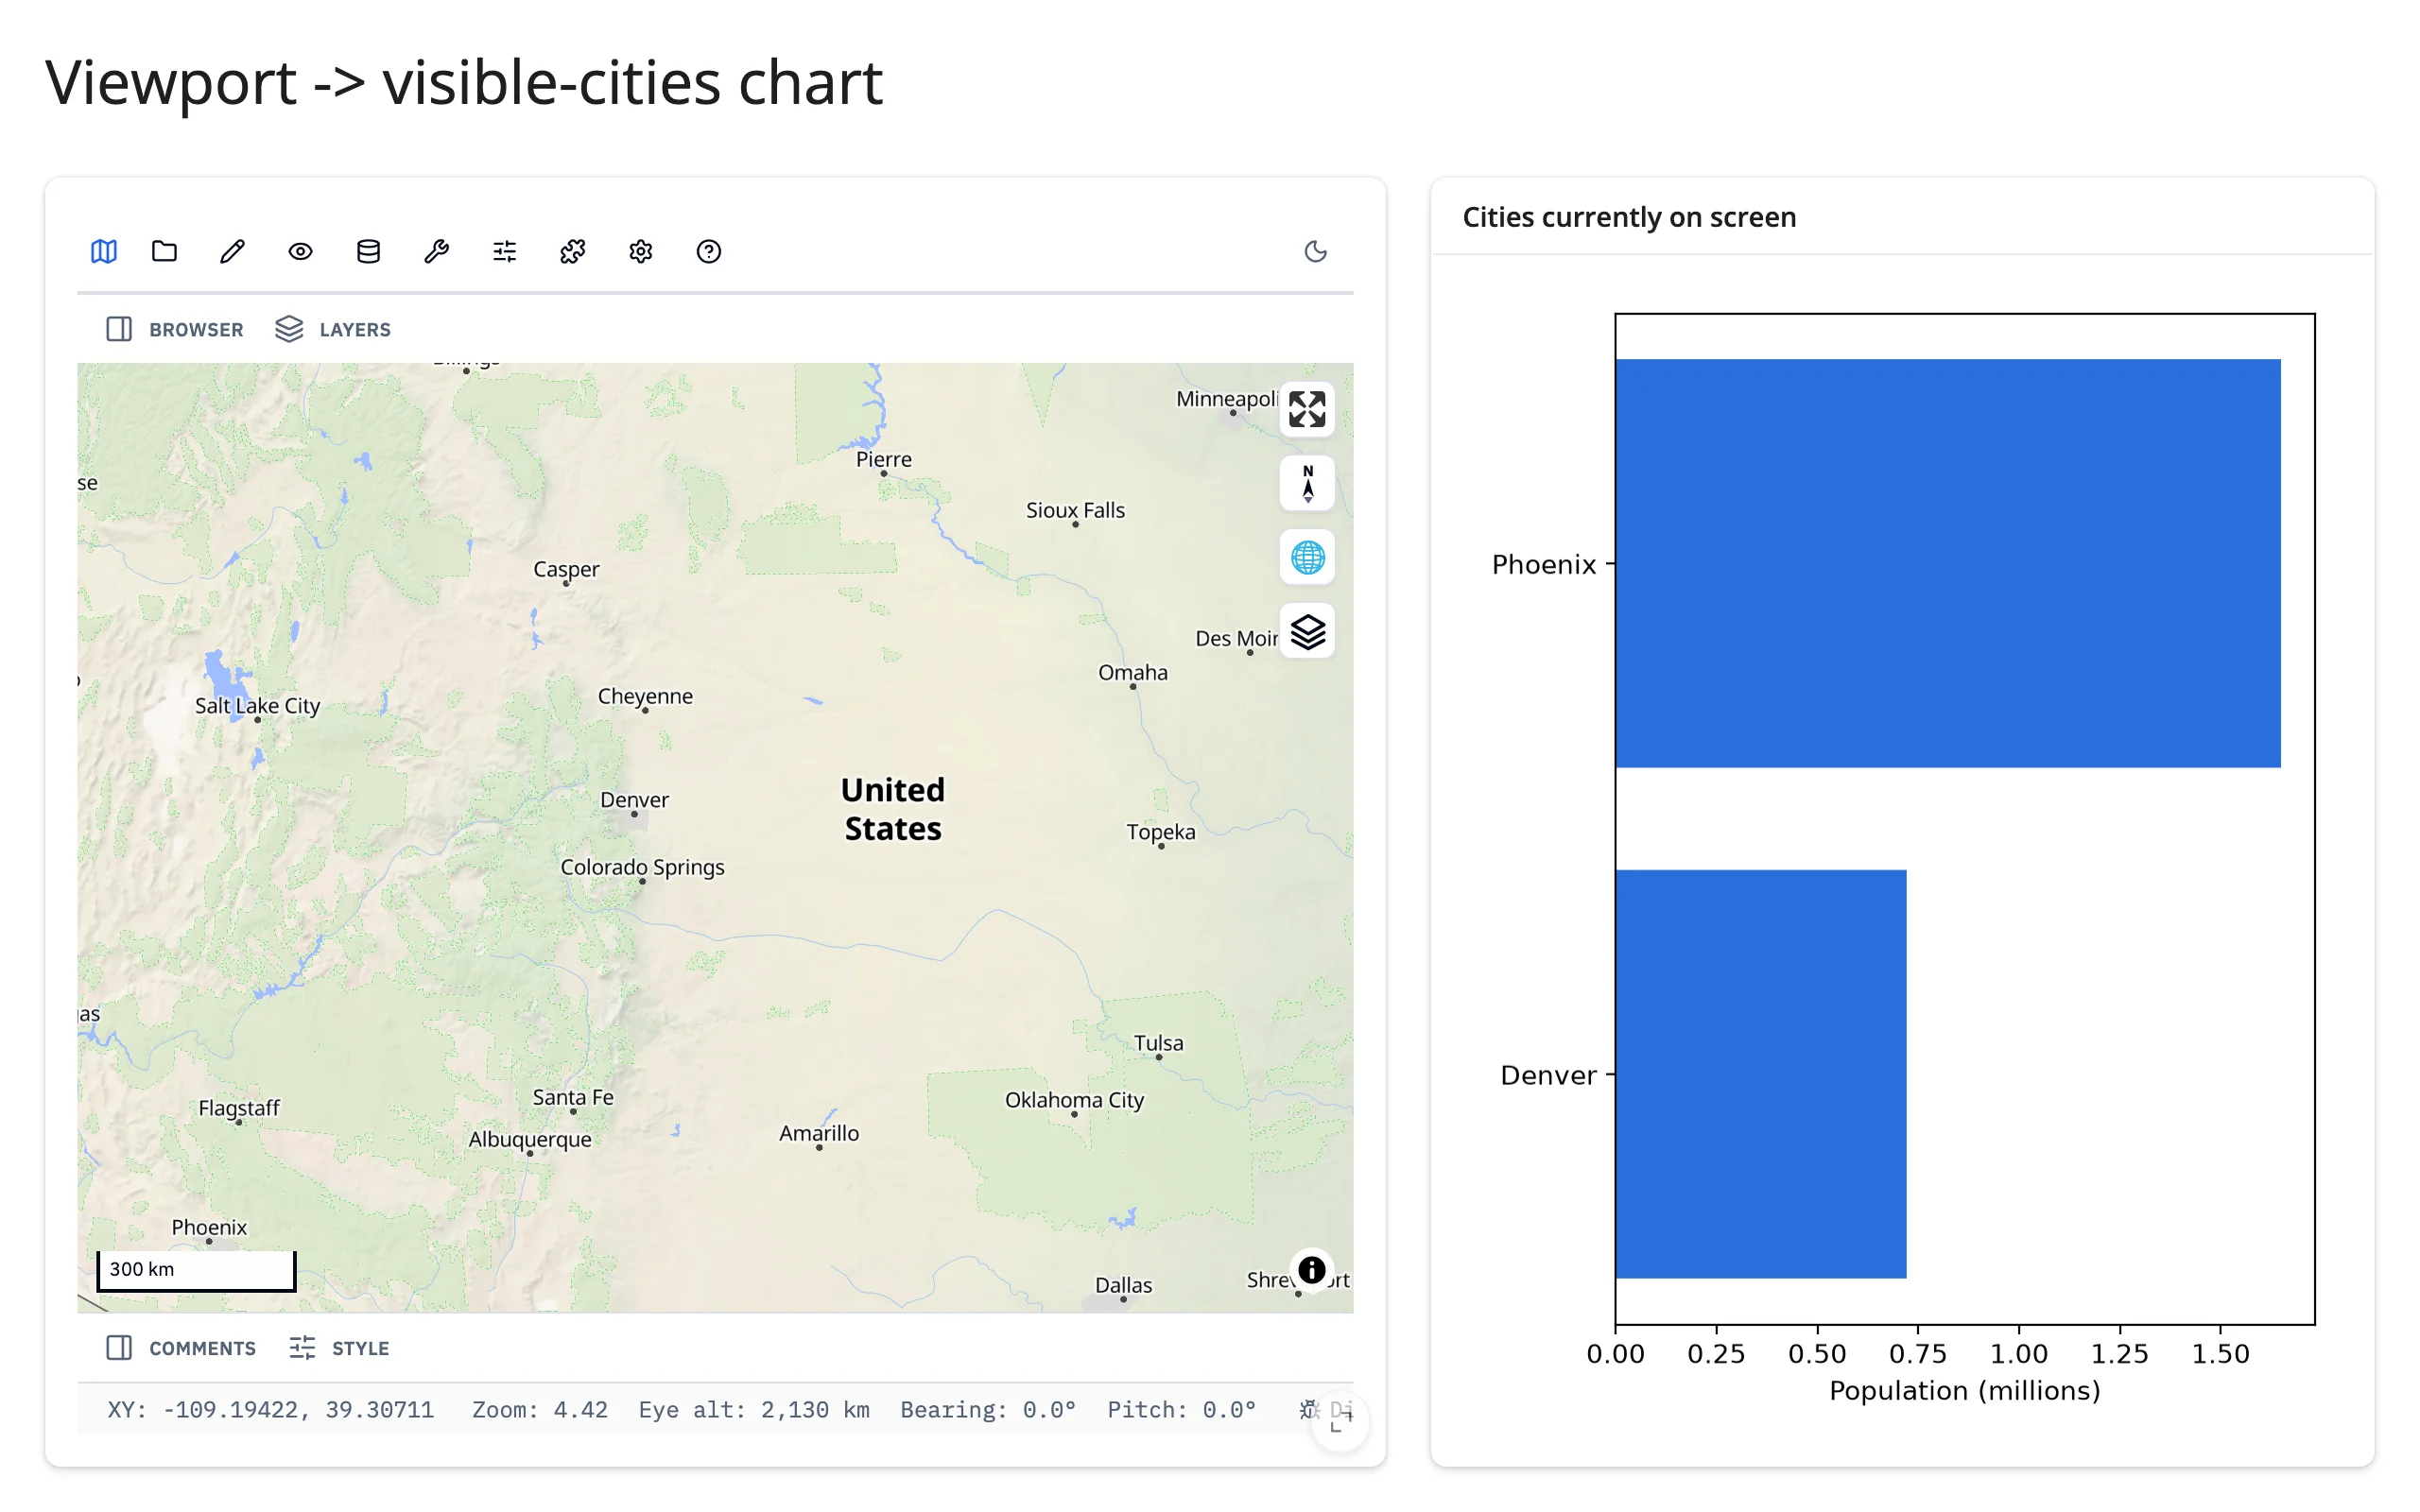
Map viewport drives a chart of what’s visible
project["mapView"]["bbox"] is [west, south, east, north] for the current viewport. Filter any lng/lat-indexed data against it in a downstream @render.plot (or any other output) to show exactly what’s on screen.
        @render.plot
        def visible_cities():
            # "bbox" fills in once the browser's first sync lands, a moment
            # after the app boots -- req() cancels the output until then.
            bbox = map.read("project")["mapView"].get("bbox")
            west, south, east, north = req(bbox)
            shown = [
                (name, pop)
                for name, lng, lat, pop in CITIES
                if west <= lng <= east and south <= lat <= north
            ]
            fig = Figure(figsize=(5, 4), layout="tight")
            ax = fig.subplots()
            if shown:
                names, pops = zip(*sorted(shown, key=lambda c: c[1]))
                ax.barh(names, pops, color="#2a6fdb")
            ax.set_xlabel("Population (millions)")
            return fig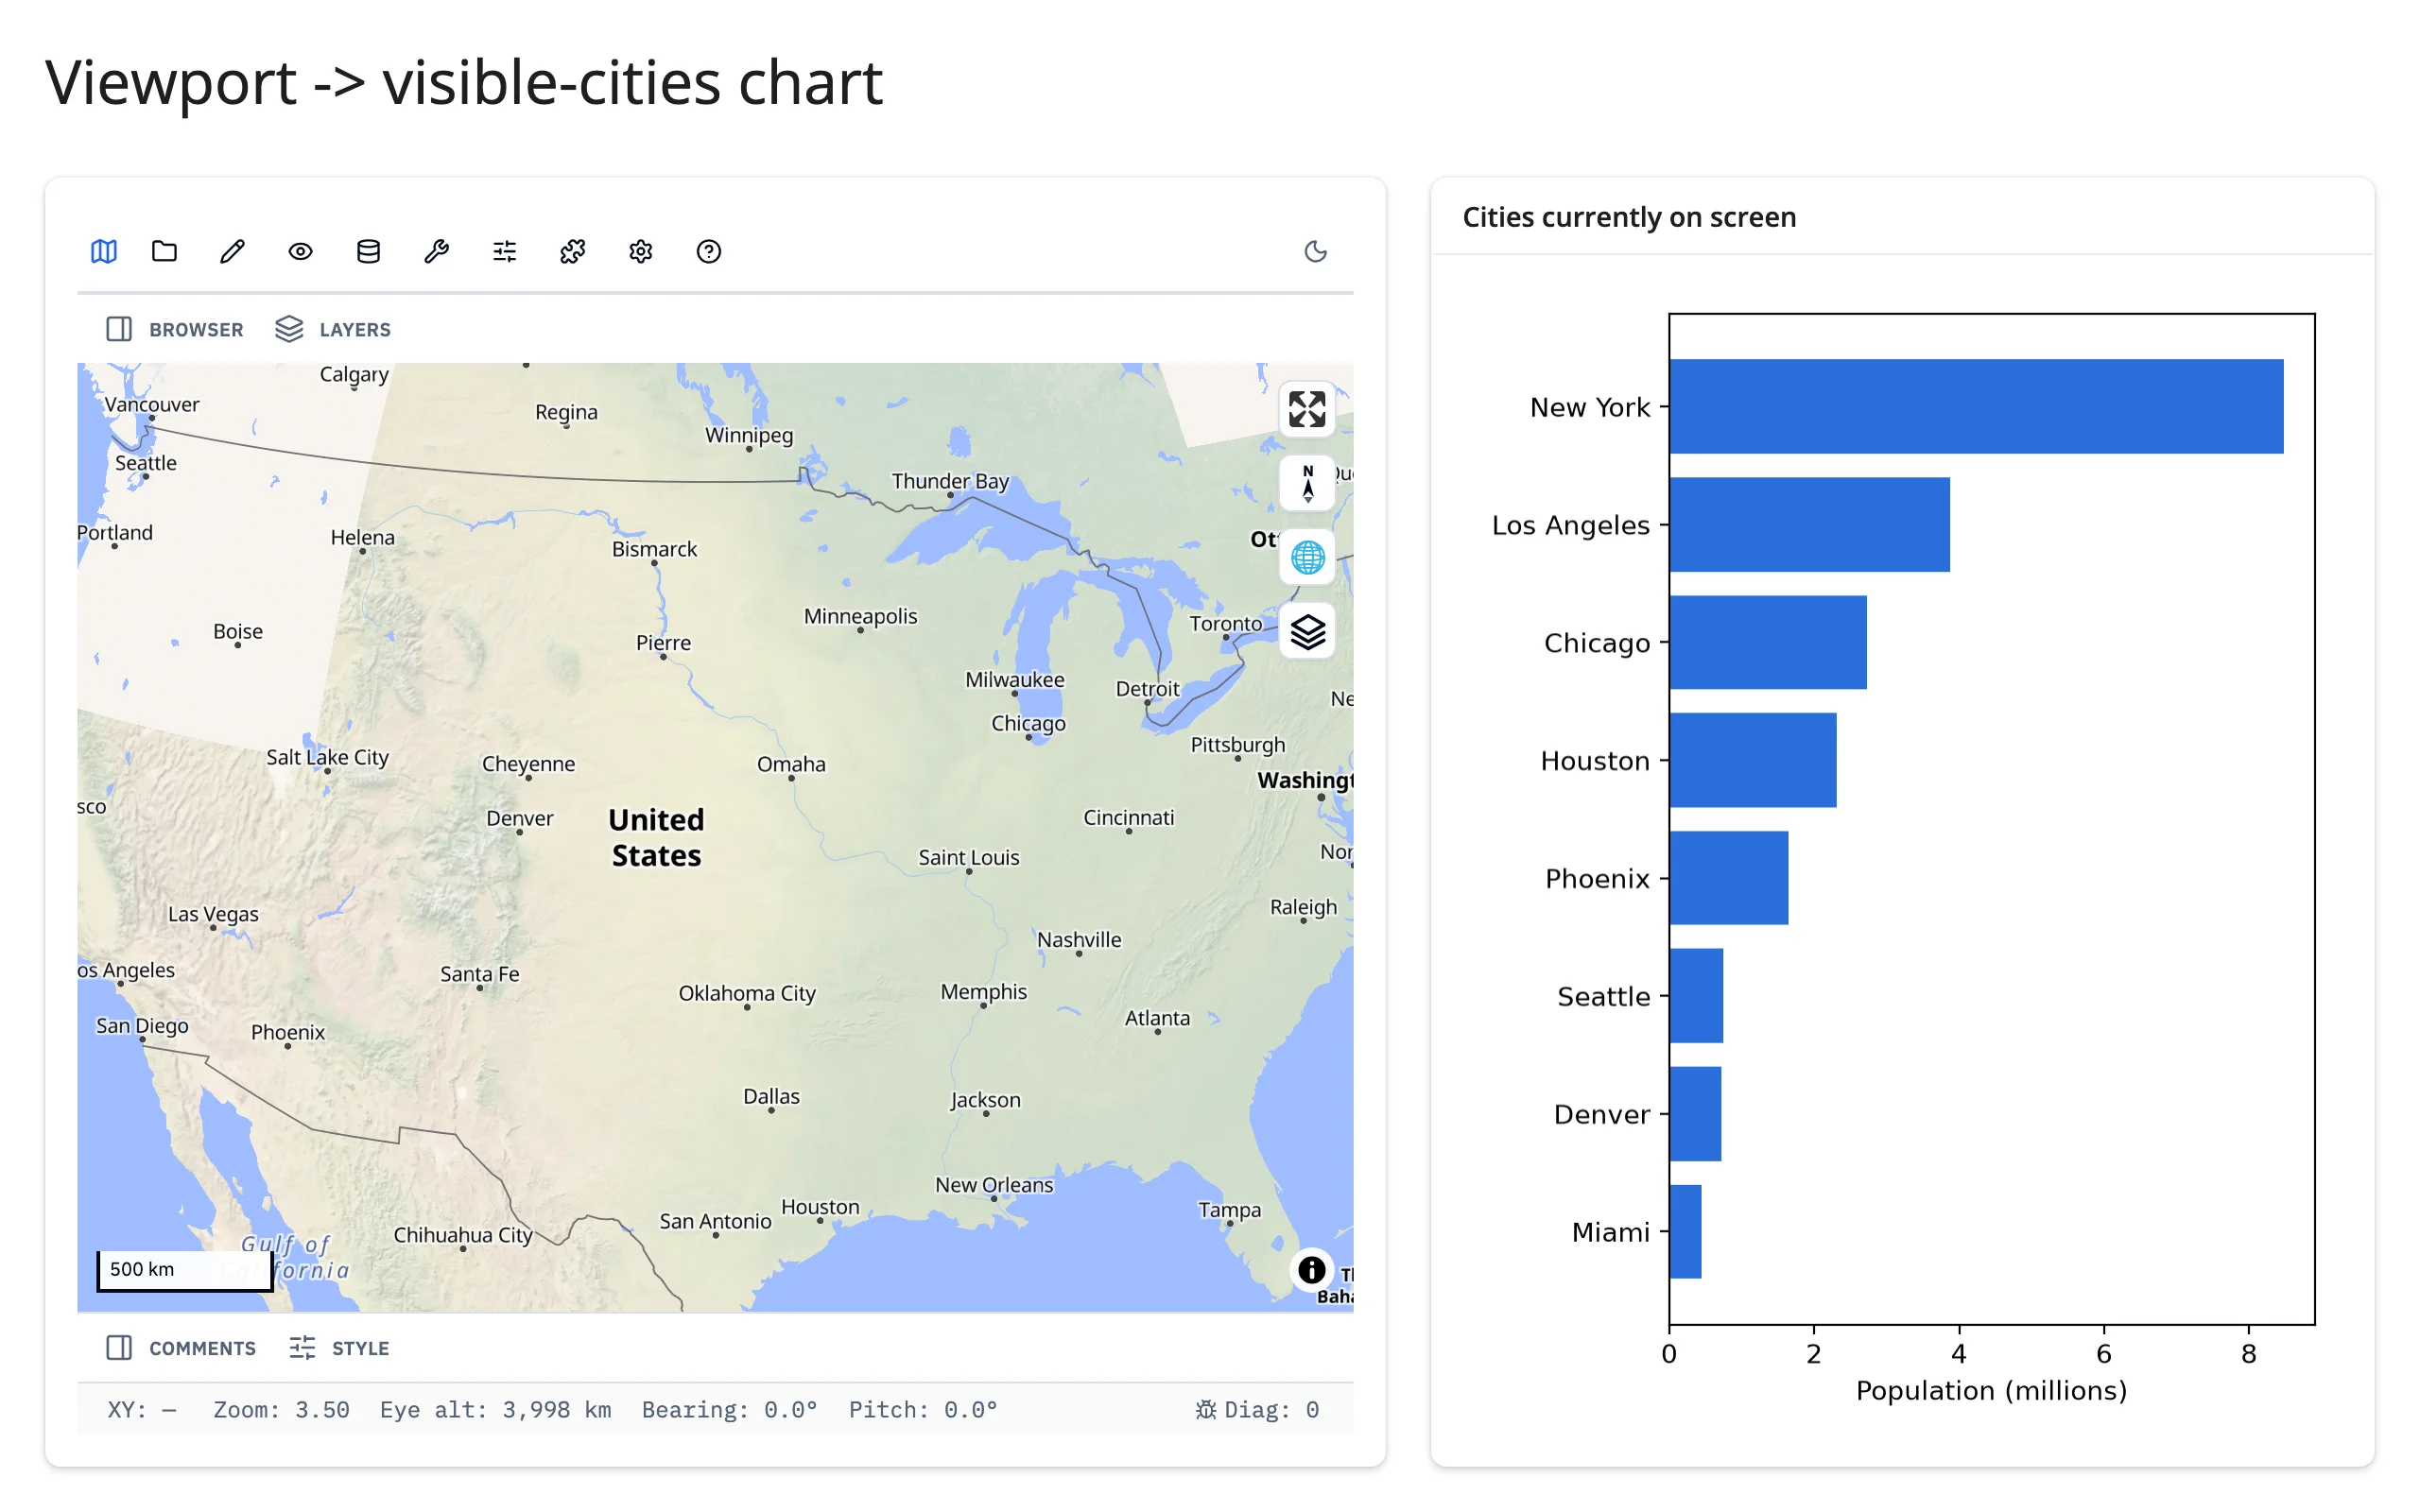
A table drives the map
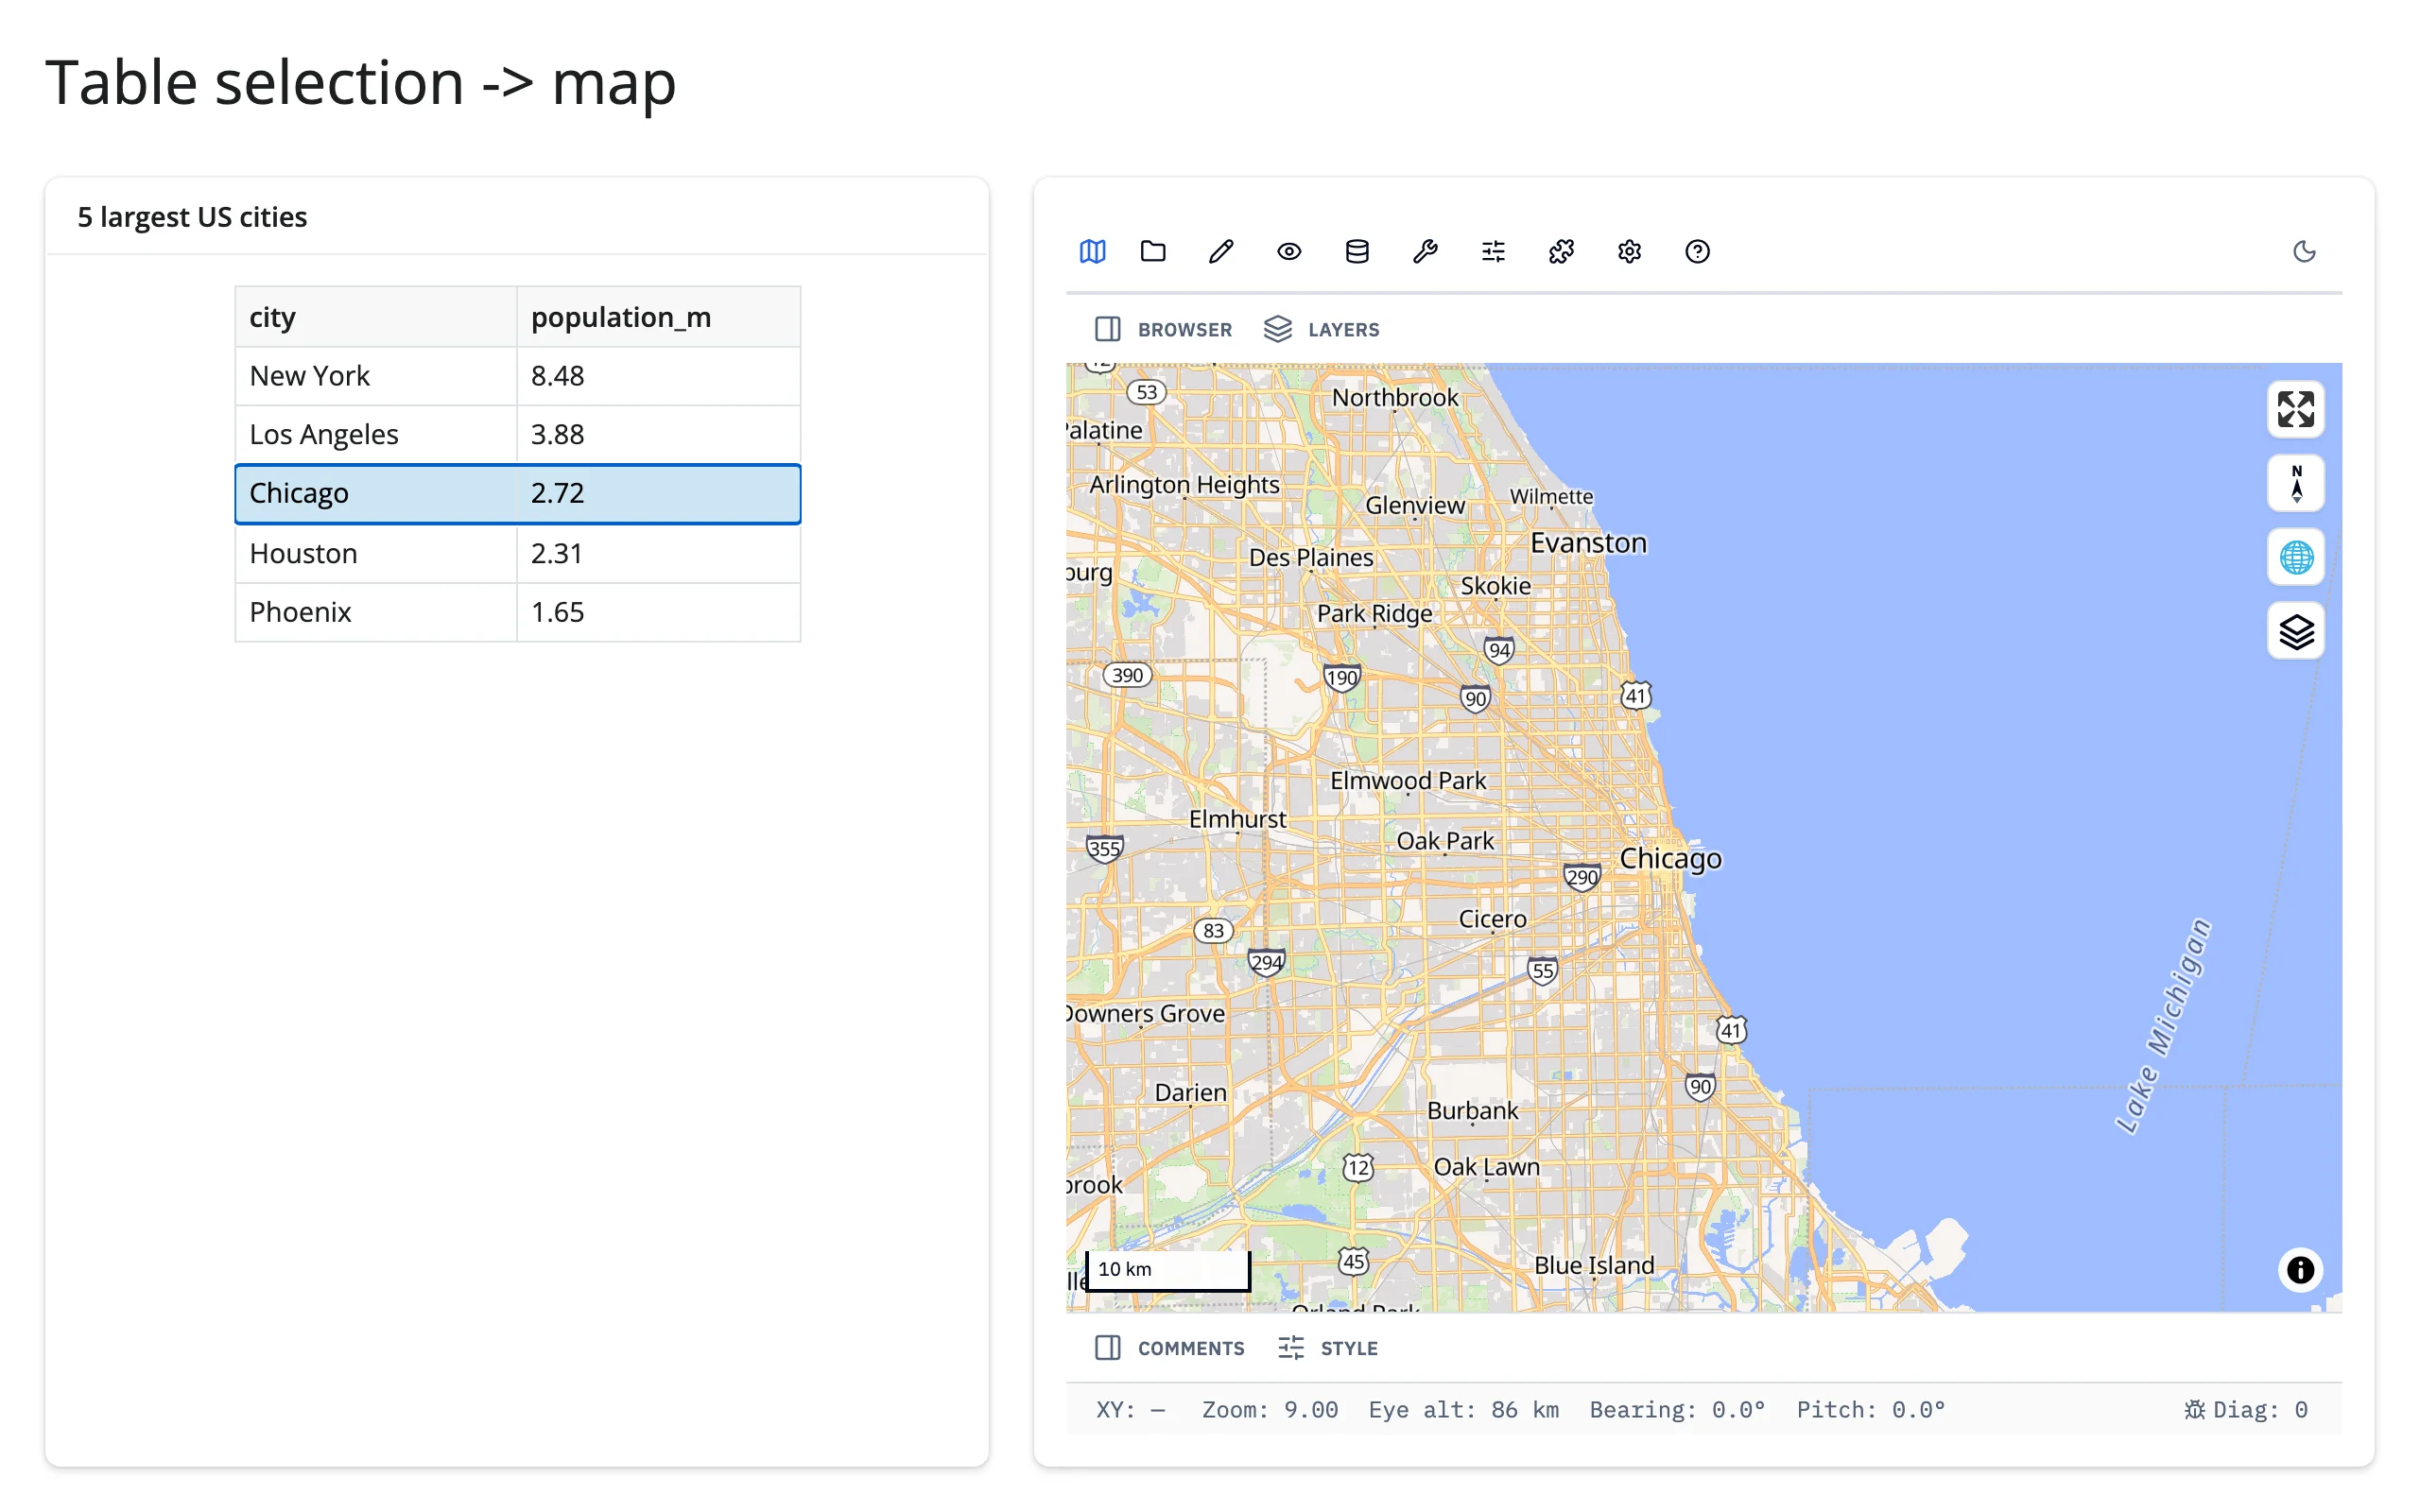
A plain @render.data_frame row selection (table.cell_selection()["rows"]) is a clean source for set_center() – no GeoLibre-side accessor needed, since the direction here is table-to-map.
@reactive.effect
def _():
    rows = table.cell_selection()["rows"]
    if not rows:
        return
    row = CITIES.iloc[rows[0]]
    map.widget.set_center(row["lng"], row["lat"], zoom=9)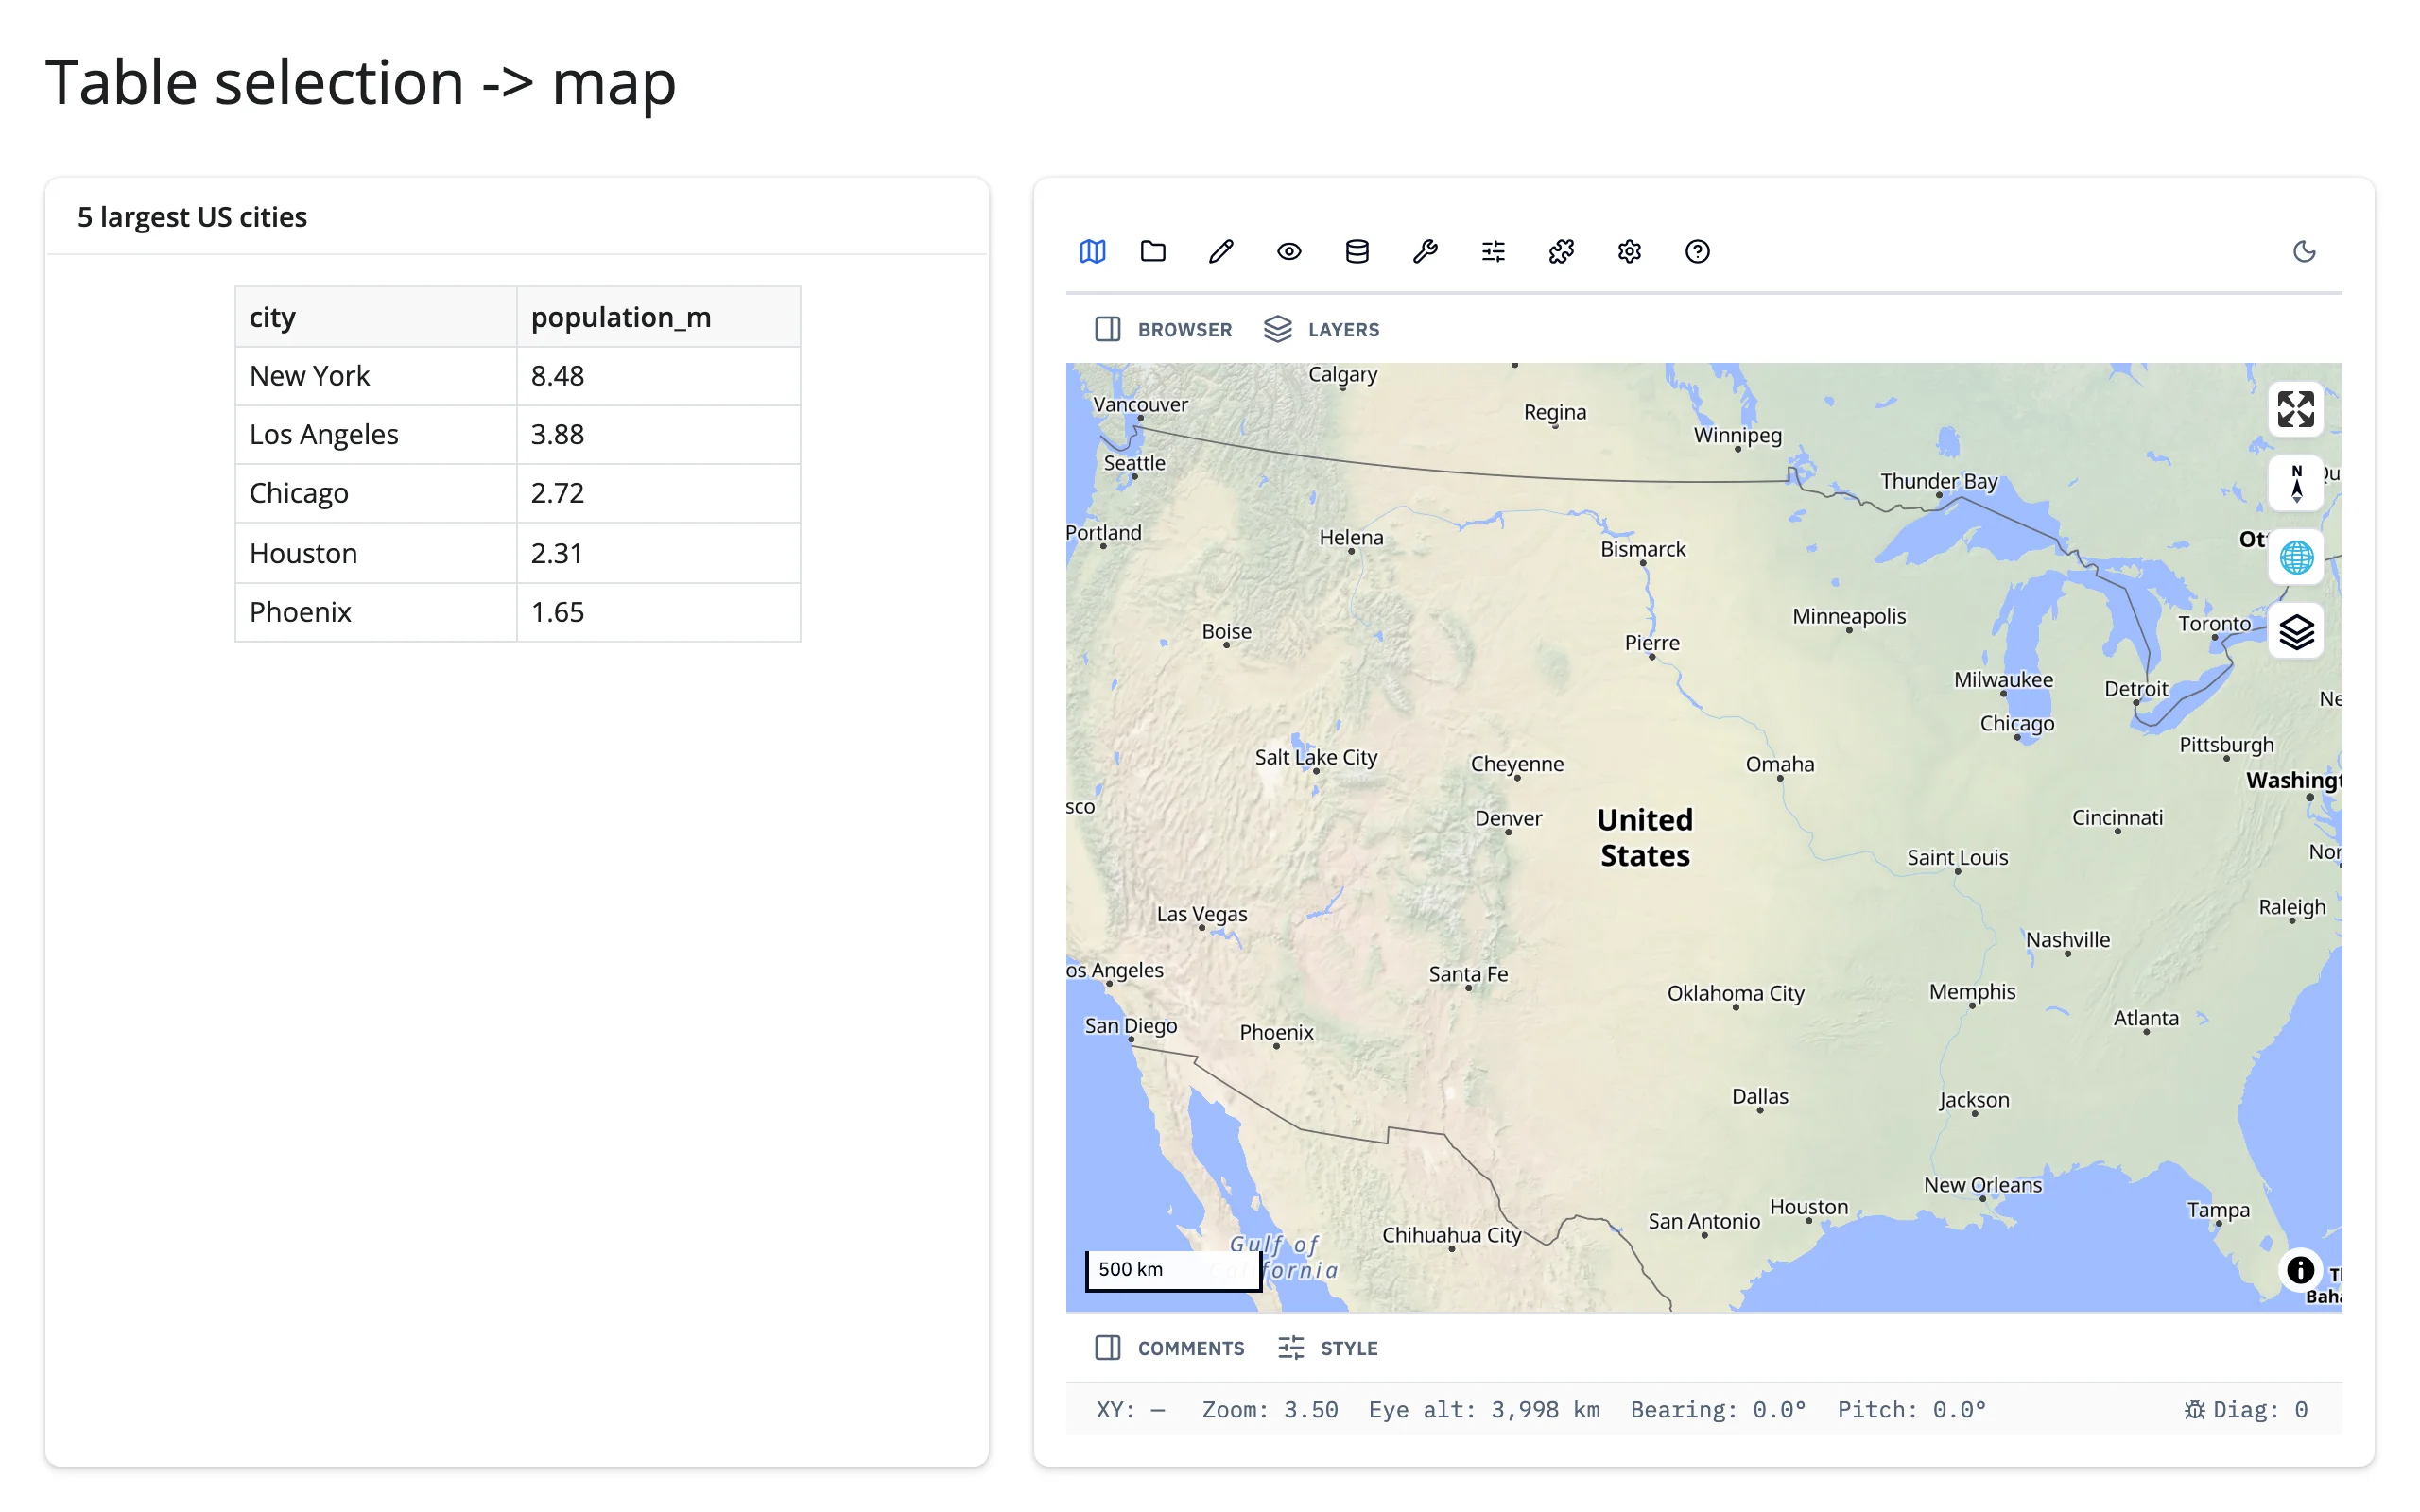
Click for details (feature-rich version)
See “Event callbacks” above – 06_events_and_detail_card.py is itself a complete linked-view pattern (map click, with Identify armed, drives a detail card showing the clicked feature’s properties) and is the simplest of the three to adapt.
Large data
GeoLibre’s basemaps are MapLibre vector tiles, so they’re already “only send what’s visible.” But layers you add from Python (add_geojson() and friends) ship the whole feature collection to the browser once, the same as ipyleaflet – there’s no large-data mode specific to GeoLibre’s own layer API. This guide’s introduction already points past it: for a point cloud of millions, use lonboard (GPU-rendered); for code-driven deck.gl layers on a MapLibre basemap without the full GIS-app overhead, use maplibre directly. See the Large data & performance article for how these approaches fit together.
Layout and sizing
The embedded app reads its height trait once, when it loads, to size its <iframe> – changing map.widget.height after rendering does nothing (resize the output’s container instead). GeoLibre’s own default is "800px", which render_geolibre treats as “unset”: in a filling layout the map fills its container; give the Map an explicit height (e.g., Map(height="500px")) to opt out of filling, or size the output with render_geolibre(height=...) to fill a fixed-size container with a still-default-height map.
from __future__ import annotations

from geolibre import Map
from shiny.express import ui

from shinywidgets import render_geolibre

ui.page_opts(title="Layout and sizing", fillable=True)

with ui.layout_columns(col_widths=[4, 4, 4]):
    with ui.card(full_screen=True):
        ui.card_header("Default: fills the card")

        @render_geolibre
        def fills():
            return Map(center=(-98.5, 39.8), zoom=3)

    with ui.card(full_screen=True):
        ui.card_header('Map(height="300px"): opts out of filling')

        @render_geolibre
        def fixed():
            return Map(center=(-98.5, 39.8), zoom=3, height="300px")

    with ui.card(full_screen=True):
        ui.card_header('render_geolibre(height="250px"): sizes a default-height map')

        @render_geolibre(height="250px")
        def sized():
            return Map(center=(-98.5, 39.8), zoom=3)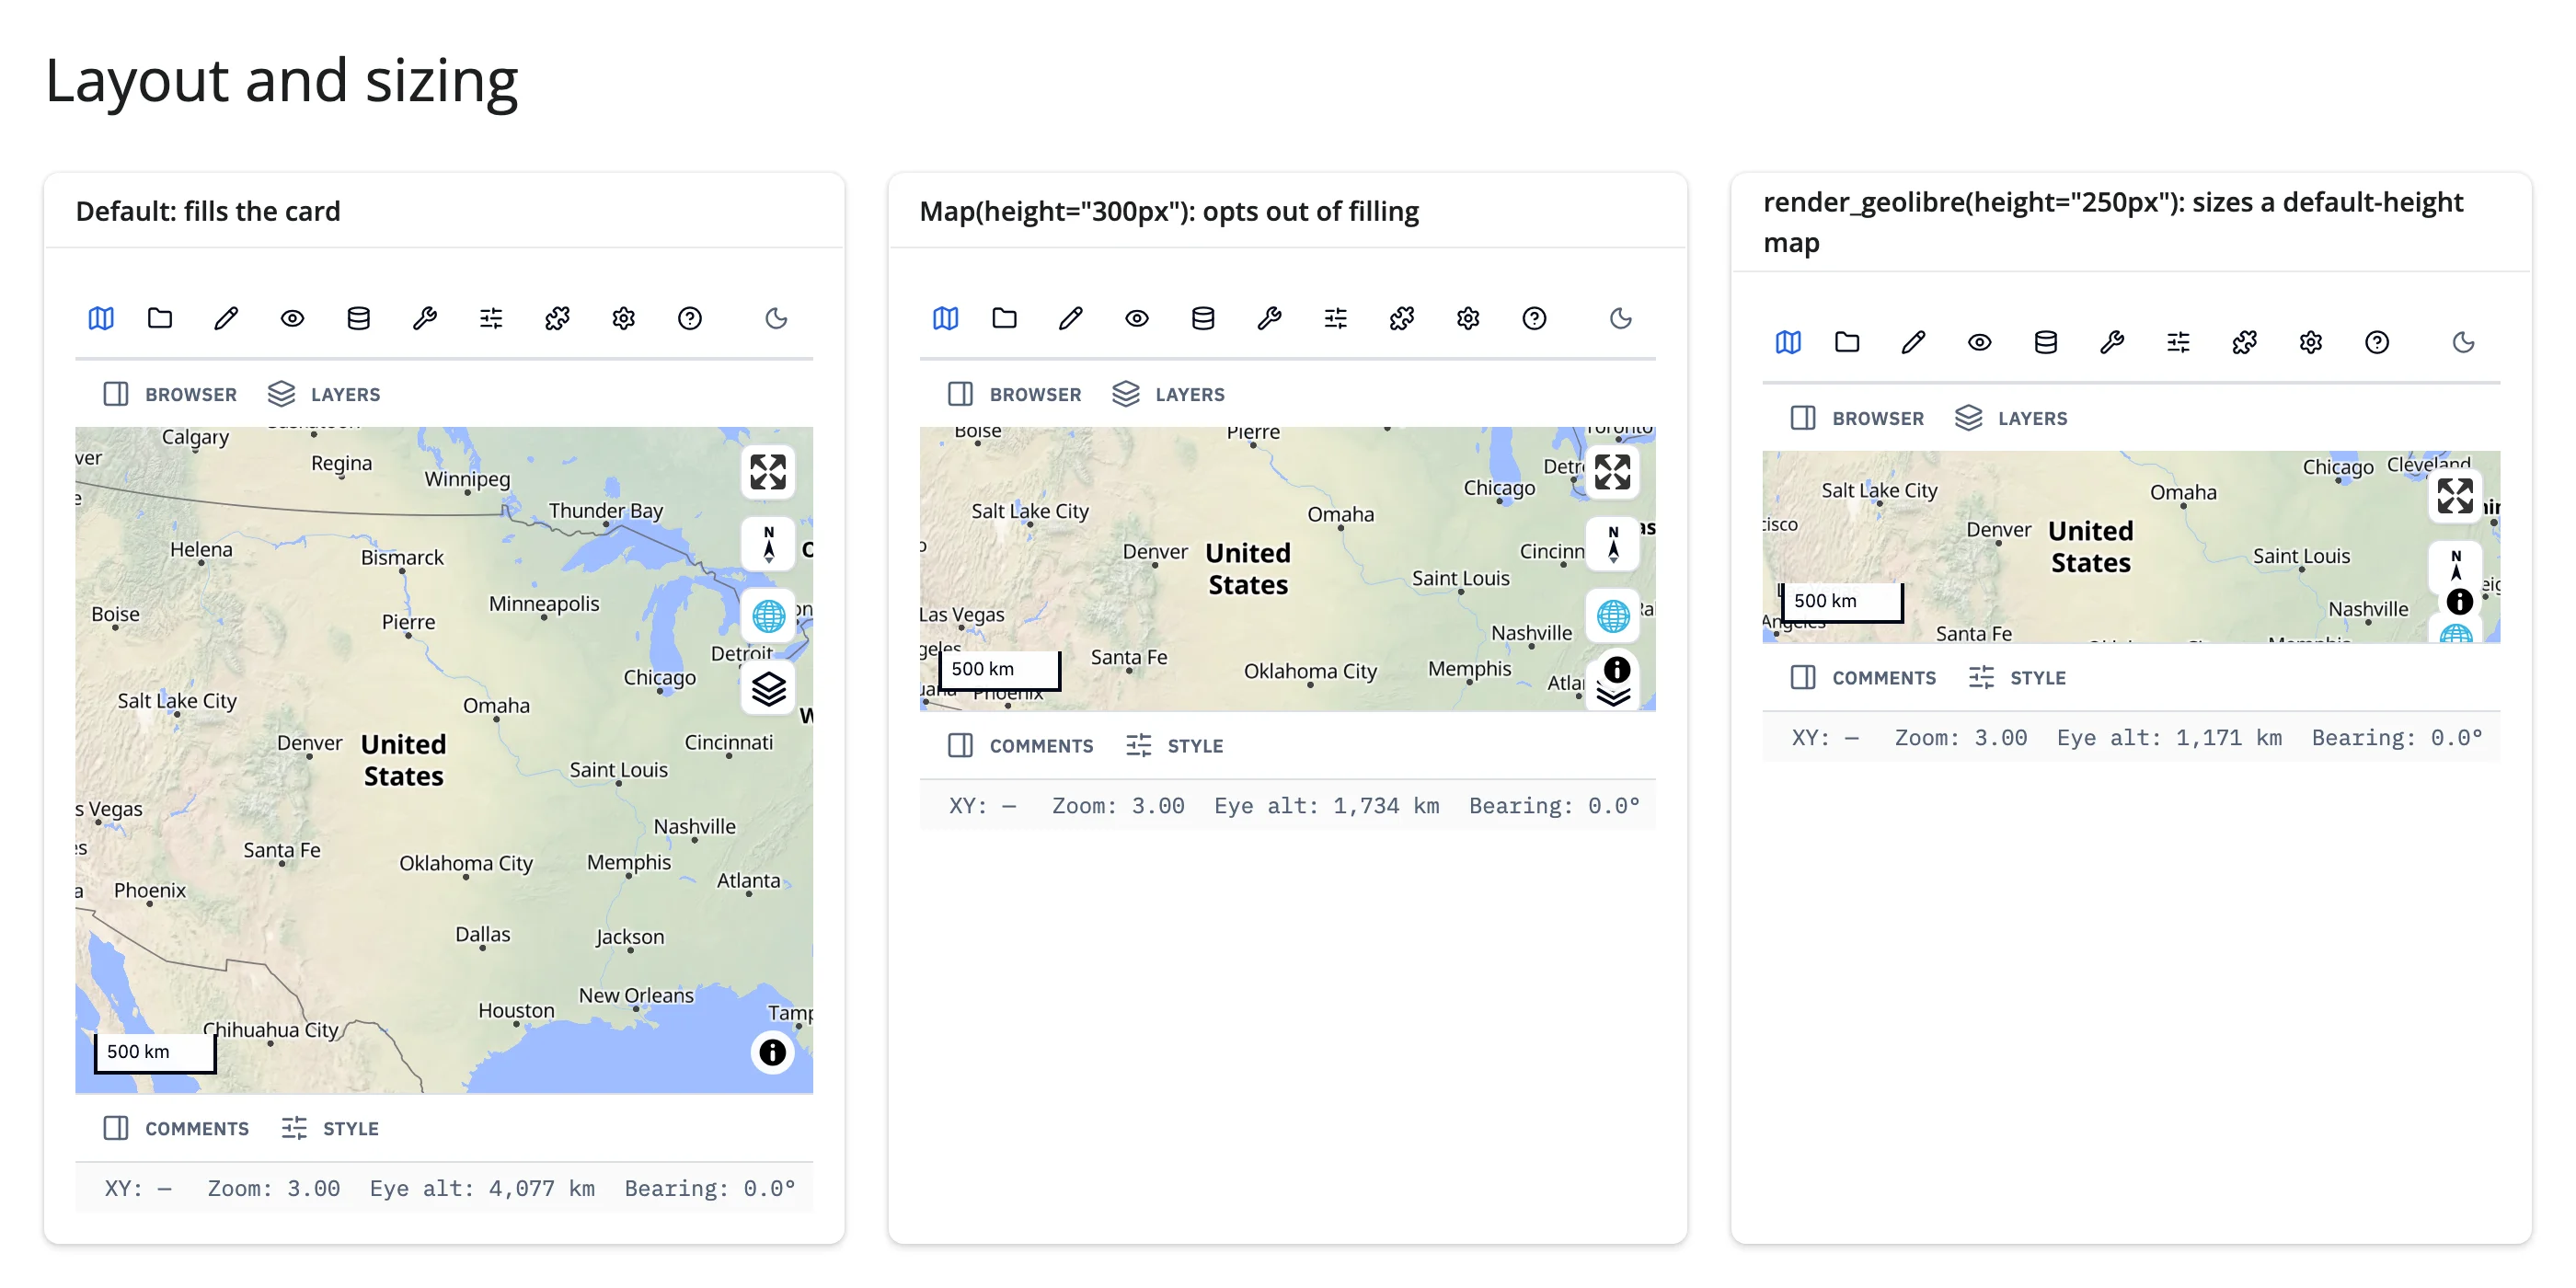
Measured: the default map filled a ~508px card, height="300px" held exactly to 300px, and the render_geolibre(height="250px") output measured ~250px – all three behave as documented.
Gotchas and limitations
- Blocking command methods can’t run on the event-loop thread – by design, not a bug.
fly_to(),get_center(),to_image(), and the rest raise immediately if called from a render function,reactive.calc, or anyreactive.effect. Their*_async()variants (fly_to_async(), …) can run directly on the event loop, but only from inside areactive.extended_task– awaiting one from a plainreactive.effectdeadlocks the same way (verified directly; see “Updating the widget from Python”). This requires GeoLibre >= 3.6.0 (enforced by theshinywidgets[geolibre]extra), which added the*_async()variants and polls for the command reply instead of pumping a Jupyter kernel event loop. extended_taskcan’t read reactive sources from inside its own body.input.x()inside an@extended_task async defraises"You're not allowed to read reactive sources from inside a Extended Task". Read the value before calling.invoke()and pass it as an argument, as every command-method example in this guide does.project["mapView"]doesn’t have a"bbox"key until the browser’s first state sync lands, a moment after the app boots. Code that readsproject["mapView"]["bbox"]directly on a fast-loading page can throw aKeyErroron the very first render before self-healing on the next invalidation. Use.get("bbox")with areq()or aNonecheck.fly_to()/fly_to_async()acknowledge at animation start, not animation end. Aget_center()issued immediately after the ack can report a mid-flight position. Pass an explicitdurationand wait roughly that long (or a bit more) before querying the camera, as09_fly_to_async.pydoes.- GeoLibre’s
layouttrait shadows ipywidgets’Layout.Map.layoutis GeoLibre’s own string ("embed"/"full"/"maponly", the app’s chrome), not anipywidgets.Layout, soipywidgets.Layoutstyling isn’t available on this widget, and the browser logs one harmless “Cannot read properties of undefined (reading ‘then’)” console error per render. Rendering and interaction are unaffected; this is an upstream naming collision shinywidgets can’t fix from its side. map.read("project")is chatty. It invalidates on every pan and zoom and carries the whole project, including inlined layer data. Prefer the event callbacks (on_click(),on_selection_change(),on_layer_change()) for anything that fires often.- Local-file layers now work deployed, unlike earlier builds of this integration.
add_cog()/add_raster()of a file on the server’s disk used to be local-host-only; shinywidgets now proxies GeoLibre’s loopback server at/proxy/{port}/, so these layers load the same way locally and on shinyapps.io/Posit Connect. Basemap tiles and remote data URLs still need internet access from the browser, not the server. - GeoLibre is young and moves fast (multiple releases in recent weeks at the time of writing). Pin or test against upgrades if your app depends on specific command-method behavior.
Gallery candidates
template_city_explorer.py
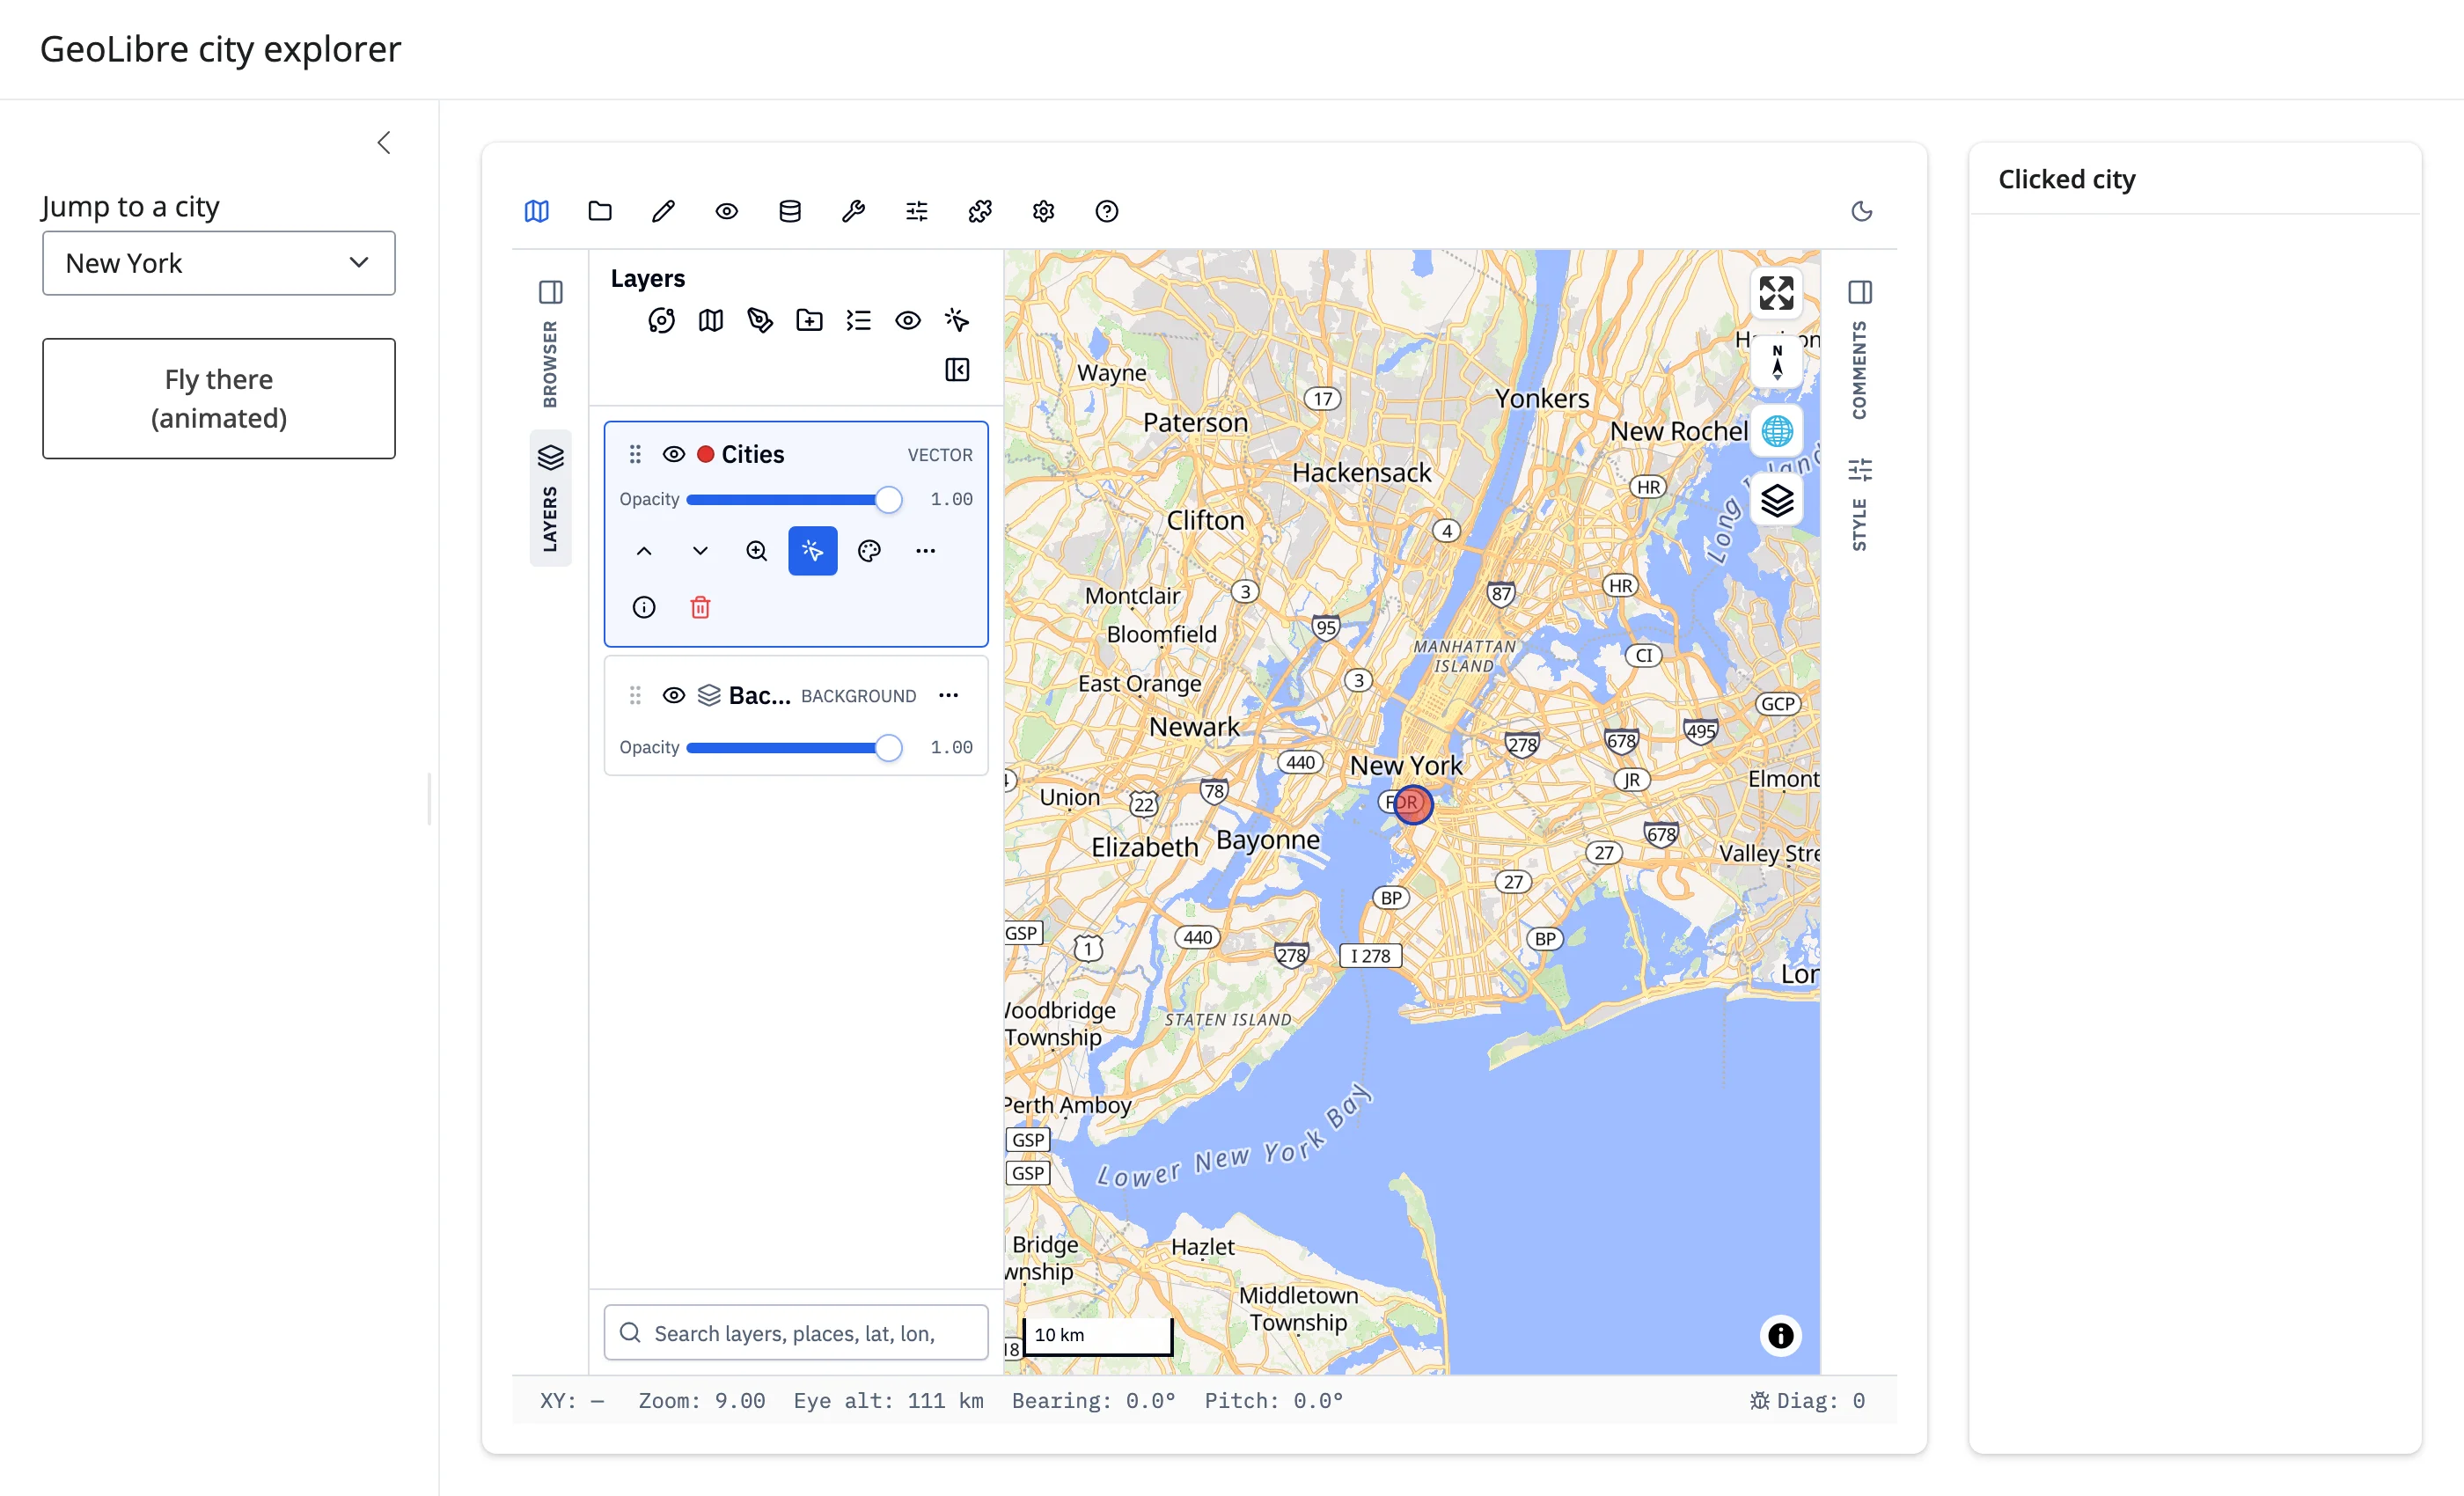
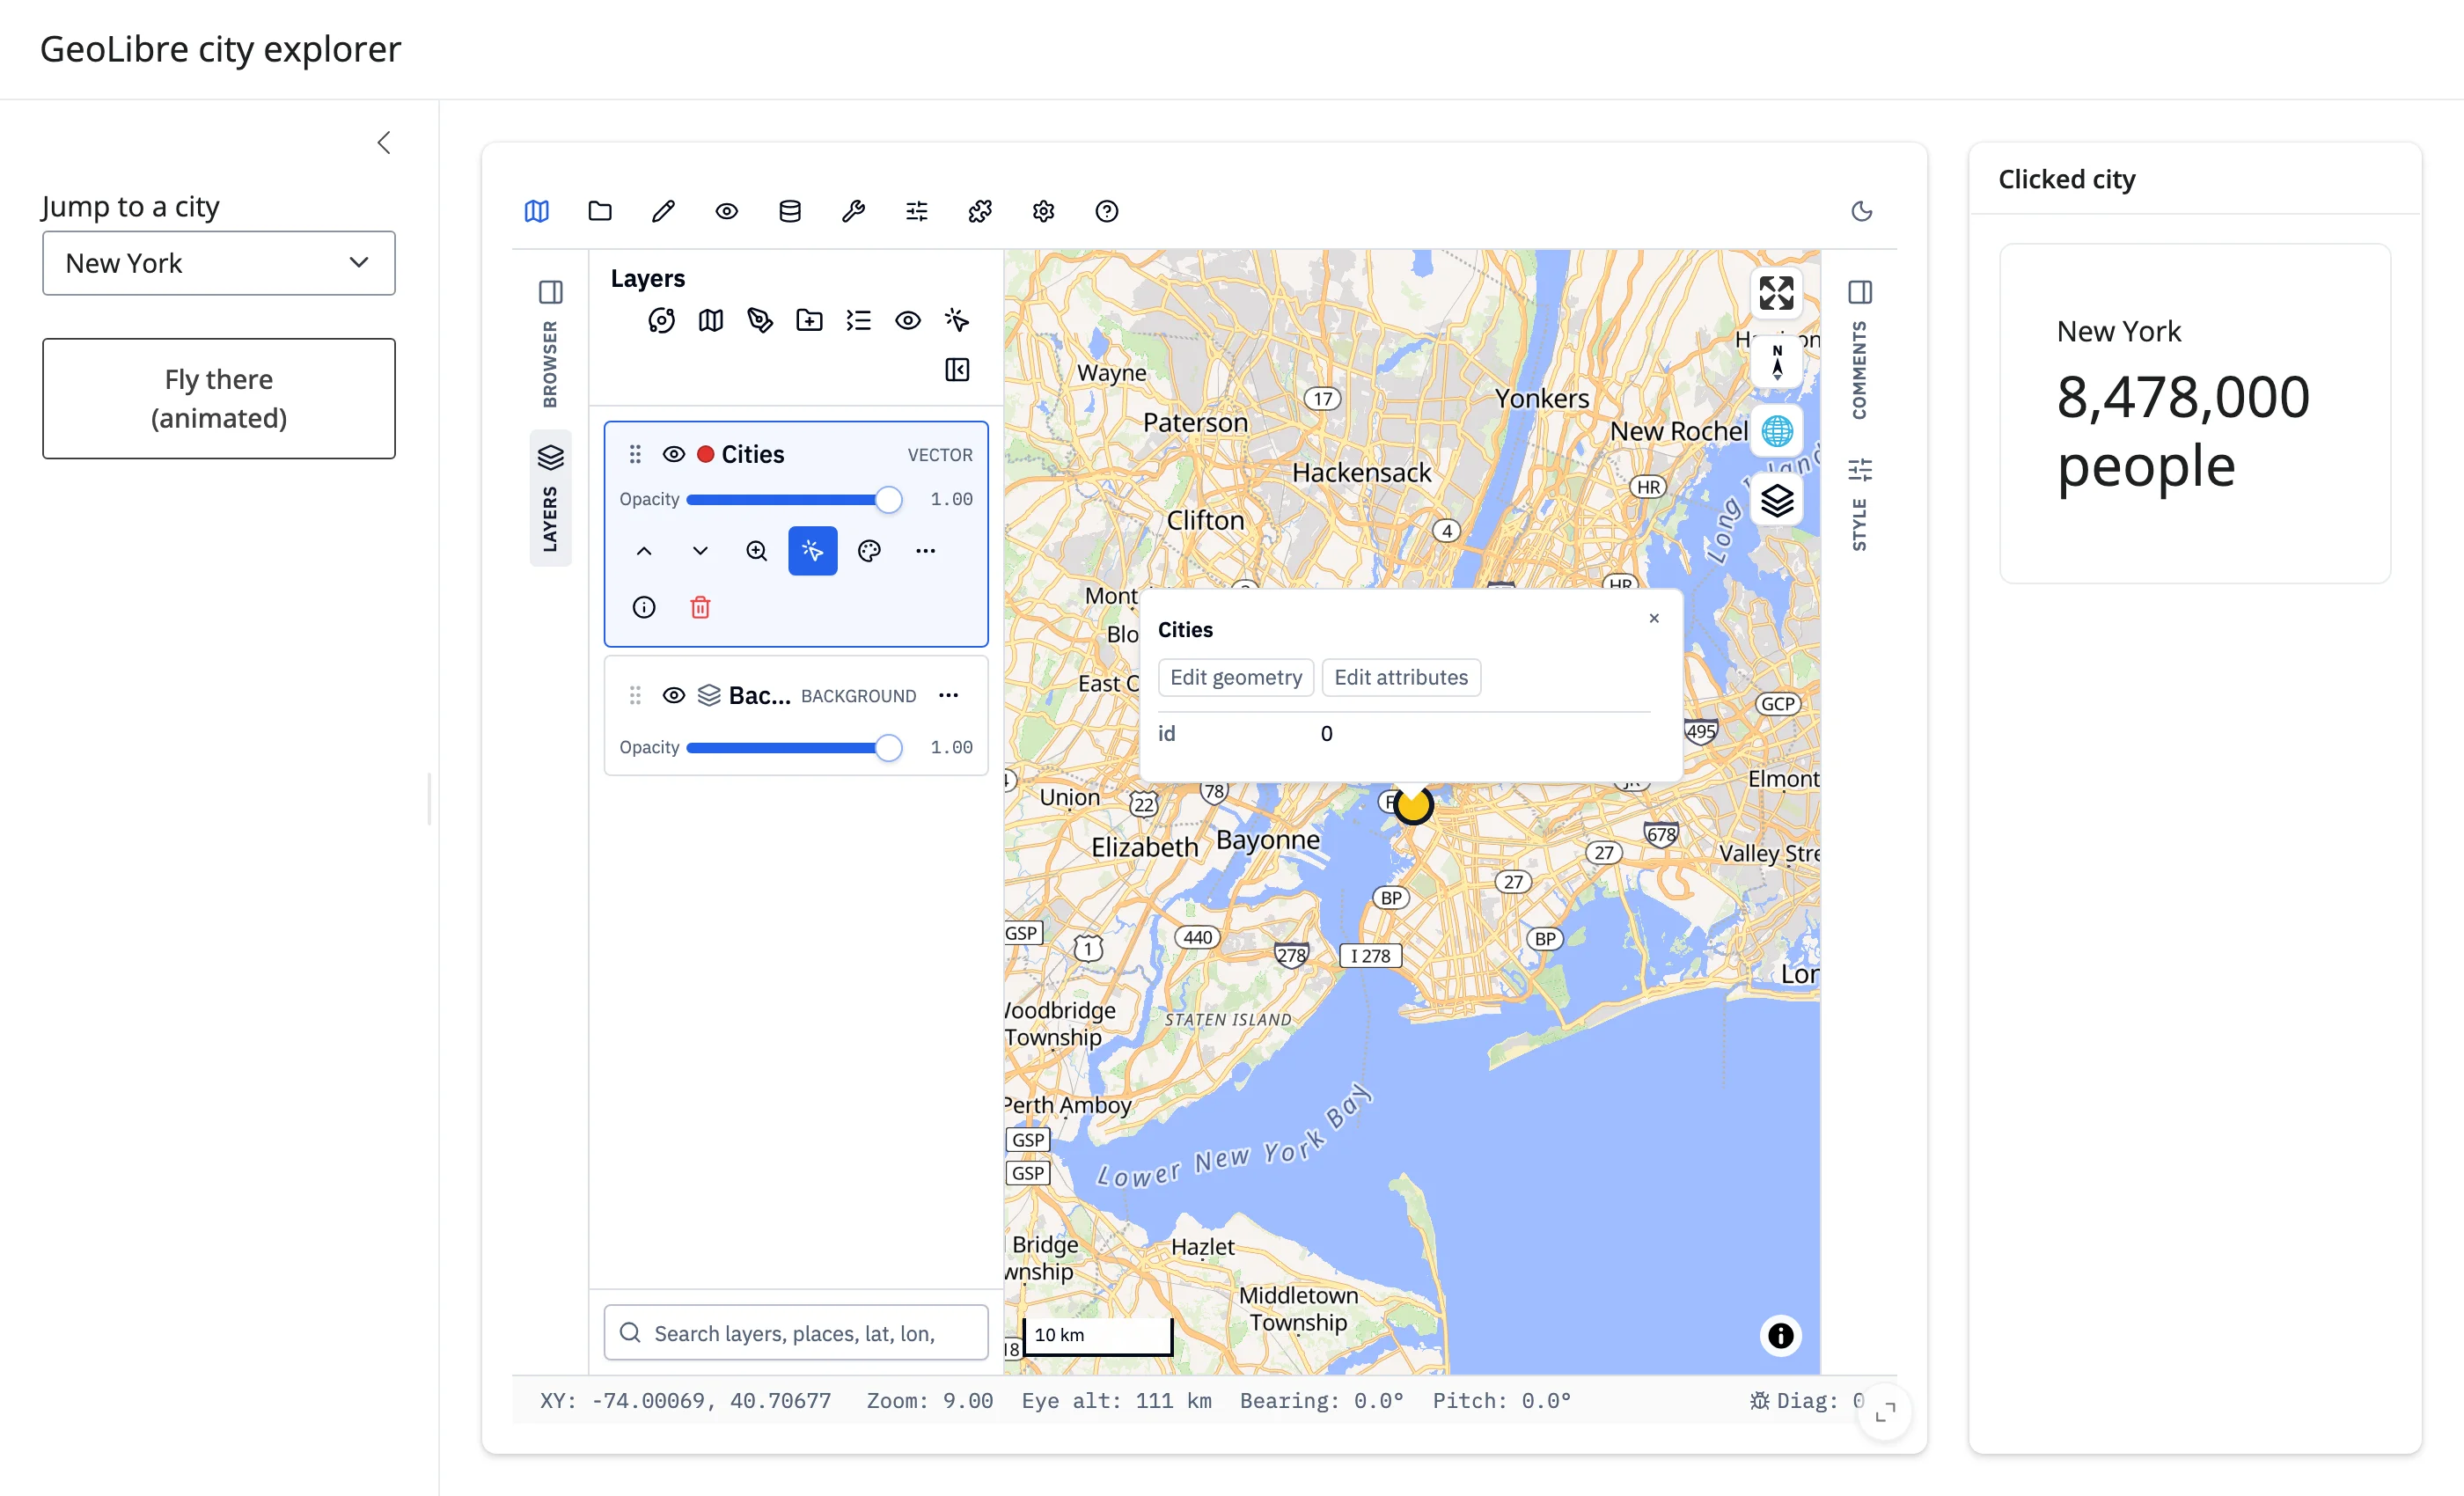
A small (~100-line) starting point: jump to a city instantly via set_center(), fly there with an animation via the fly_to_async()/extended_task pattern, or click a marker for its population.
showcase_density_dashboard.py
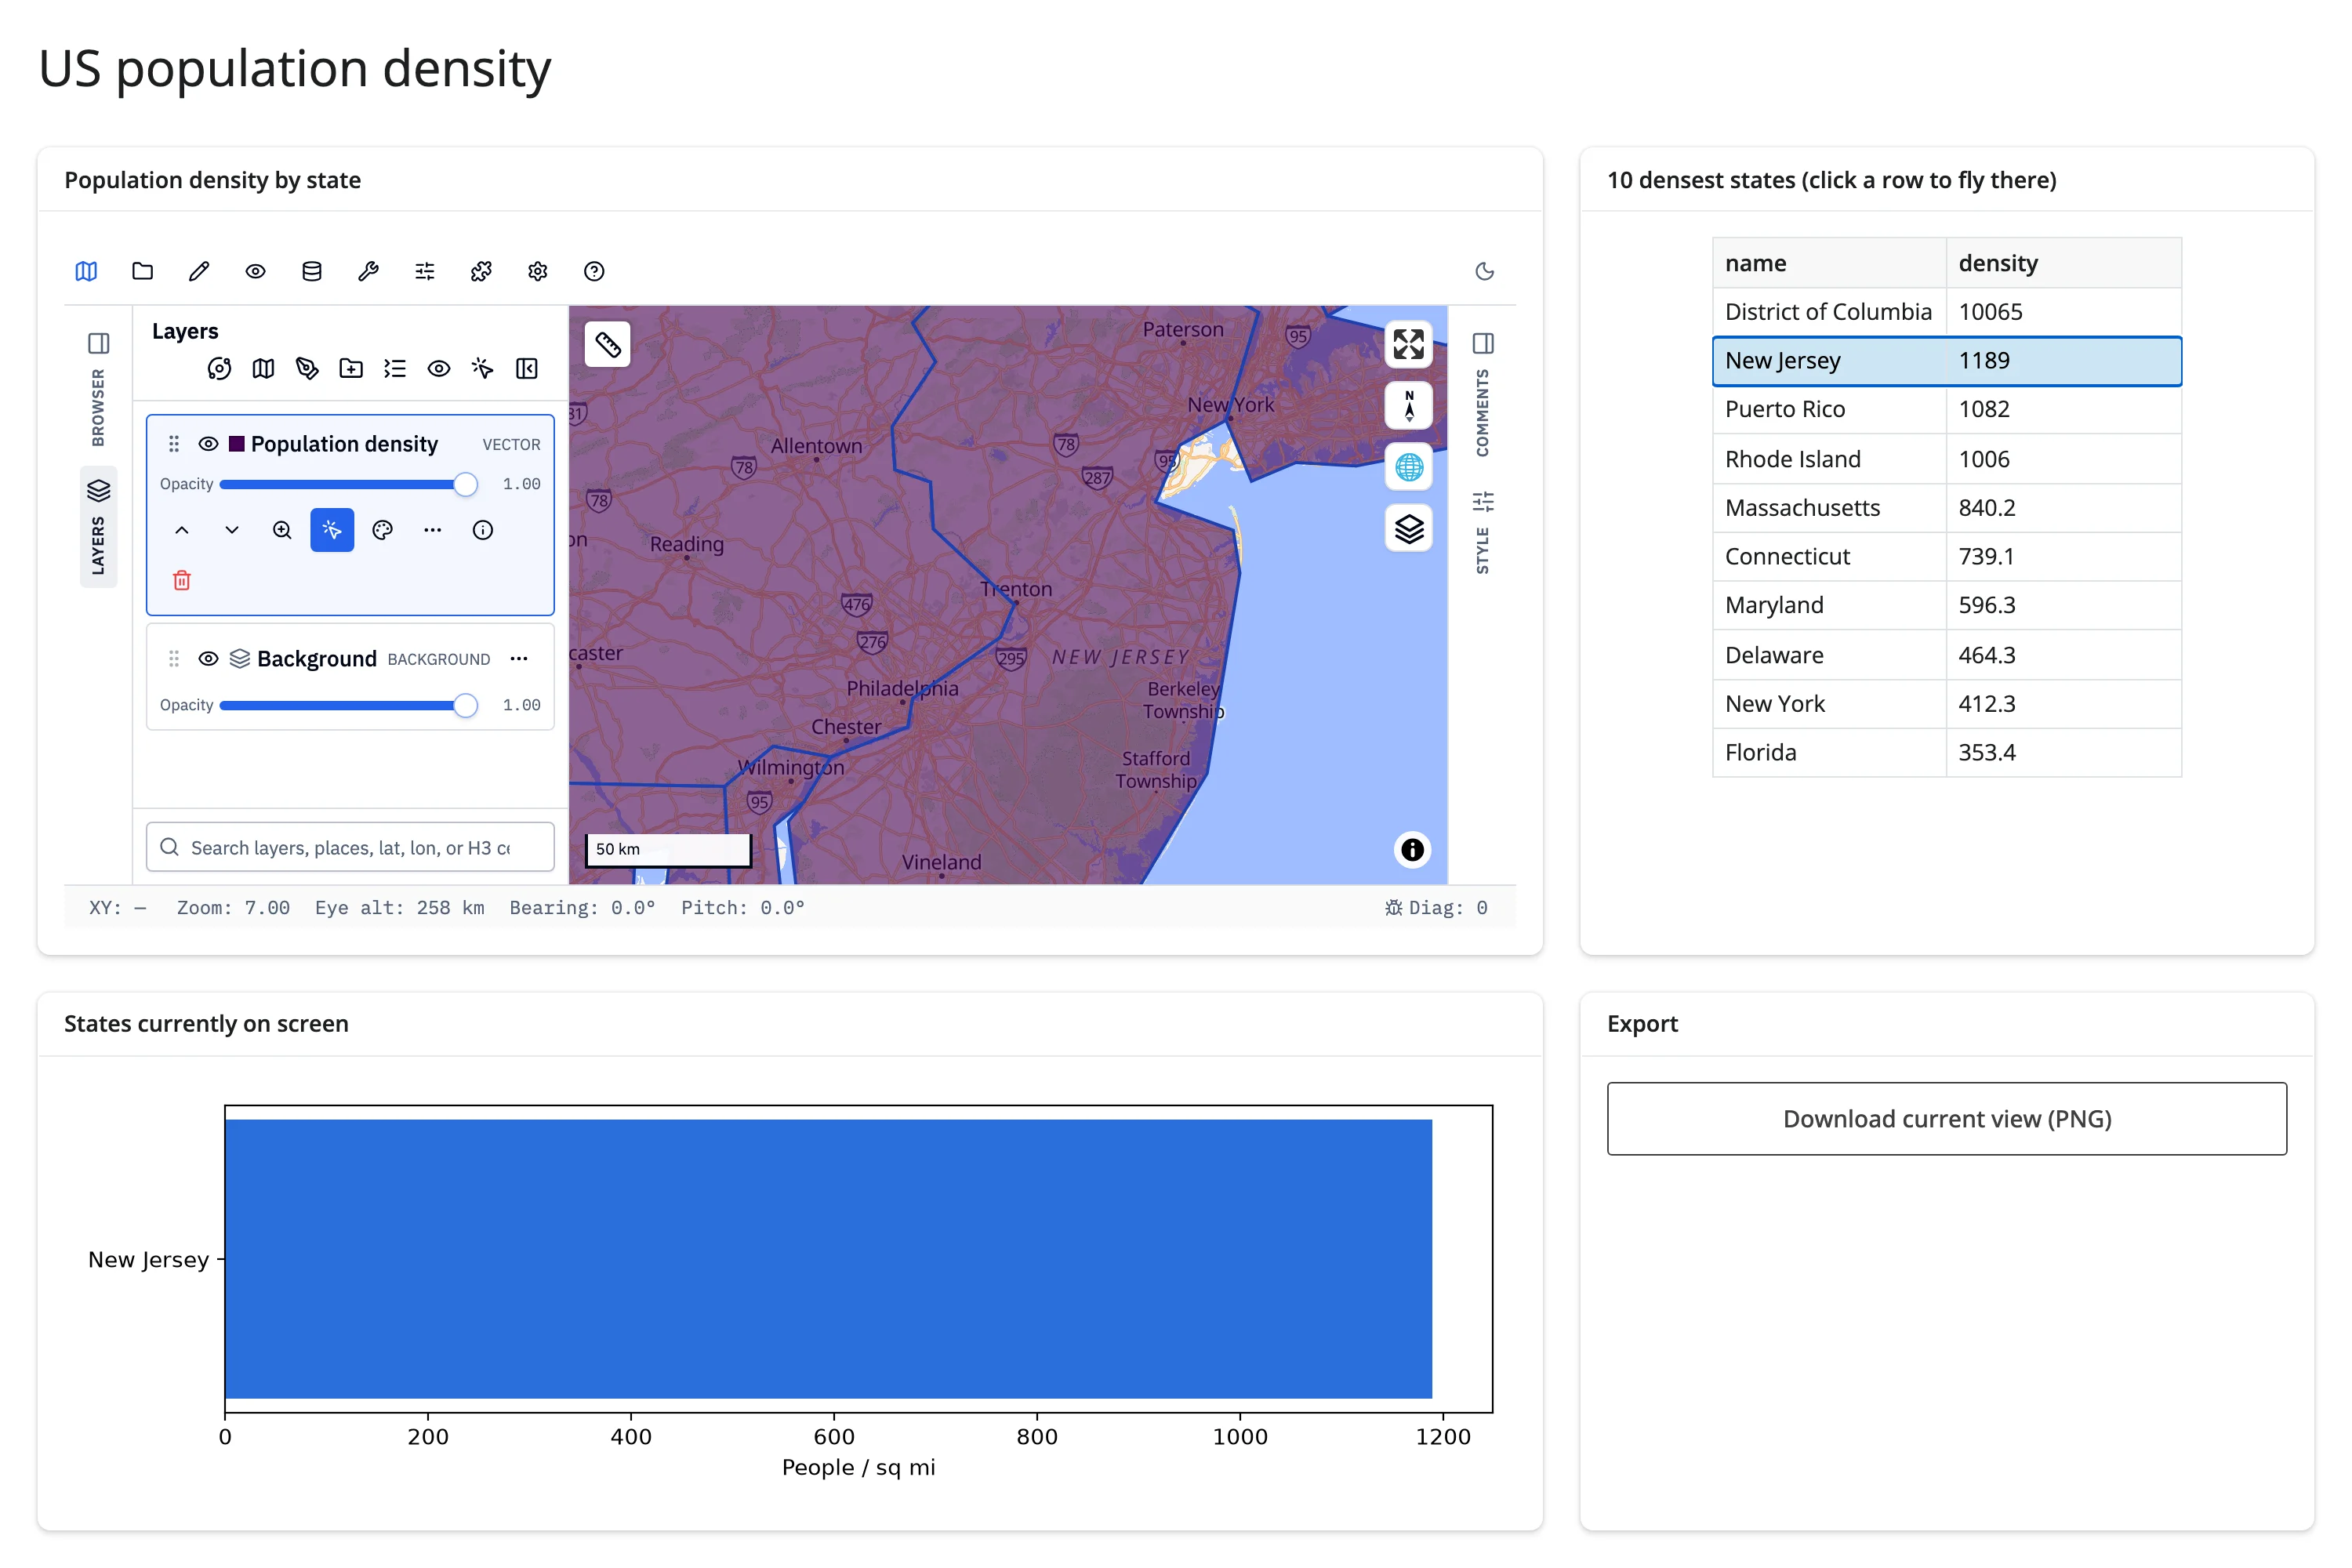
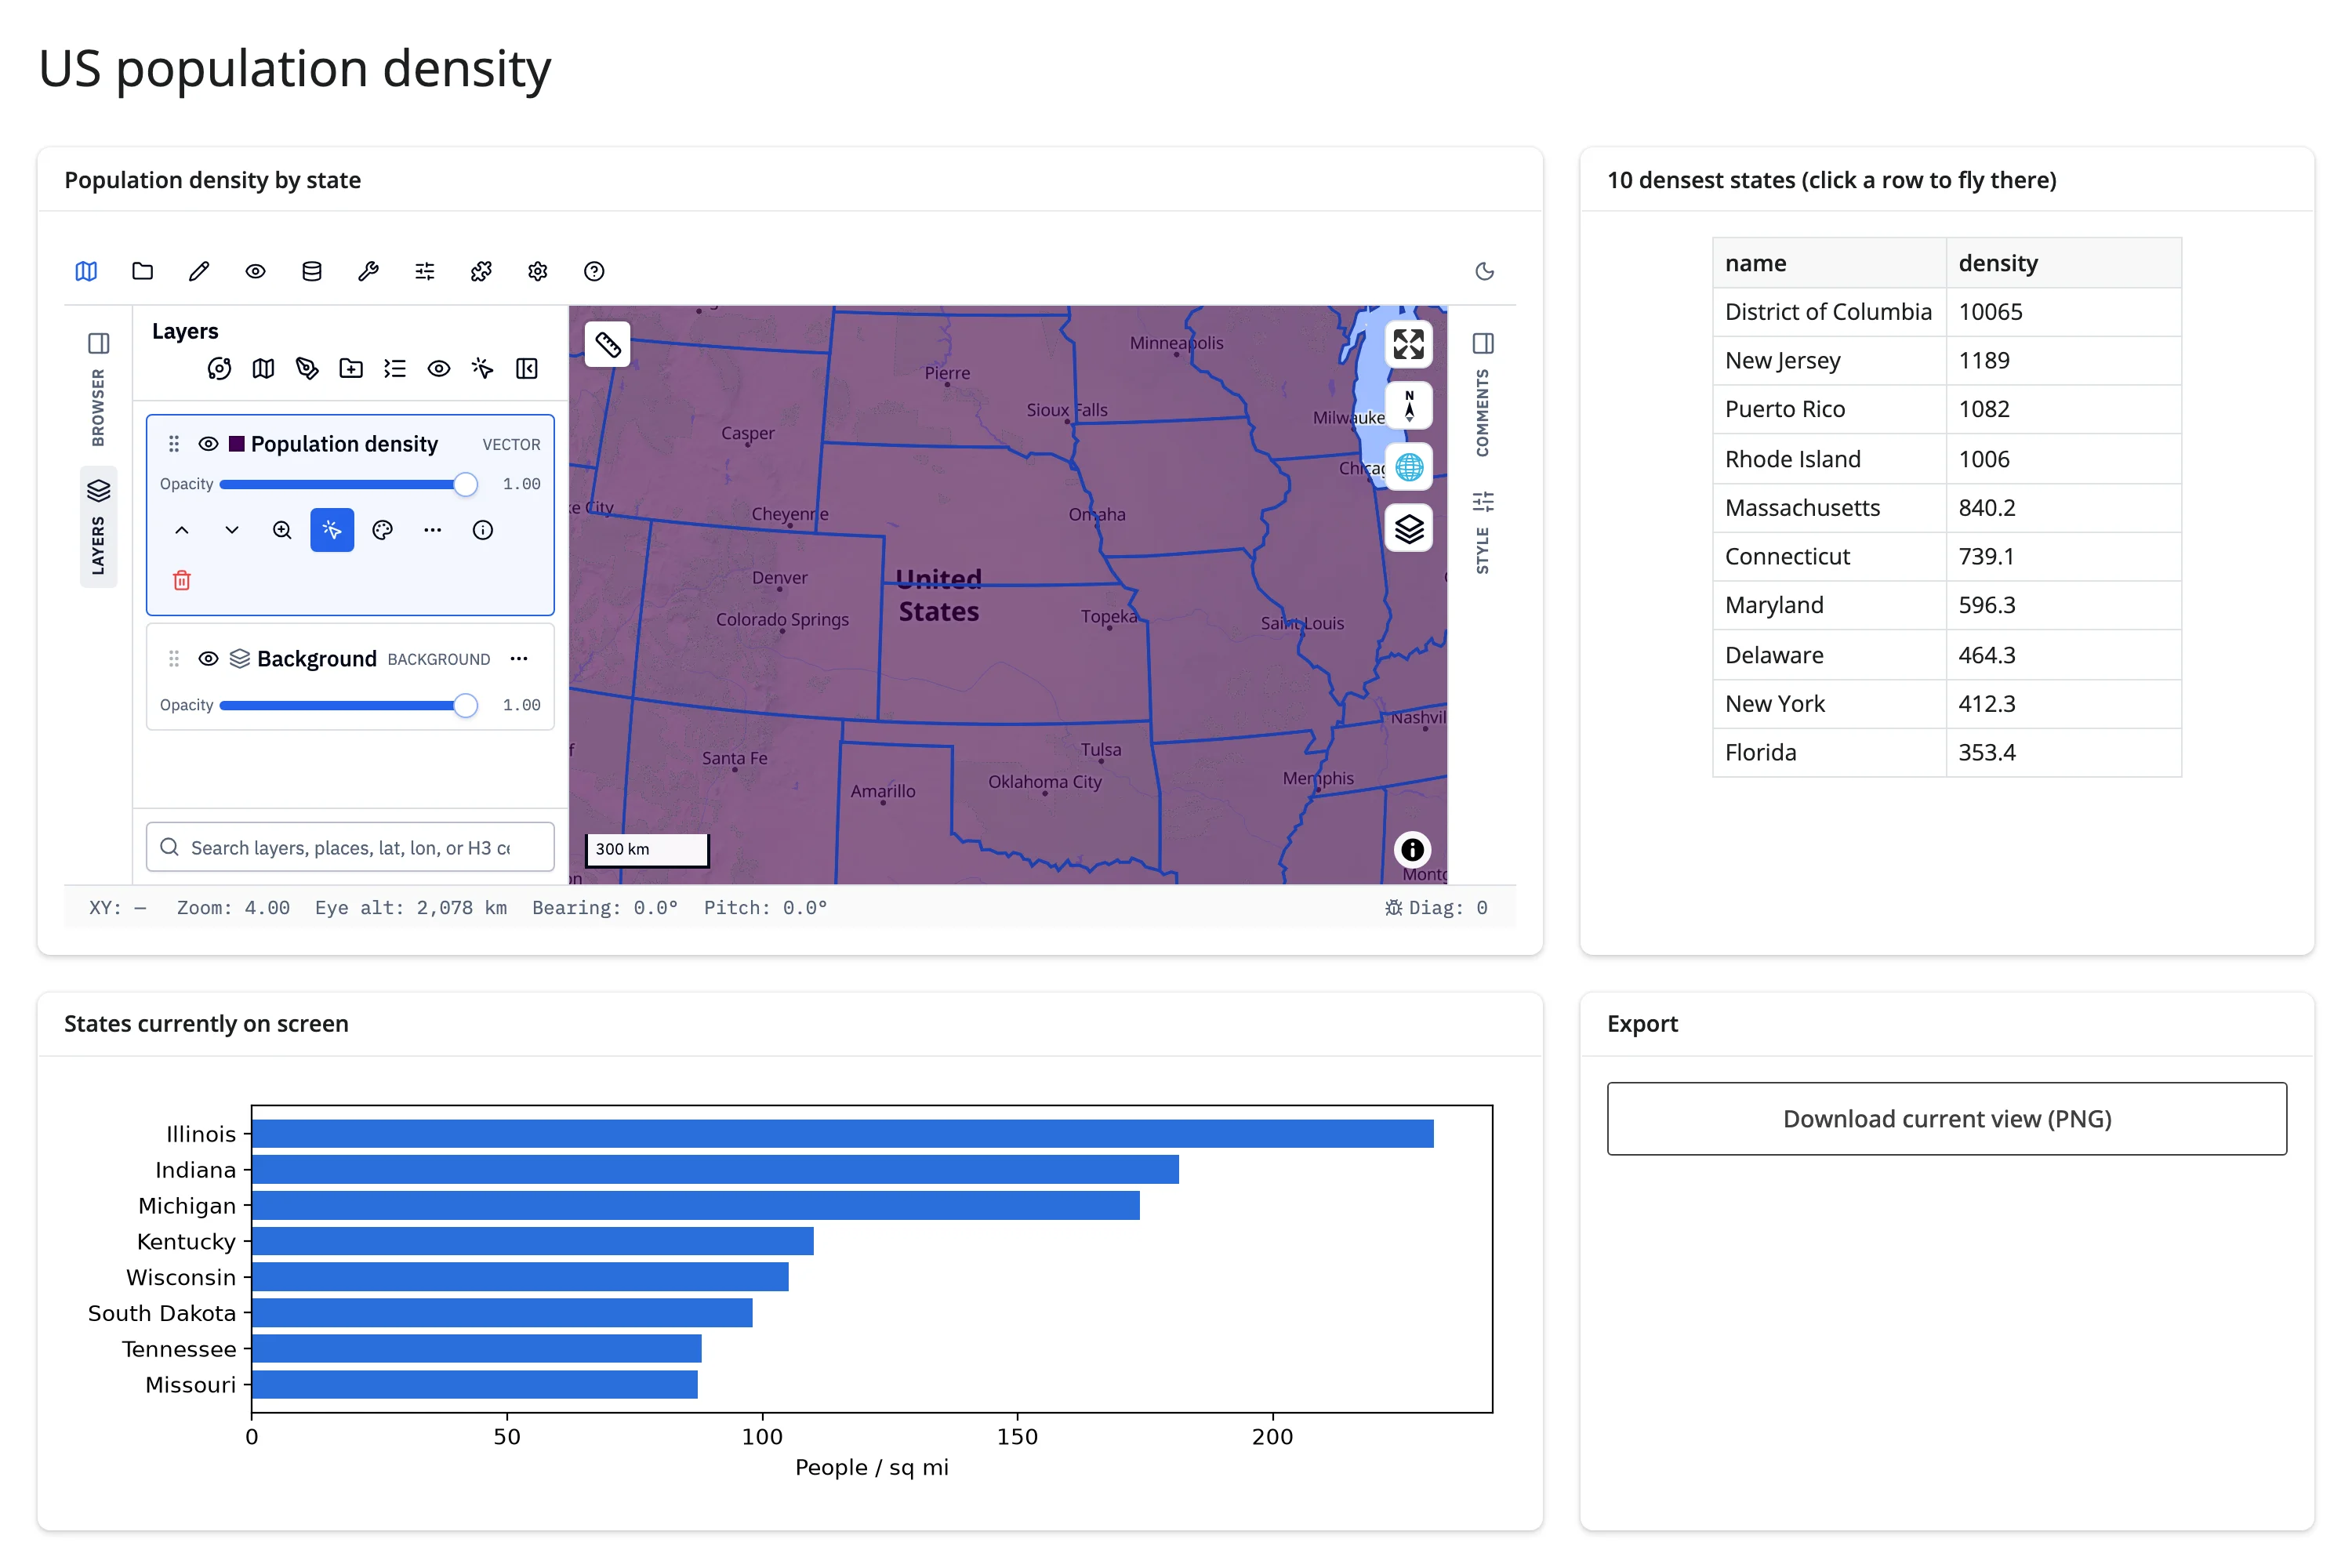
A fuller dashboard: a styled population-density choropleth with a configured click popup and the built-in Measure tool, a table of the 10 densest states that flies the map to a selection, a chart of whatever’s currently on screen, and a PNG export of the live view – combining most of this guide’s patterns into one app.
Learn more
- GeoLibre documentation
- GeoLibre on GitHub (maintained by the same author as leafmap)
- Related guides in this roster: maplibre (lightweight, fully programmatic MapLibre maps with accessors), leafmap (a multi-backend high-level wrapper, including an ipyleaflet backend with its own accessors), lonboard (GPU-accelerated large-scale point/polygon rendering), ipyleaflet (a lighter Leaflet-based map with accessors)