reactable
reactable (reactable-py) is the Python port of R’s reactable package, maintained by Michael Chow. It wraps a mature, widely-used React table component (via ipyreact) with a declarative Python API: you describe columns, formatting, grouping, and styling as plain dataclasses, and the table handles sorting, per-column and global filtering, searching, pagination, row selection, grouping with aggregation, expandable detail rows, column groups, footers, and themes – all client-side, so interacting with the table never round-trips to the server.
render_reactable accepts either a reactable.Reactable (a props dataclass; the usual choice) or the reactable.widgets.ReactableWidget it builds. The decorator ships the reactable stylesheet automatically (the table is unstyled without it), sanitizes NaN/inf values in your data to nulls (reactable-py otherwise hits a hard serialization error), and treats a height= you set on Reactable(...) as an explicit height that opts out of Shiny’s fill layout.
The headline addition in this release is a set of reactive accessors – .selected_rows(), .page(), .sorted(), .filtered(), and .search() – that read the table’s live state back into Python, bridged from the same state API R’s reactable uses for Shiny.onInputChange. Nothing is sent to the server until you call one of them.
Reach for reactable when you want a fast, good-looking, feature-complete table with the least code: grouping and aggregation, expandable rows, and themeable styling are first-class here in a way they aren’t in itables. If you need spreadsheet-style cell-block selection, in-cell bars with no custom JS, or editable cells, see ipydatagrid instead; for aggregation-first exploration of large (hundreds of thousands of rows) datasets, see perspective.
Installation
pip install 'shinywidgets[reactable]'Quick start
A searchable, filterable table in a handful of lines. 01_quickstart.py:
from reactable import ColFormat, Column, Reactable
from reactable.data import cars_93
from shiny.express import ui
from shinywidgets import render_reactable

ui.page_opts(title="reactable + shinywidgets", fillable=True)

cars = cars_93.to_pandas()[["manufacturer", "model", "type", "price", "mpg_city"]]

with ui.card(full_screen=True):

    @render_reactable
    def tbl():
        return Reactable(
            cars,
            columns={"price": Column(format=ColFormat(prefix="$", digits=1))},
            searchable=True,
            filterable=True,
            highlight=True,
            striped=True,
        )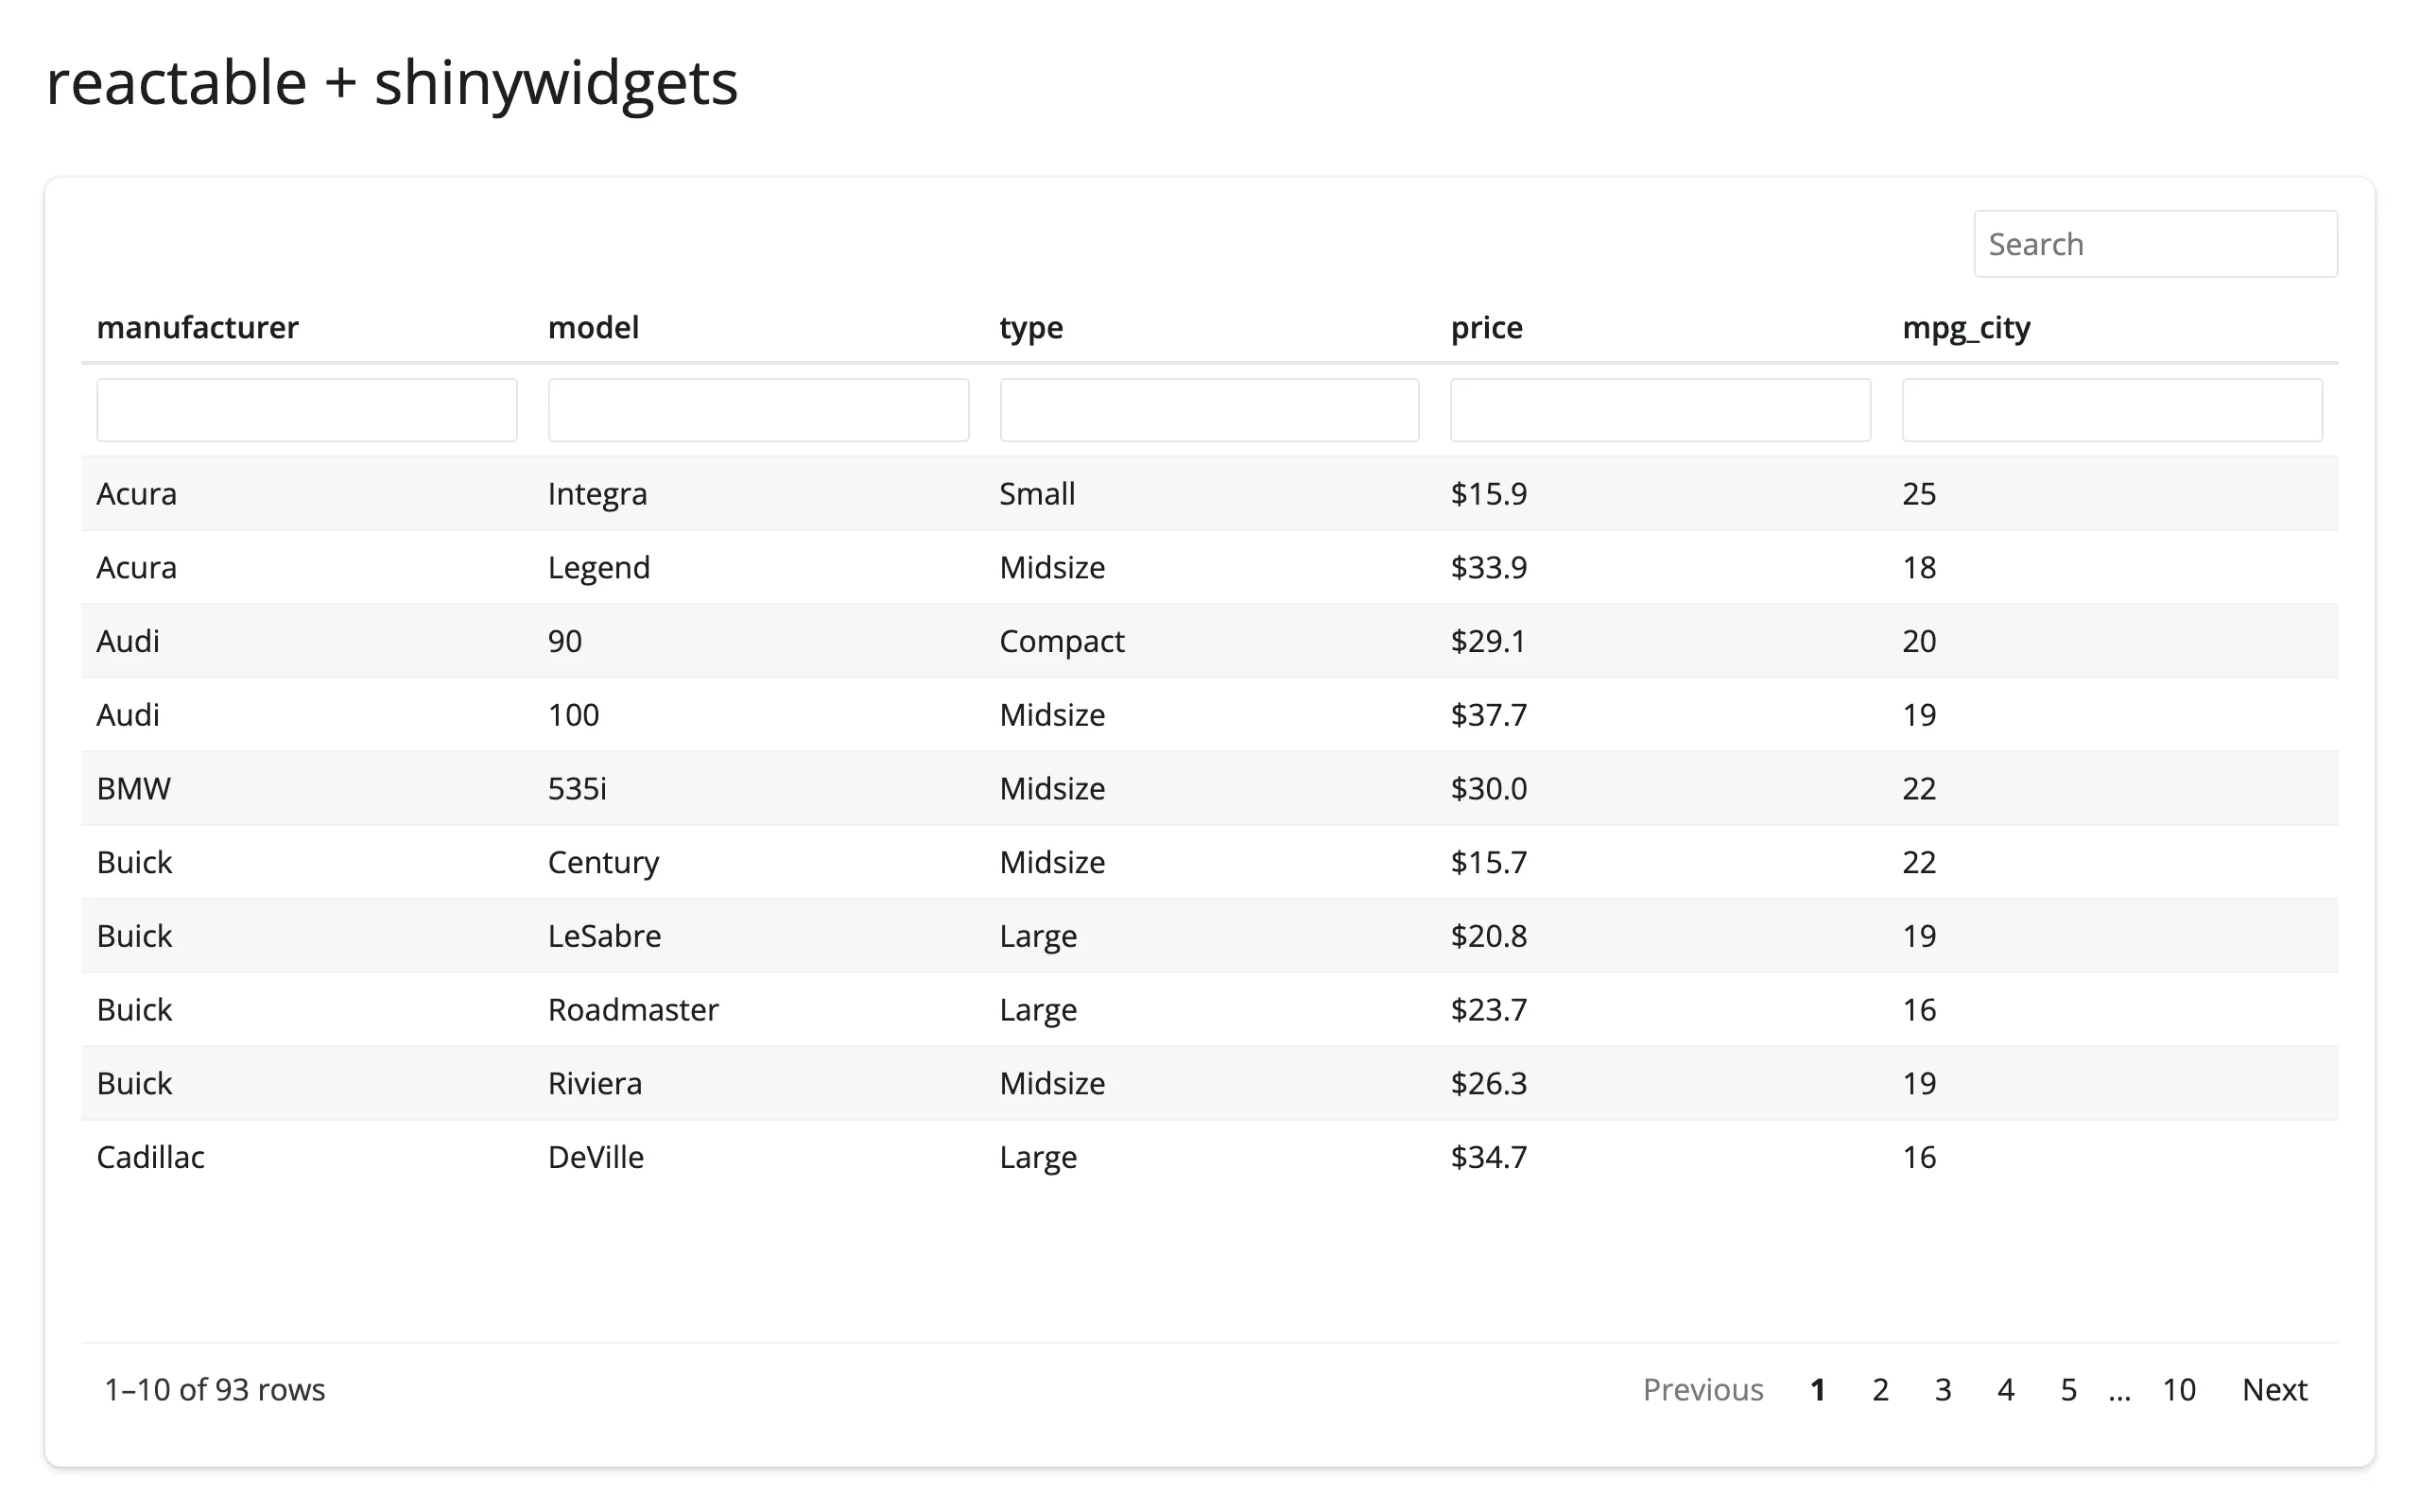
reactable.data.cars_93 ships with the package (a copy of R’s MASS::Cars93); any pandas or polars DataFrame works the same way.
What you can build
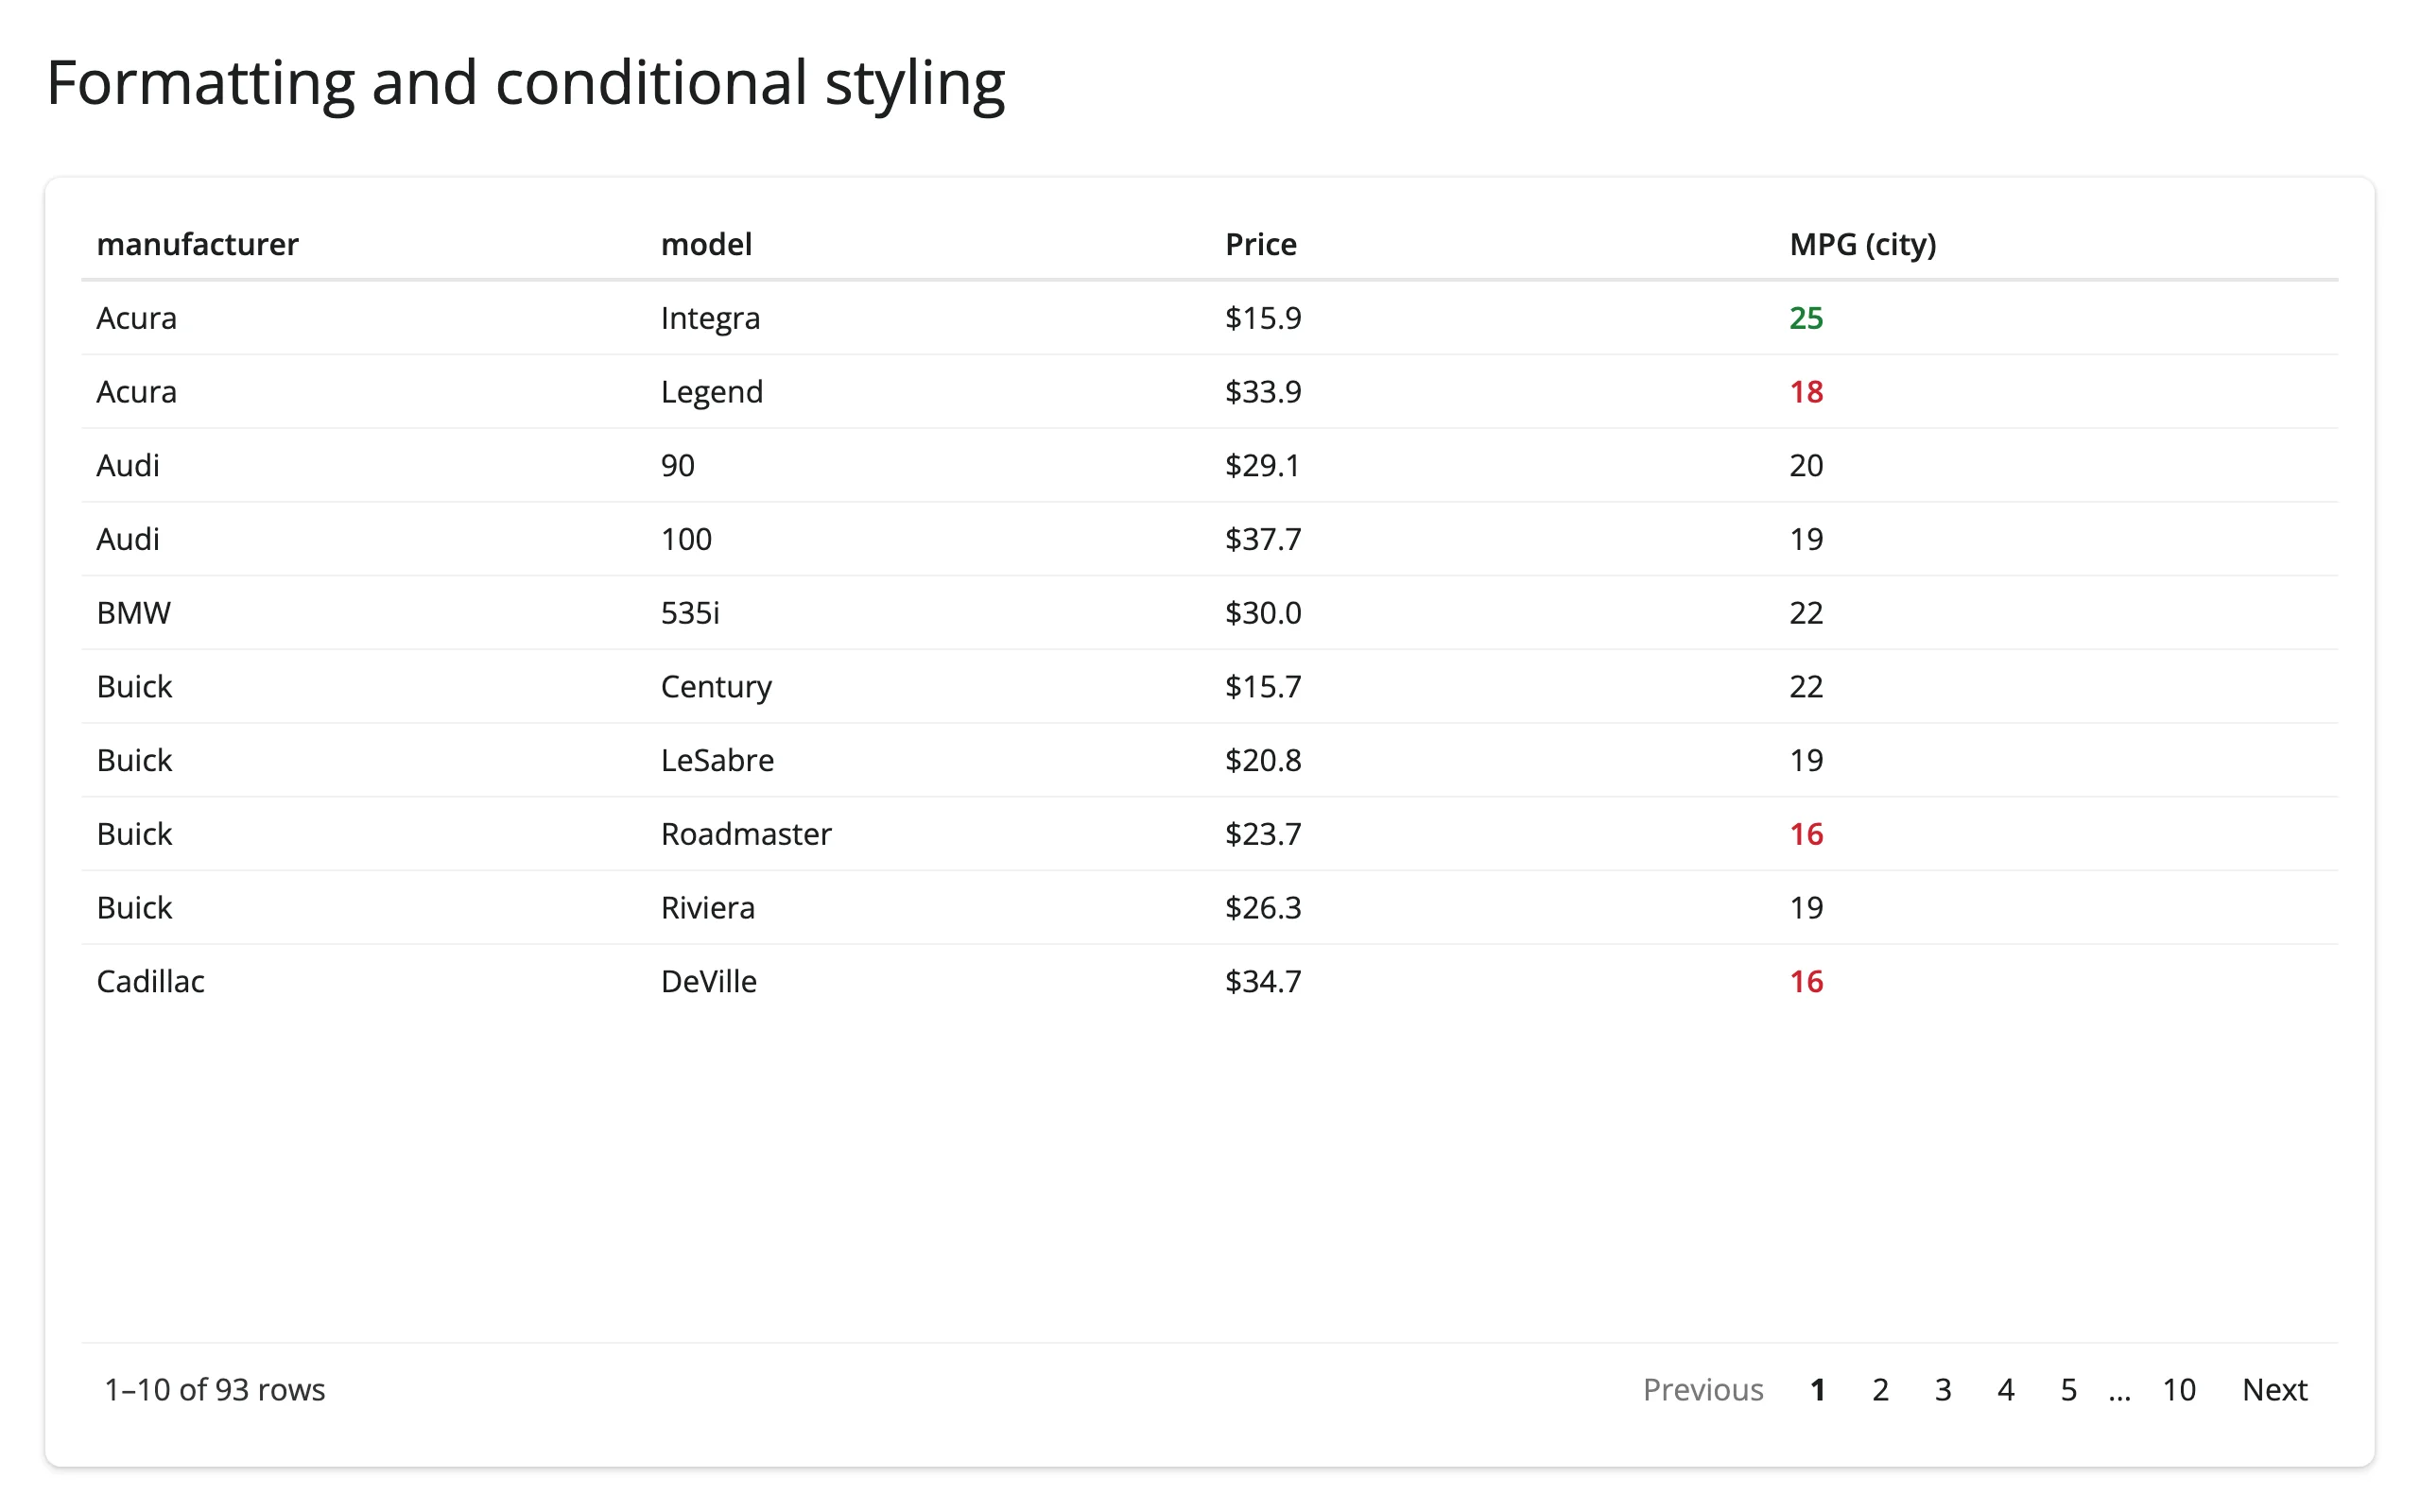
Formatting and conditional styling
ColFormat handles currency, percent, dates, and digit rounding declaratively. A Column(style=...) callback gets a CellInfo(value, row_index, column_name) per cell and returns a CSS dict, which is the usual way to highlight values without writing a custom cell renderer. 02_formatting_styling.py:
from reactable import CellInfo, ColFormat, Column, Reactable
from reactable.data import cars_93
from shiny.express import ui
from shinywidgets import render_reactable

ui.page_opts(title="Formatting and conditional styling", fillable=True)

cars = cars_93.to_pandas()[["manufacturer", "model", "price", "mpg_city"]]


def mpg_style(info: CellInfo) -> dict[str, str]:
    if info.value >= 25:
        return {"color": "#1a7f37", "fontWeight": "600"}
    if info.value <= 18:
        return {"color": "#cf222e", "fontWeight": "600"}
    return {}


with ui.card(full_screen=True):

    @render_reactable
    def tbl():
        return Reactable(
            cars,
            columns={
                "price": Column(name="Price", format=ColFormat(prefix="$", digits=1)),
                "mpg_city": Column(name="MPG (city)", style=mpg_style),
            },
            highlight=True,
        )
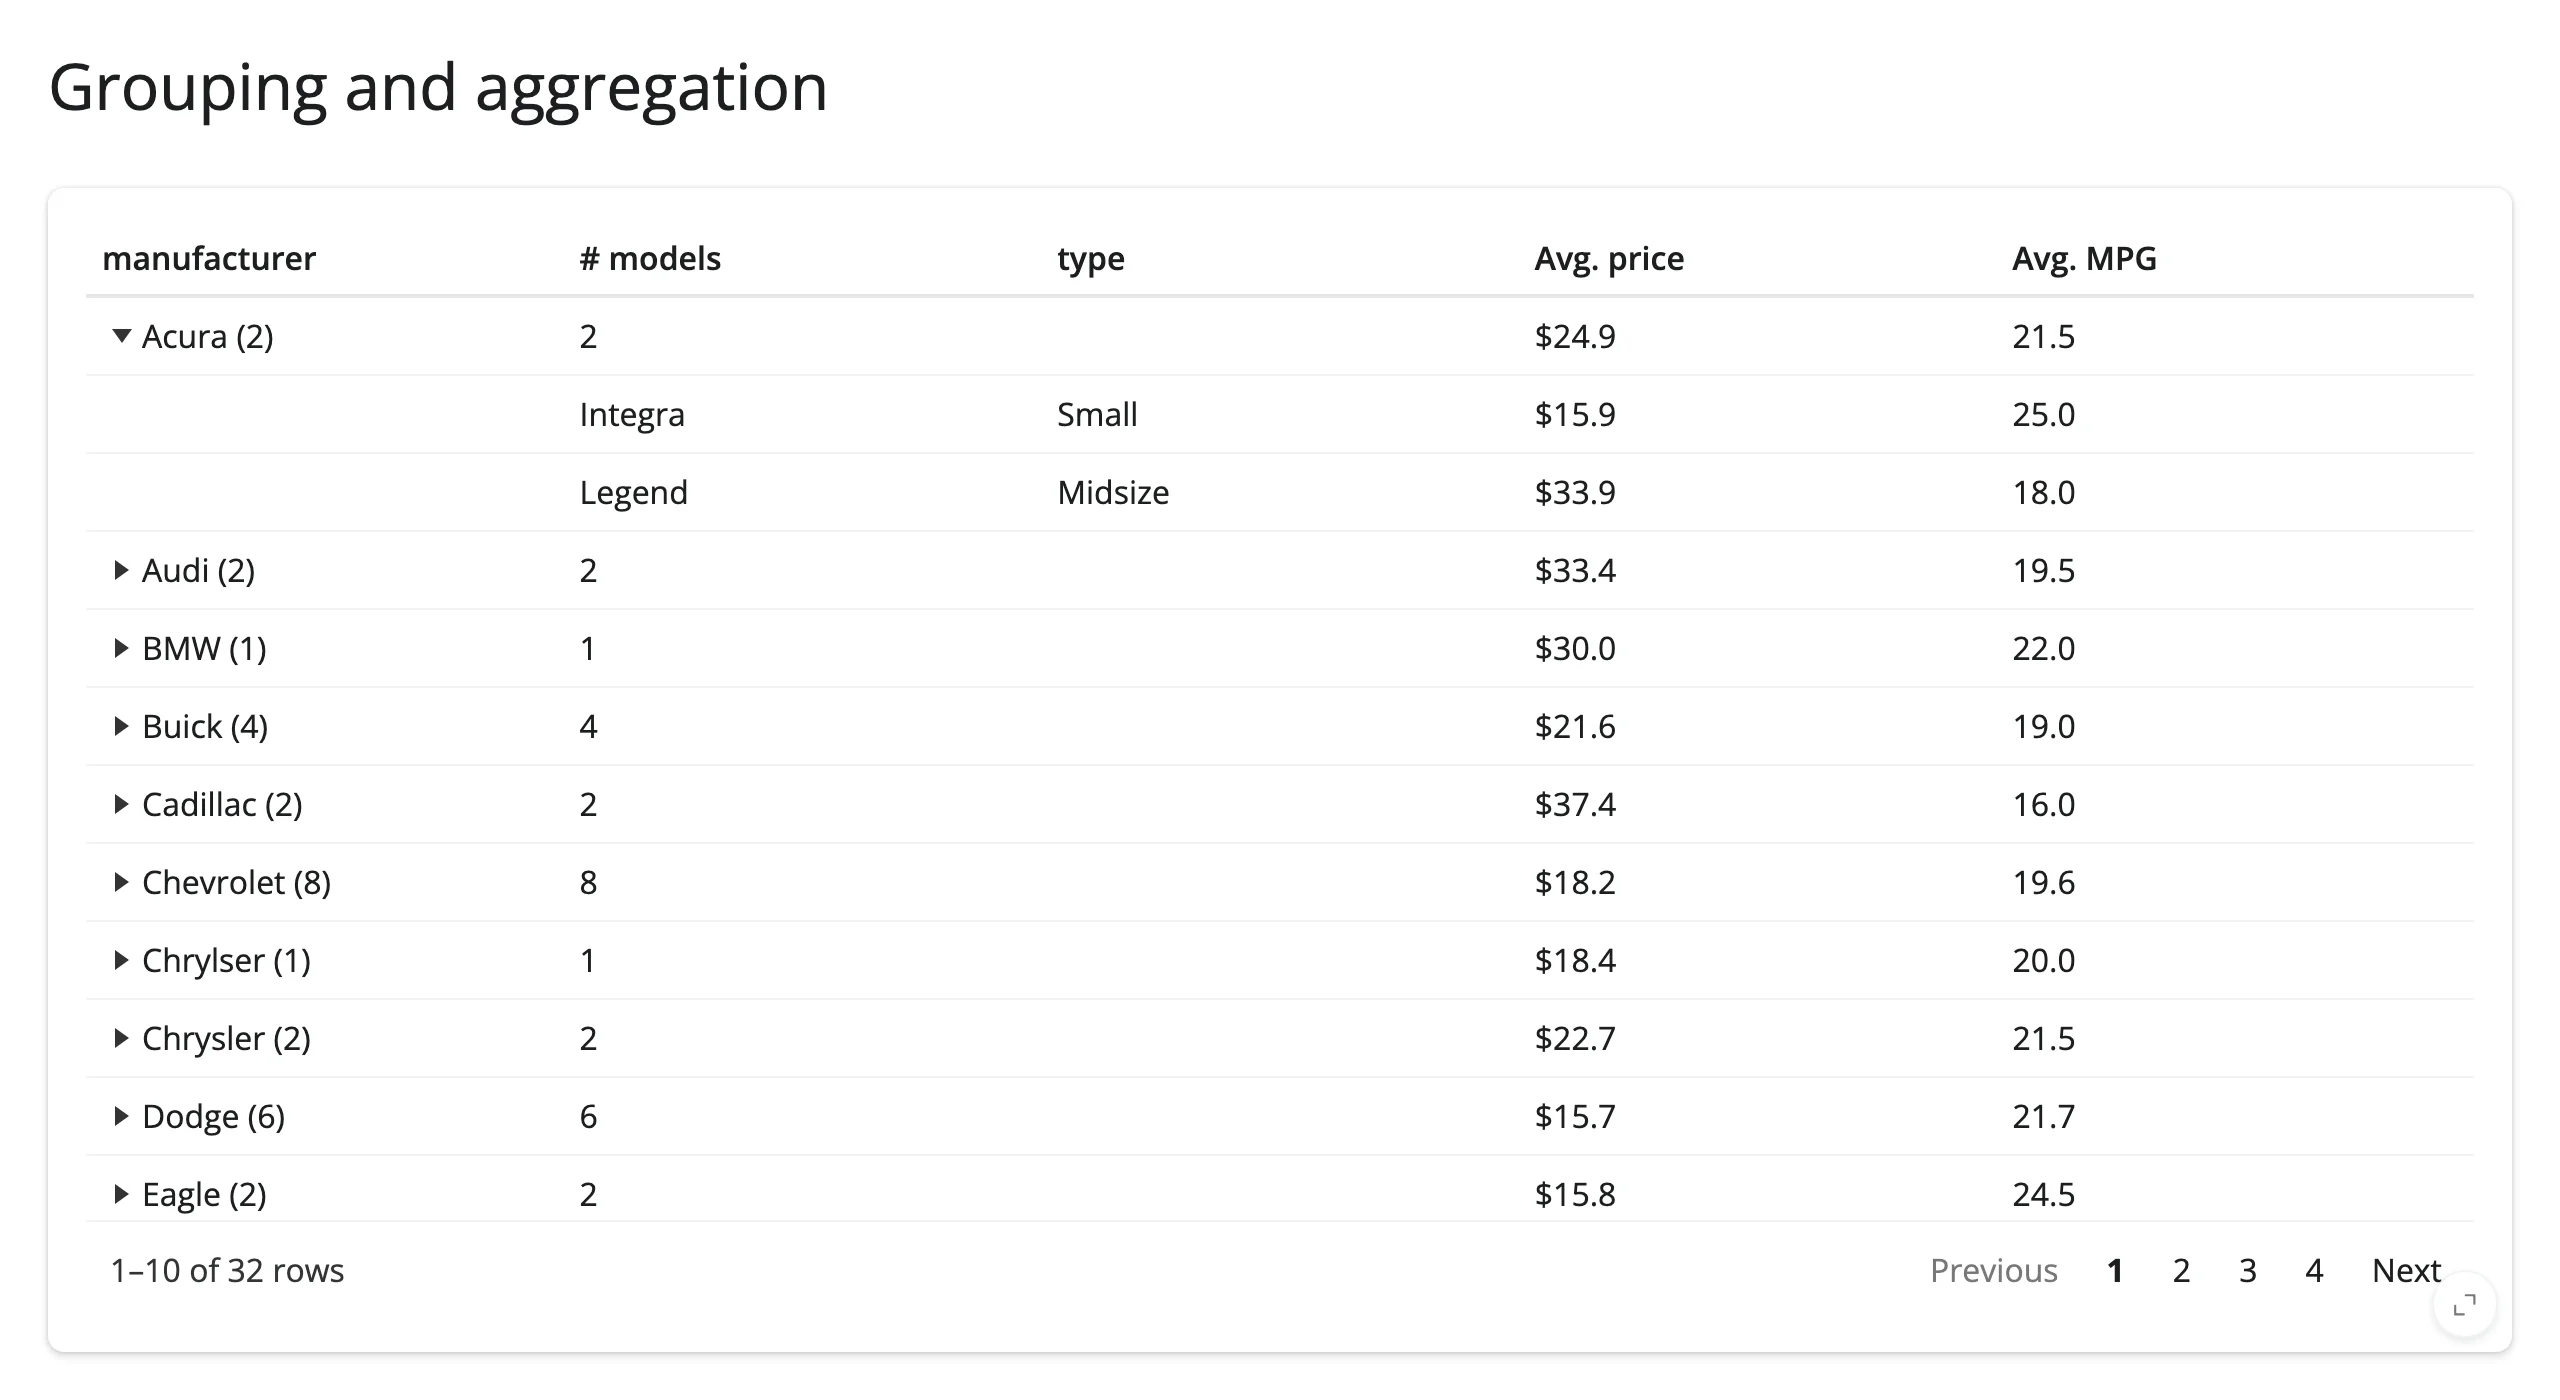
Grouping and aggregation
Set group_by on the table and aggregate= on each column you want summarized; groups collapse to one row with an expander. This is R reactable’s hallmark feature. 03_grouping.py:
from reactable import JS, ColFormat, Column, Reactable
from reactable.data import cars_93
from shiny.express import ui
from shinywidgets import render_reactable

ui.page_opts(title="Grouping and aggregation", fillable=True)

cars = cars_93.to_pandas()[["manufacturer", "model", "type", "price", "mpg_city"]]

# aggregate="mean" (and "sum"/"median") silently renders blank cells with a
# pandas DataFrame -- reactable-py's pandas column-type detection always
# reports "UNKNOWN" instead of "numeric", and those three aggregators only
# run for numeric-typed columns. A JS aggregate function sidesteps it.
mean_js = JS("values => values.reduce((a, b) => a + b, 0) / values.length")

with ui.card(full_screen=True):

    @render_reactable
    def tbl():
        return Reactable(
            cars,
            columns={
                "price": Column(
                    name="Avg. price",
                    aggregate=mean_js,
                    format=ColFormat(prefix="$", digits=1),
                ),
                "mpg_city": Column(name="Avg. MPG", aggregate=mean_js, format=ColFormat(digits=1)),
                "model": Column(name="# models", aggregate="count"),
            },
            group_by=["manufacturer"],
            default_expanded=False,
        )
See Gotchas and limitations for why mean/sum/median need the JS() form with pandas data, and when the plain string works.
Expandable row details
A details=Column(details=fn, html=True) adds an expander column; fn receives a RowInfo and returns an HTML string rendered into the expanded panel. 04_expandable_details.py:
from reactable import Column, Reactable, RowInfo
from reactable.data import cars_93
from shiny.express import ui
from shinywidgets import render_reactable
ui.page_opts(title="Expandable row details", fillable=True)
cars = cars_93.to_pandas()[
["manufacturer", "model", "price", "horsepower", "passengers", "origin"]
]
def row_detail(row: RowInfo) -> str:
car = cars.iloc[row.row_index]
return (
"<div style='padding:8px 16px'>"
f"<b>{car.manufacturer} {car.model}</b> — "
f"{car.horsepower} hp, seats {car.passengers}, built in {car.origin}."
"</div>"
)
with ui.card(full_screen=True):
@render_reactable
def tbl():
return Reactable(
cars[["manufacturer", "model", "price"]],
# The details column needs its own `html=True` to render markup
# instead of escaping it as text.
details=Column(details=row_detail, html=True),
highlight=True,
)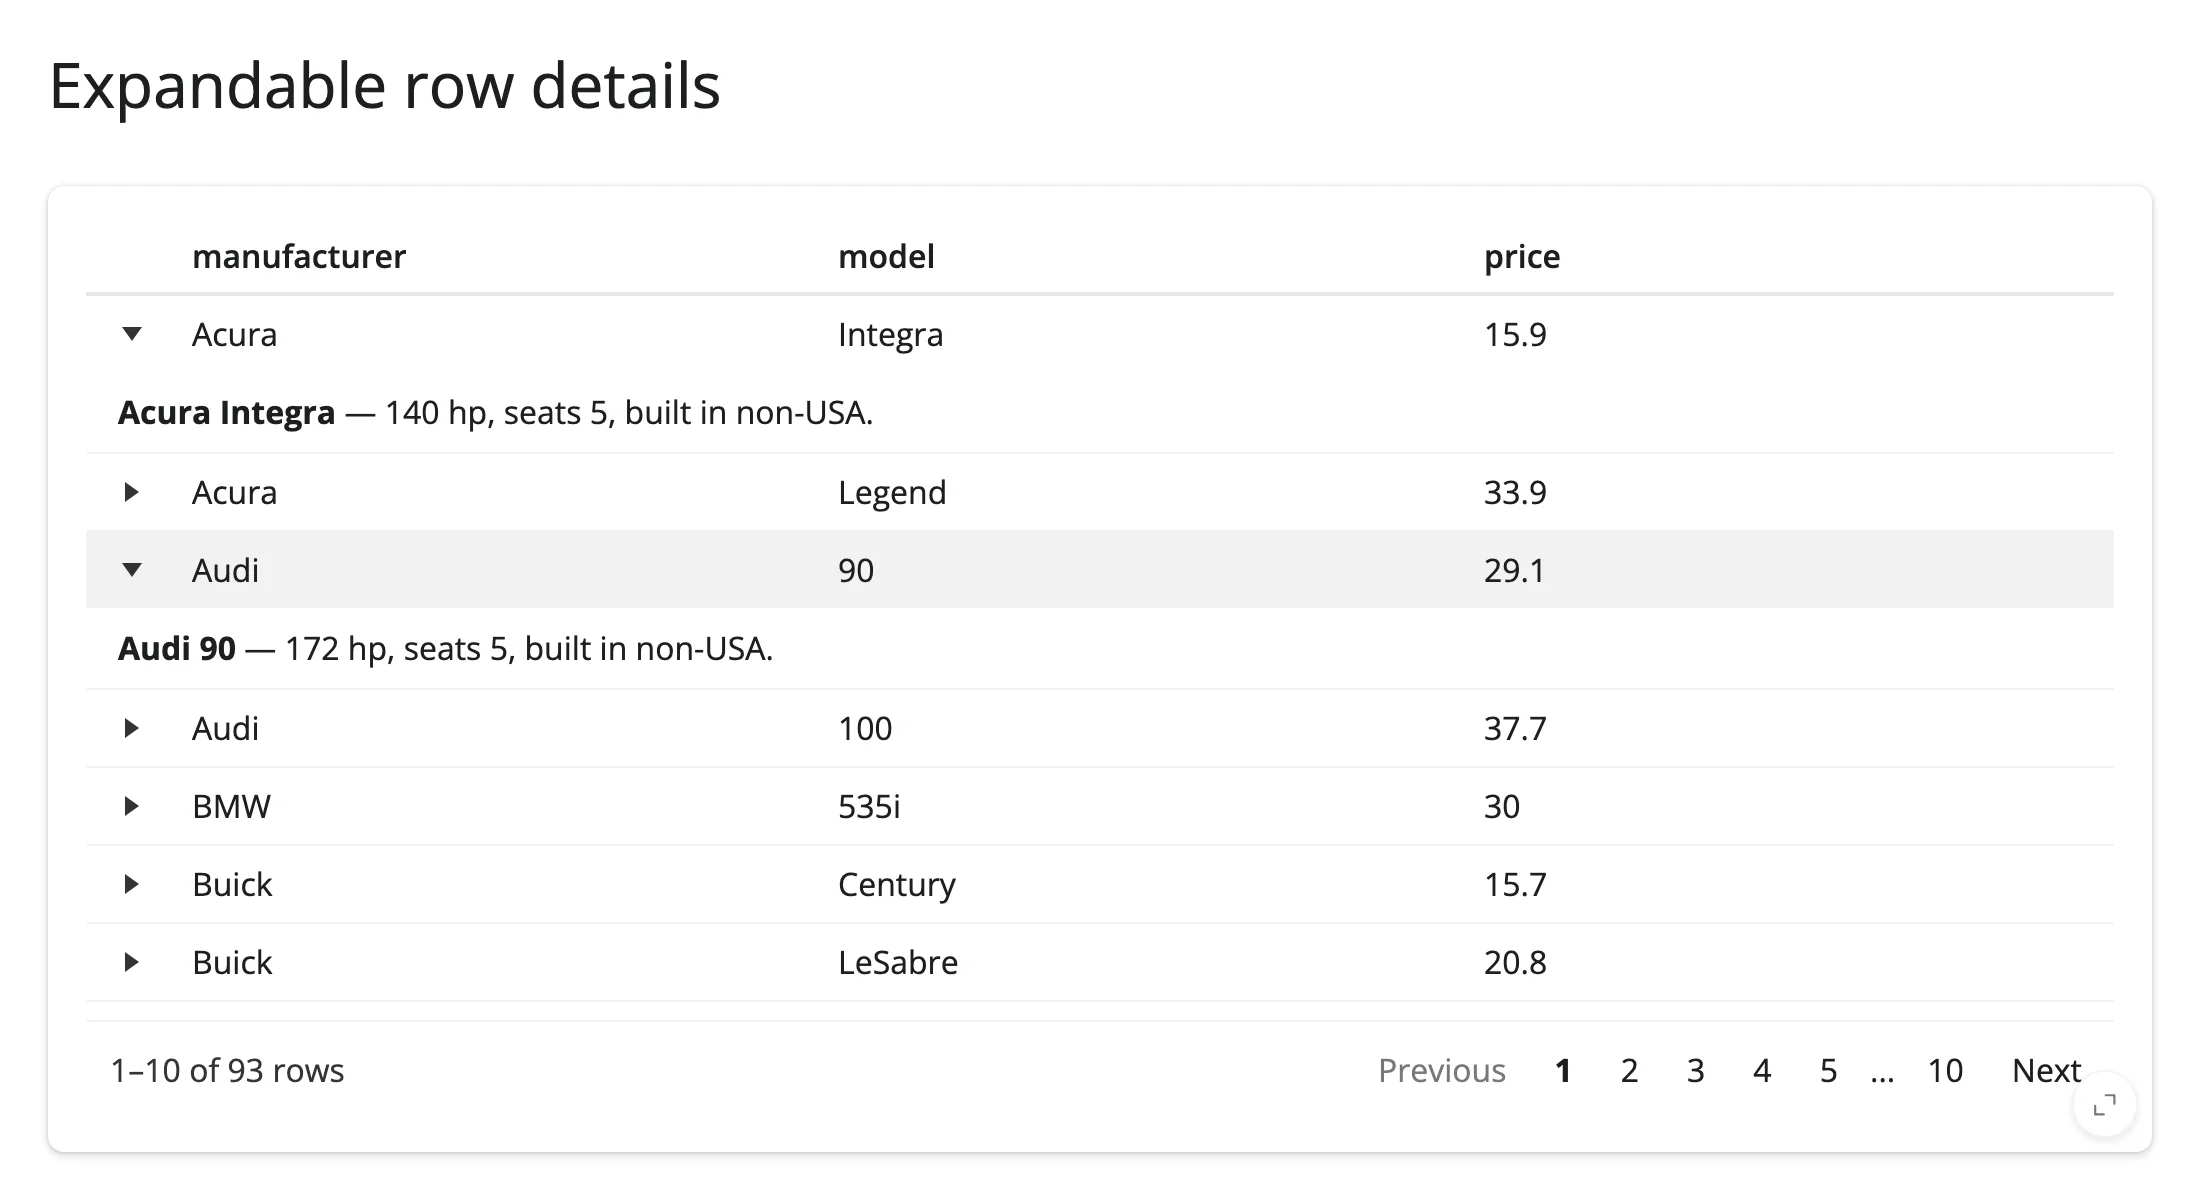
Without html=True on the details column, the markup renders as literal escaped text (see Gotchas and limitations).
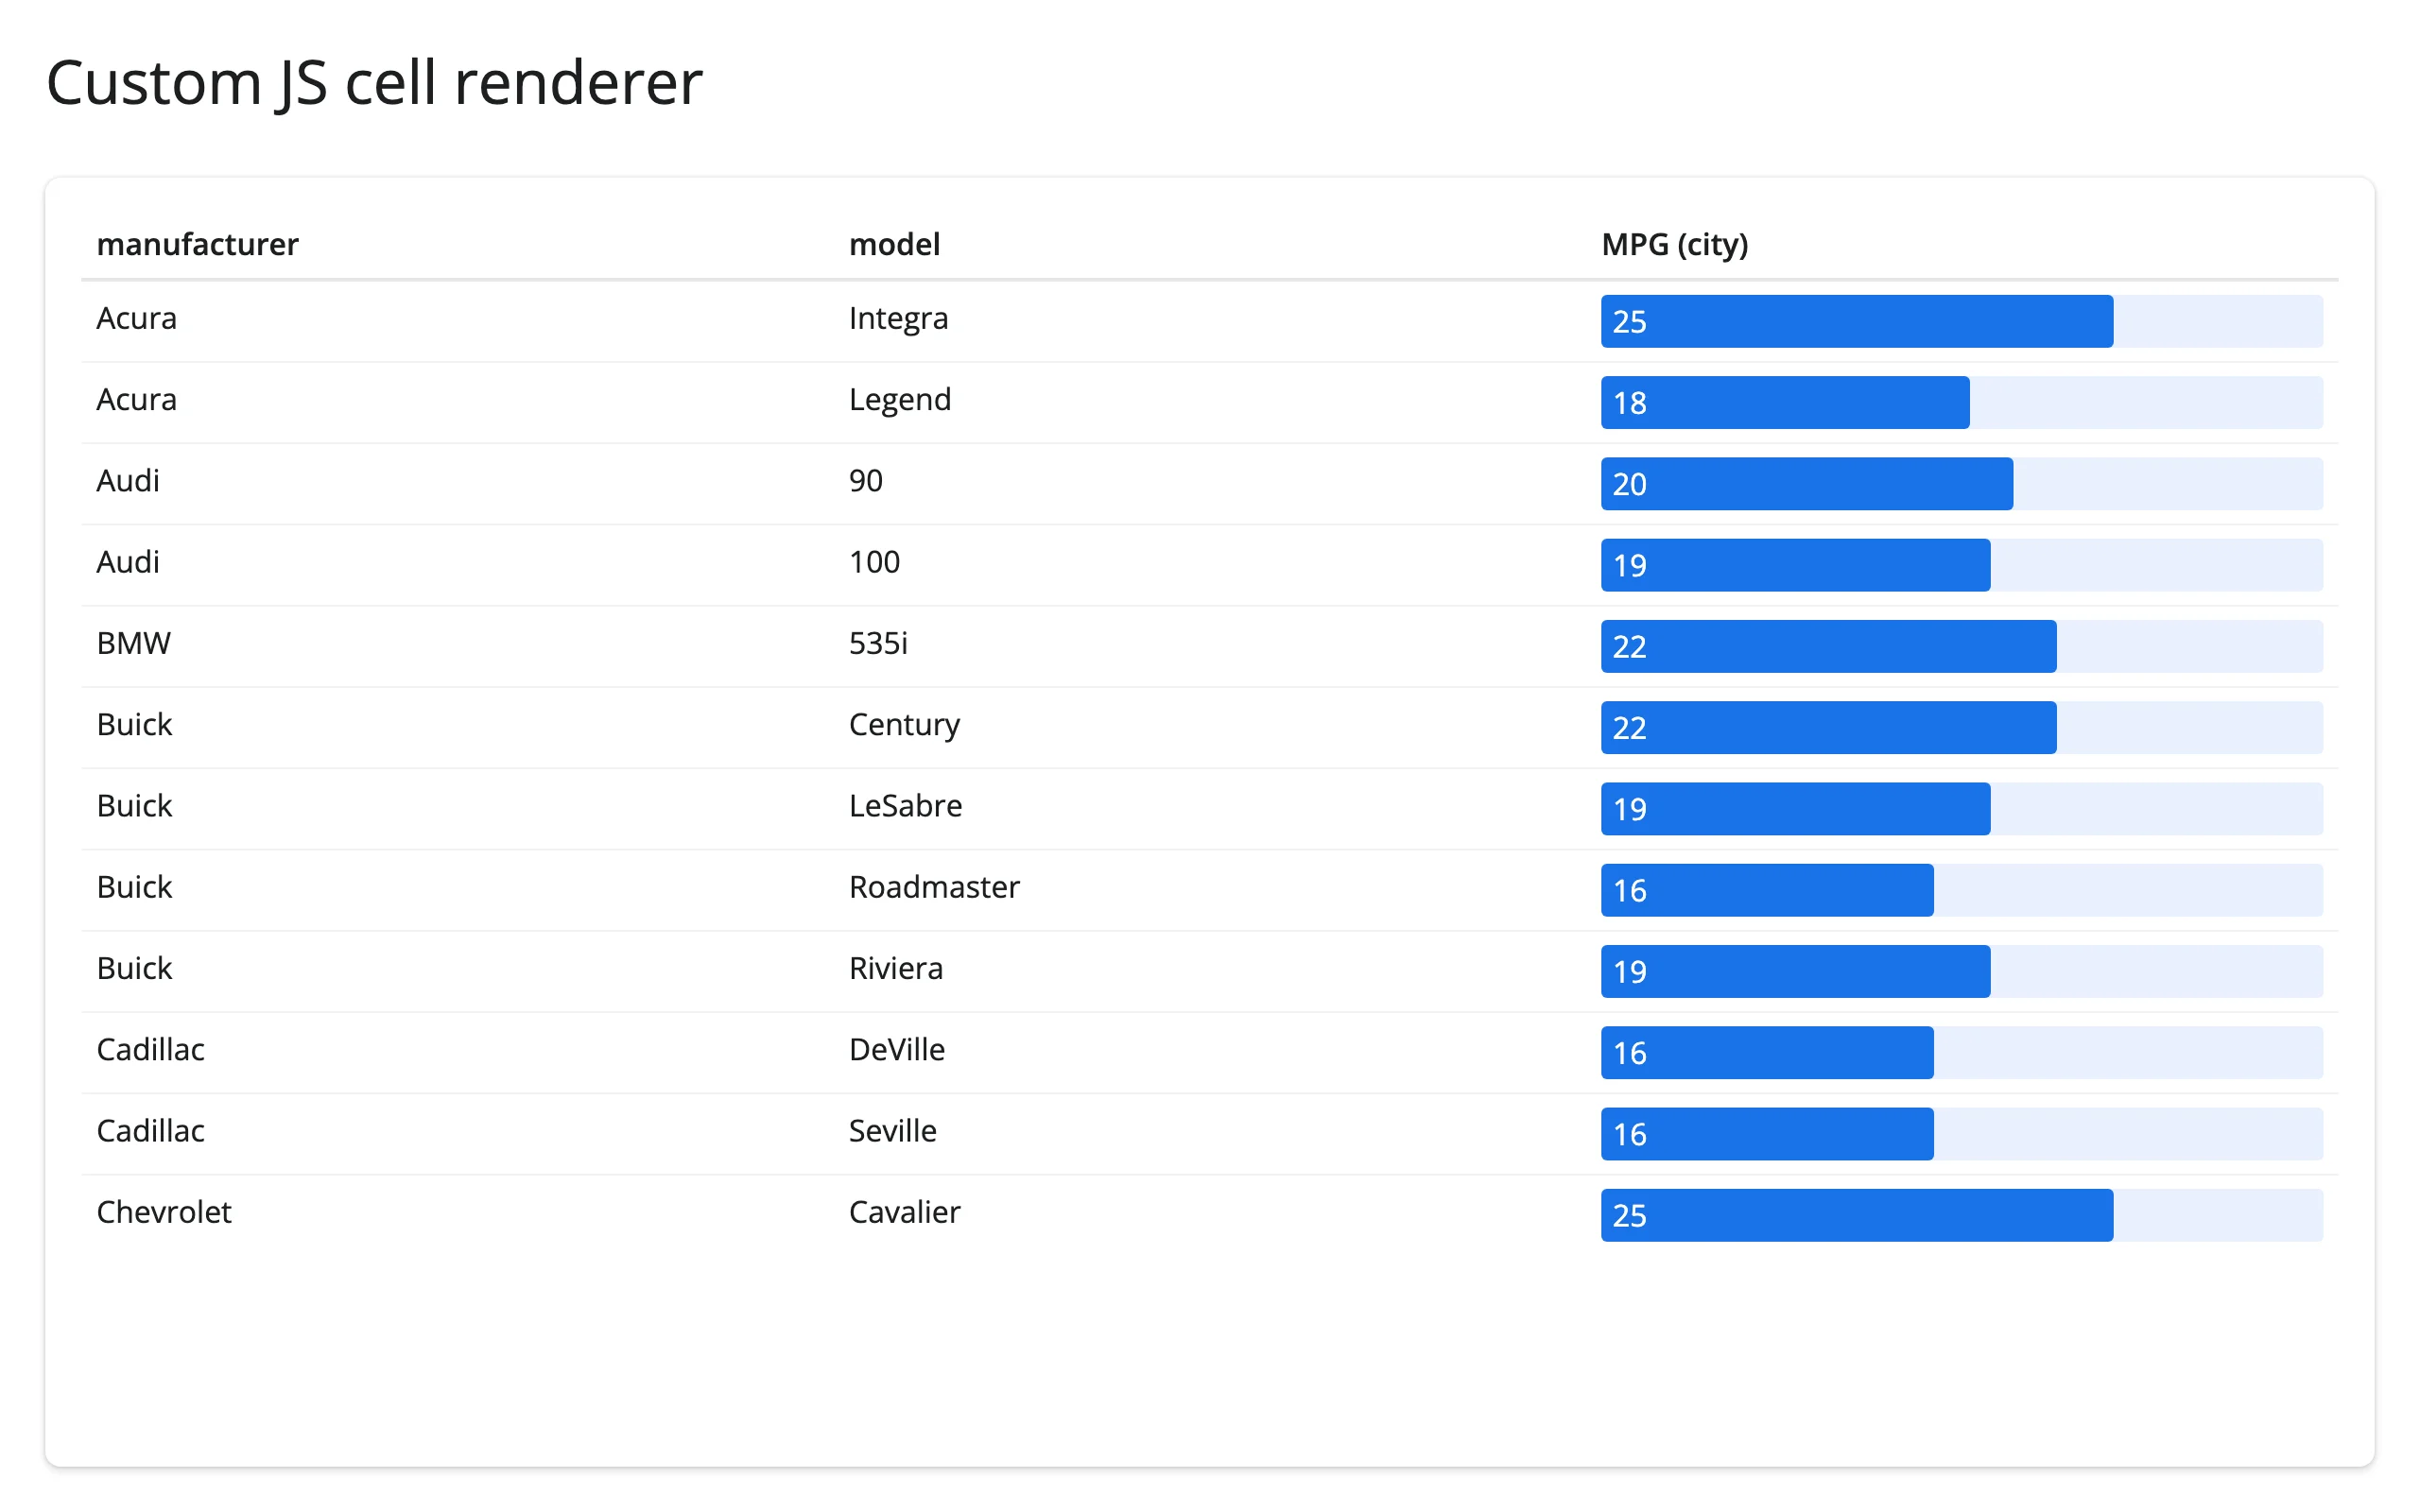
Custom cell renderers
A JS() cell function gets a cellInfo with .value, .row_index, and .column_name, and returns an HTML string – enough for an in-cell bar chart with no extra library. 05_custom_cells.py:
from reactable import JS, Column, Reactable
from reactable.data import cars_93
from shiny.express import ui
from shinywidgets import render_reactable

ui.page_opts(title="Custom JS cell renderer", fillable=True)

cars = cars_93.to_pandas()[["manufacturer", "model", "mpg_city"]].head(12)

bar_cell = JS(
    "function(cellInfo) {"
    "  const pct = Math.round((cellInfo.value / 35) * 100);"
    "  return ("
    "    '<div style=\"background:#e8f0fe;border-radius:3px\">' +"
    "    '<div style=\"background:#1a73e8;color:white;padding:2px 6px;'"
    "    + 'border-radius:3px;width:' + pct + '%;white-space:nowrap\">' +"
    "    cellInfo.value + '</div></div>'"
    "  );"
    "}"
)

with ui.card(full_screen=True):

    @render_reactable
    def tbl():
        return Reactable(
            cars,
            columns={"mpg_city": Column(name="MPG (city)", cell=bar_cell, html=True)},
            pagination=False,
        )
A cell= can also be a plain Python function (receiving a CellInfo and returning an HTML string), computed once server-side when the table renders – useful when the logic needs data that isn’t in the row itself.
Theming
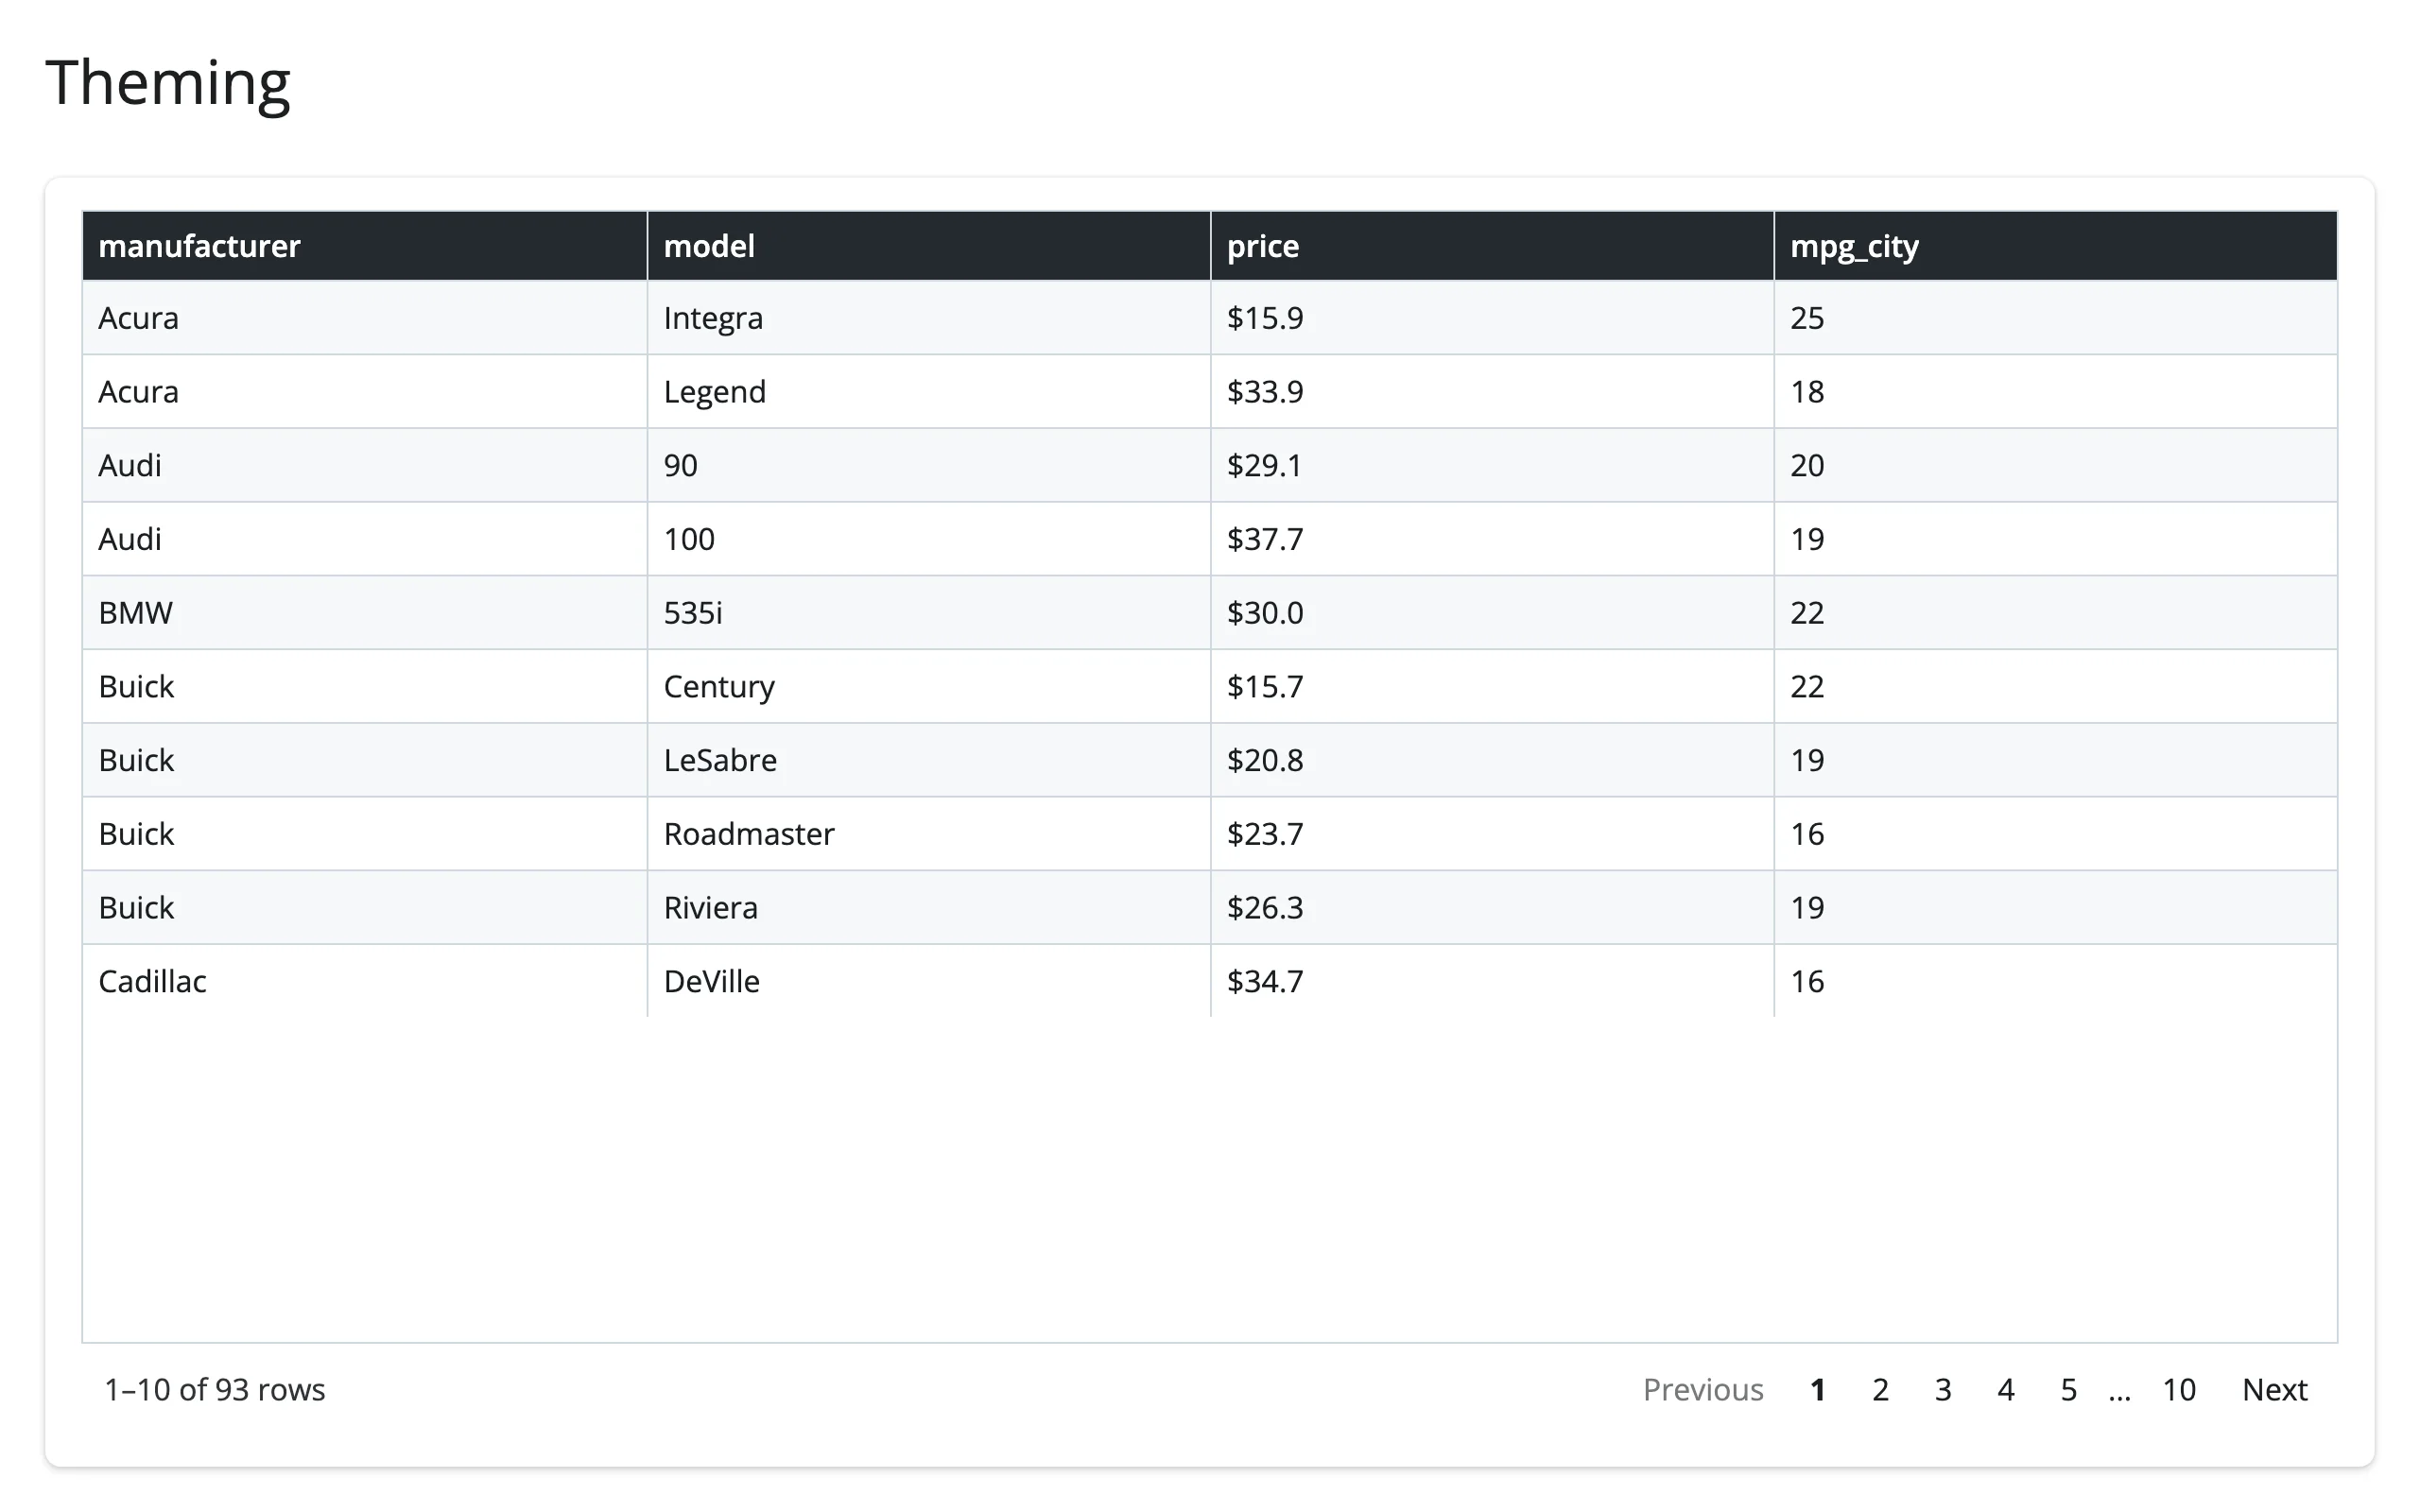
Theme(...) sets colors, borders, and per-part CSS (header, striping, pagination) without touching a stylesheet. 06_theming.py:
from reactable import ColFormat, Column, Reactable, Theme
from reactable.data import cars_93
from shiny.express import ui
from shinywidgets import render_reactable

ui.page_opts(title="Theming", fillable=True)

cars = cars_93.to_pandas()[["manufacturer", "model", "price", "mpg_city"]]

theme = Theme(
    color="#1b1f23",
    background_color="#ffffff",
    border_color="#d0d7de",
    striped_color="#f6f8fa",
    highlight_color="#eef3ff",
    header_style={"background": "#24292f", "color": "white"},
)

with ui.card(full_screen=True):

    @render_reactable
    def tbl():
        return Reactable(
            cars,
            columns={"price": Column(format=ColFormat(prefix="$", digits=1))},
            theme=theme,
            striped=True,
            highlight=True,
            bordered=True,
        )
Column groups and footers
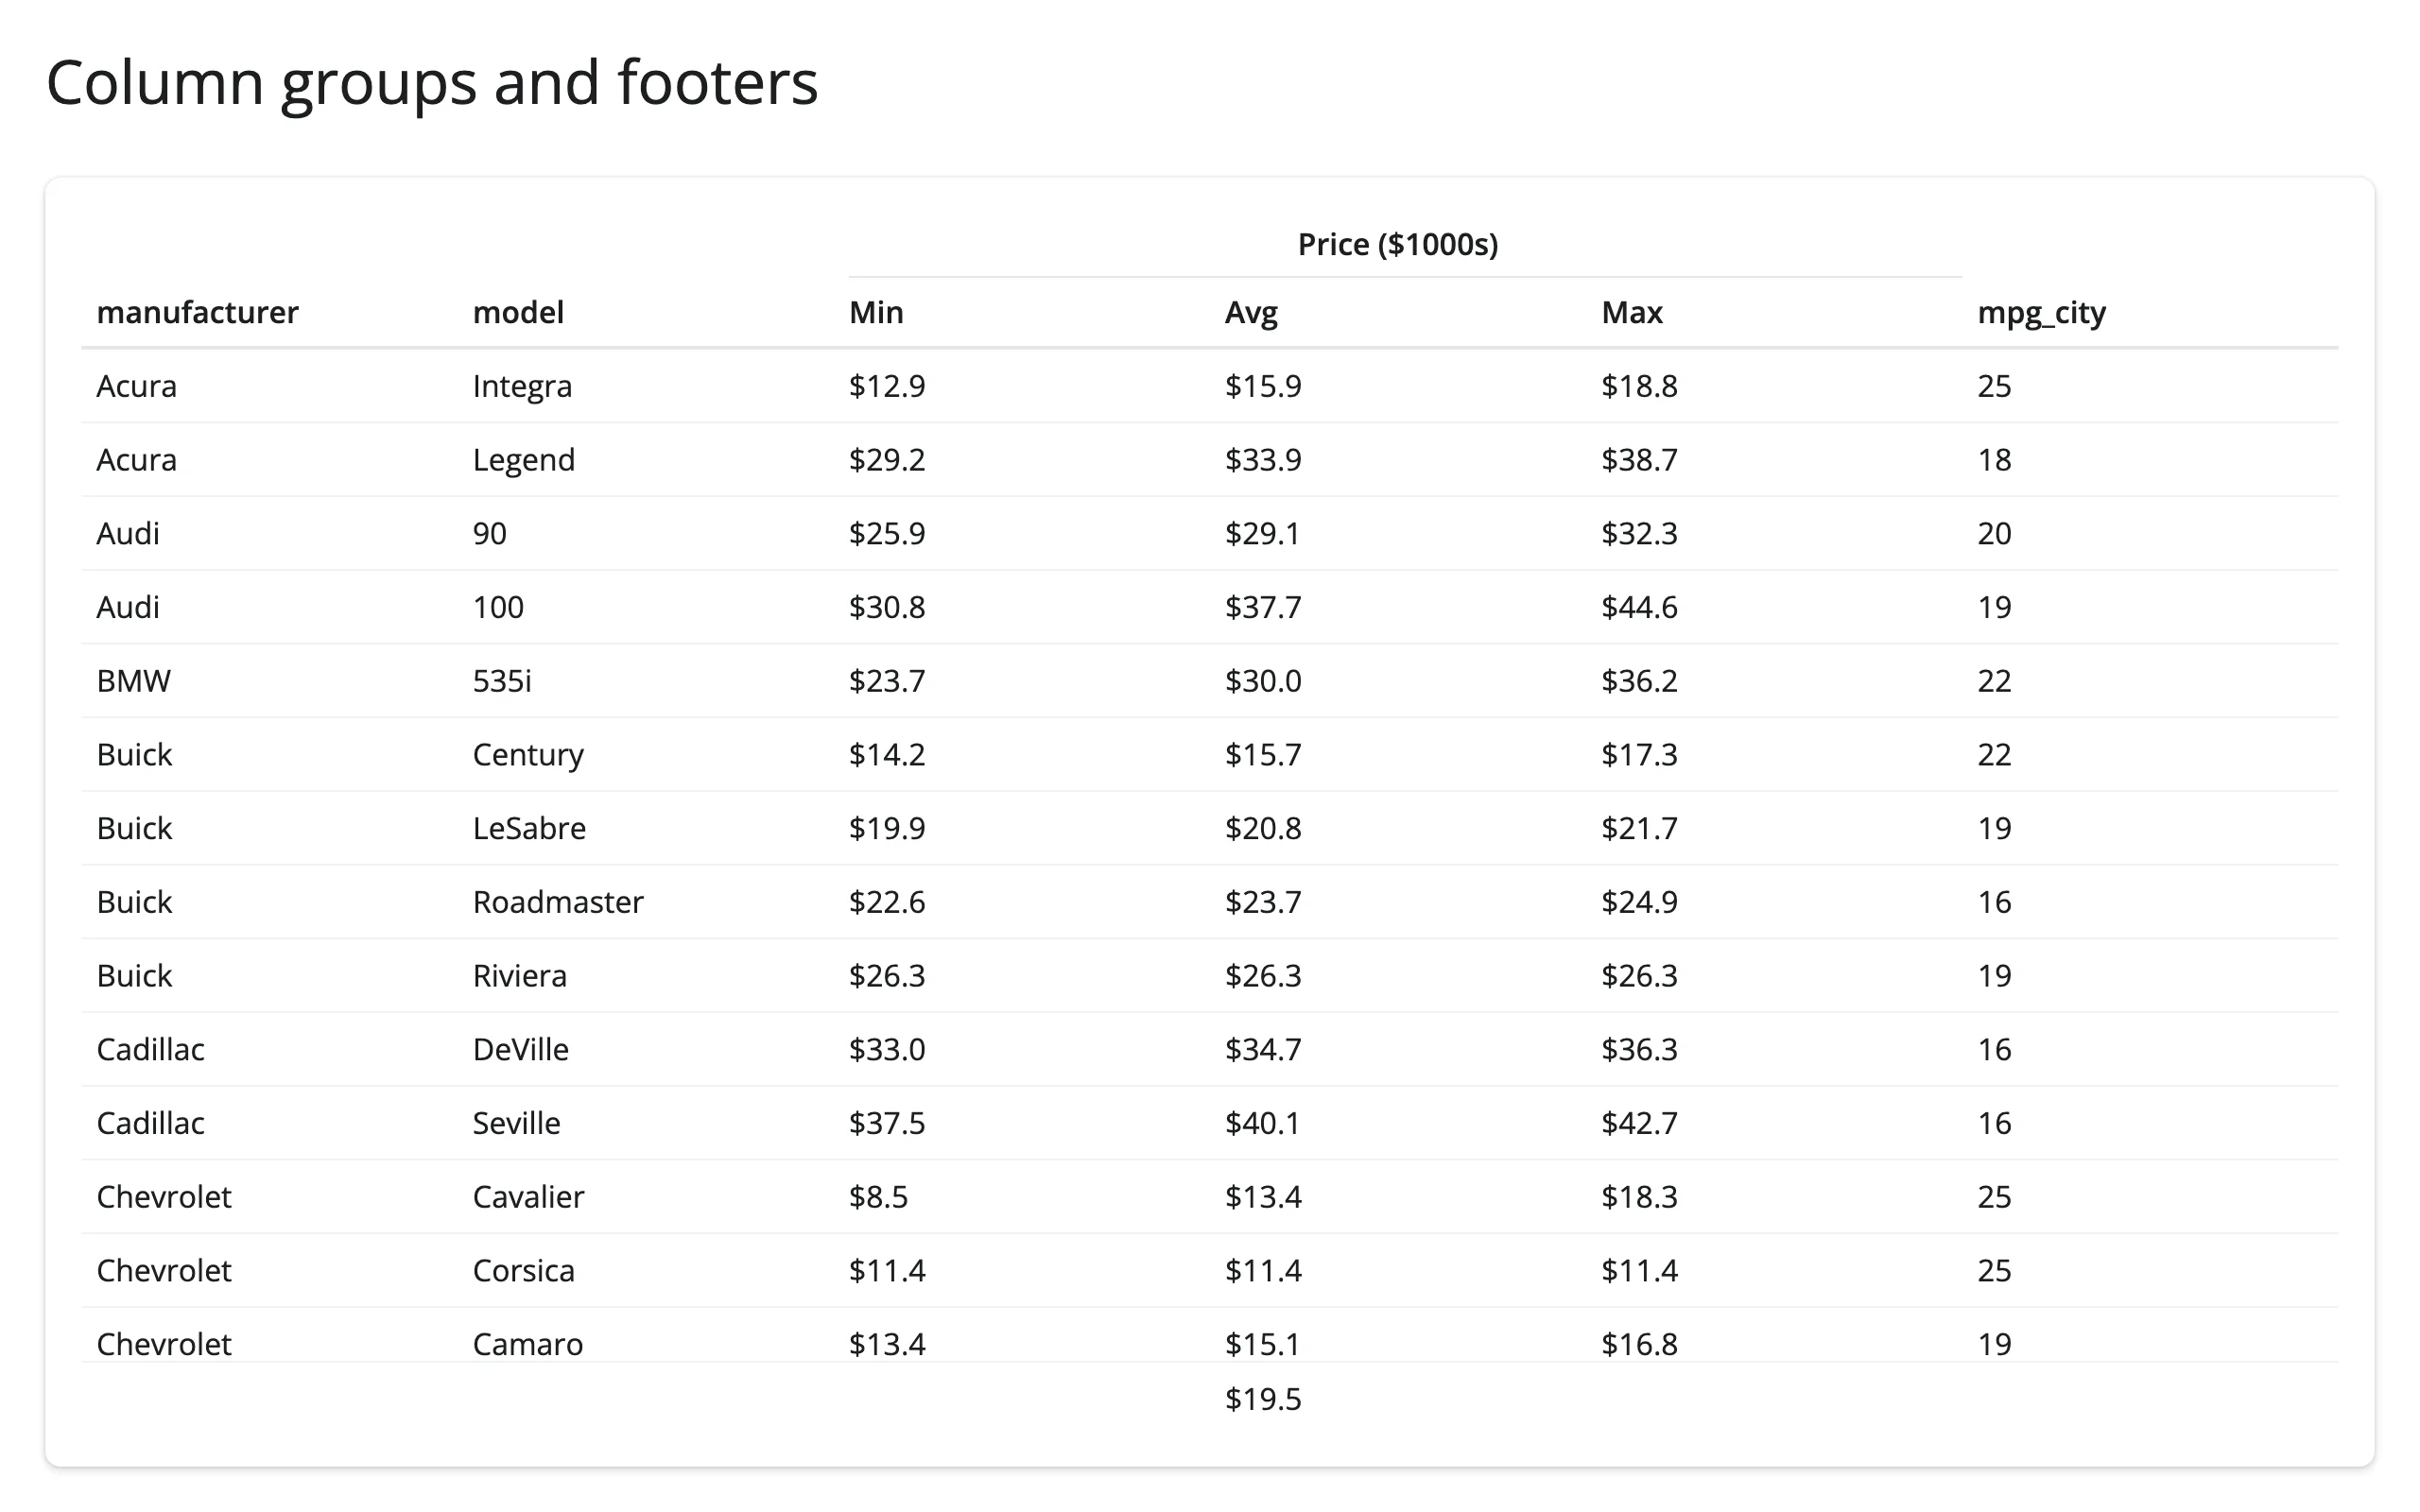
column_groups=[ColGroup(...)] spans a header over several columns; Column(footer=...) computes a summary row from a ColInfo(values, name). 07_column_groups_footers.py:
from reactable import ColFormat, ColGroup, Column, Reactable
from reactable.data import cars_93
from shiny.express import ui
from shinywidgets import render_reactable

ui.page_opts(title="Column groups and footers", fillable=True)

cars = cars_93.to_pandas()[
    ["manufacturer", "model", "min_price", "price", "max_price", "mpg_city"]
]


def avg_footer(info) -> str:
    return f"${sum(info.values) / len(info.values):.1f}"


with ui.card(full_screen=True):

    @render_reactable
    def tbl():
        return Reactable(
            cars,
            columns={
                "min_price": Column(name="Min", format=ColFormat(prefix="$", digits=1)),
                "price": Column(
                    name="Avg",
                    format=ColFormat(prefix="$", digits=1),
                    footer=avg_footer,
                ),
                "max_price": Column(name="Max", format=ColFormat(prefix="$", digits=1)),
            },
            column_groups=[ColGroup(name="Price ($1000s)", columns=["min_price", "price", "max_price"])],
            pagination=False,
        )
(avg_footer uses info.values – the column’s full, unfiltered data – rather than aggregate=, which is group-row-only and hits the same numeric-type gotcha noted above.)
Reacting to user interaction
reactable-py’s own JavaScript never calls model.send(), but its bundle includes R reactable’s full state API (getState/onStateChange), which shinywidgets subscribes to internally the first time you read an accessor. Nothing is sent to the server, and nothing is computed client-side beyond what the table already tracks, until then.
Accessor reference
| Accessor | Returns | Before any interaction | Across re-render | Default rate policy |
|---|---|---|---|---|
selected_rows() |
list[int] (0-based, data-space positions, like df.iloc) |
cancels until the browser’s first state report | re-seeded from the new table (starts []) |
none |
page() |
int (0-based) |
cancels until the browser’s first state report | re-seeded from the new table (starts 0) |
none |
sorted() |
list[{"id": str, "desc": bool}] |
cancels until the browser’s first state report | re-seeded from the new table (starts []) |
none |
filtered() |
list[{"id": str, "value": str}] |
cancels until the browser’s first state report | re-seeded from the new table (starts []) |
debounce, 250ms |
search() |
str |
cancels until the browser’s first state report | re-seeded from the new table (starts "") |
debounce, 250ms |
Every accessor silently cancels (like req(False)) until the browser reports the table’s state, which happens once, shortly after the table first renders – read them with req() semantics in mind, or let a dependent output simply not render until then. All five describe the table’s own state (not a record of a past click), so a re-render re-seeds every one of them from the new table rather than carrying over the old table’s values. Sort/page/selection are click-driven and unthrottled; filter/search are per-keystroke streams and debounced by default. Positions from selected_rows() stay in data coordinates: sorting or paging the table doesn’t change them.
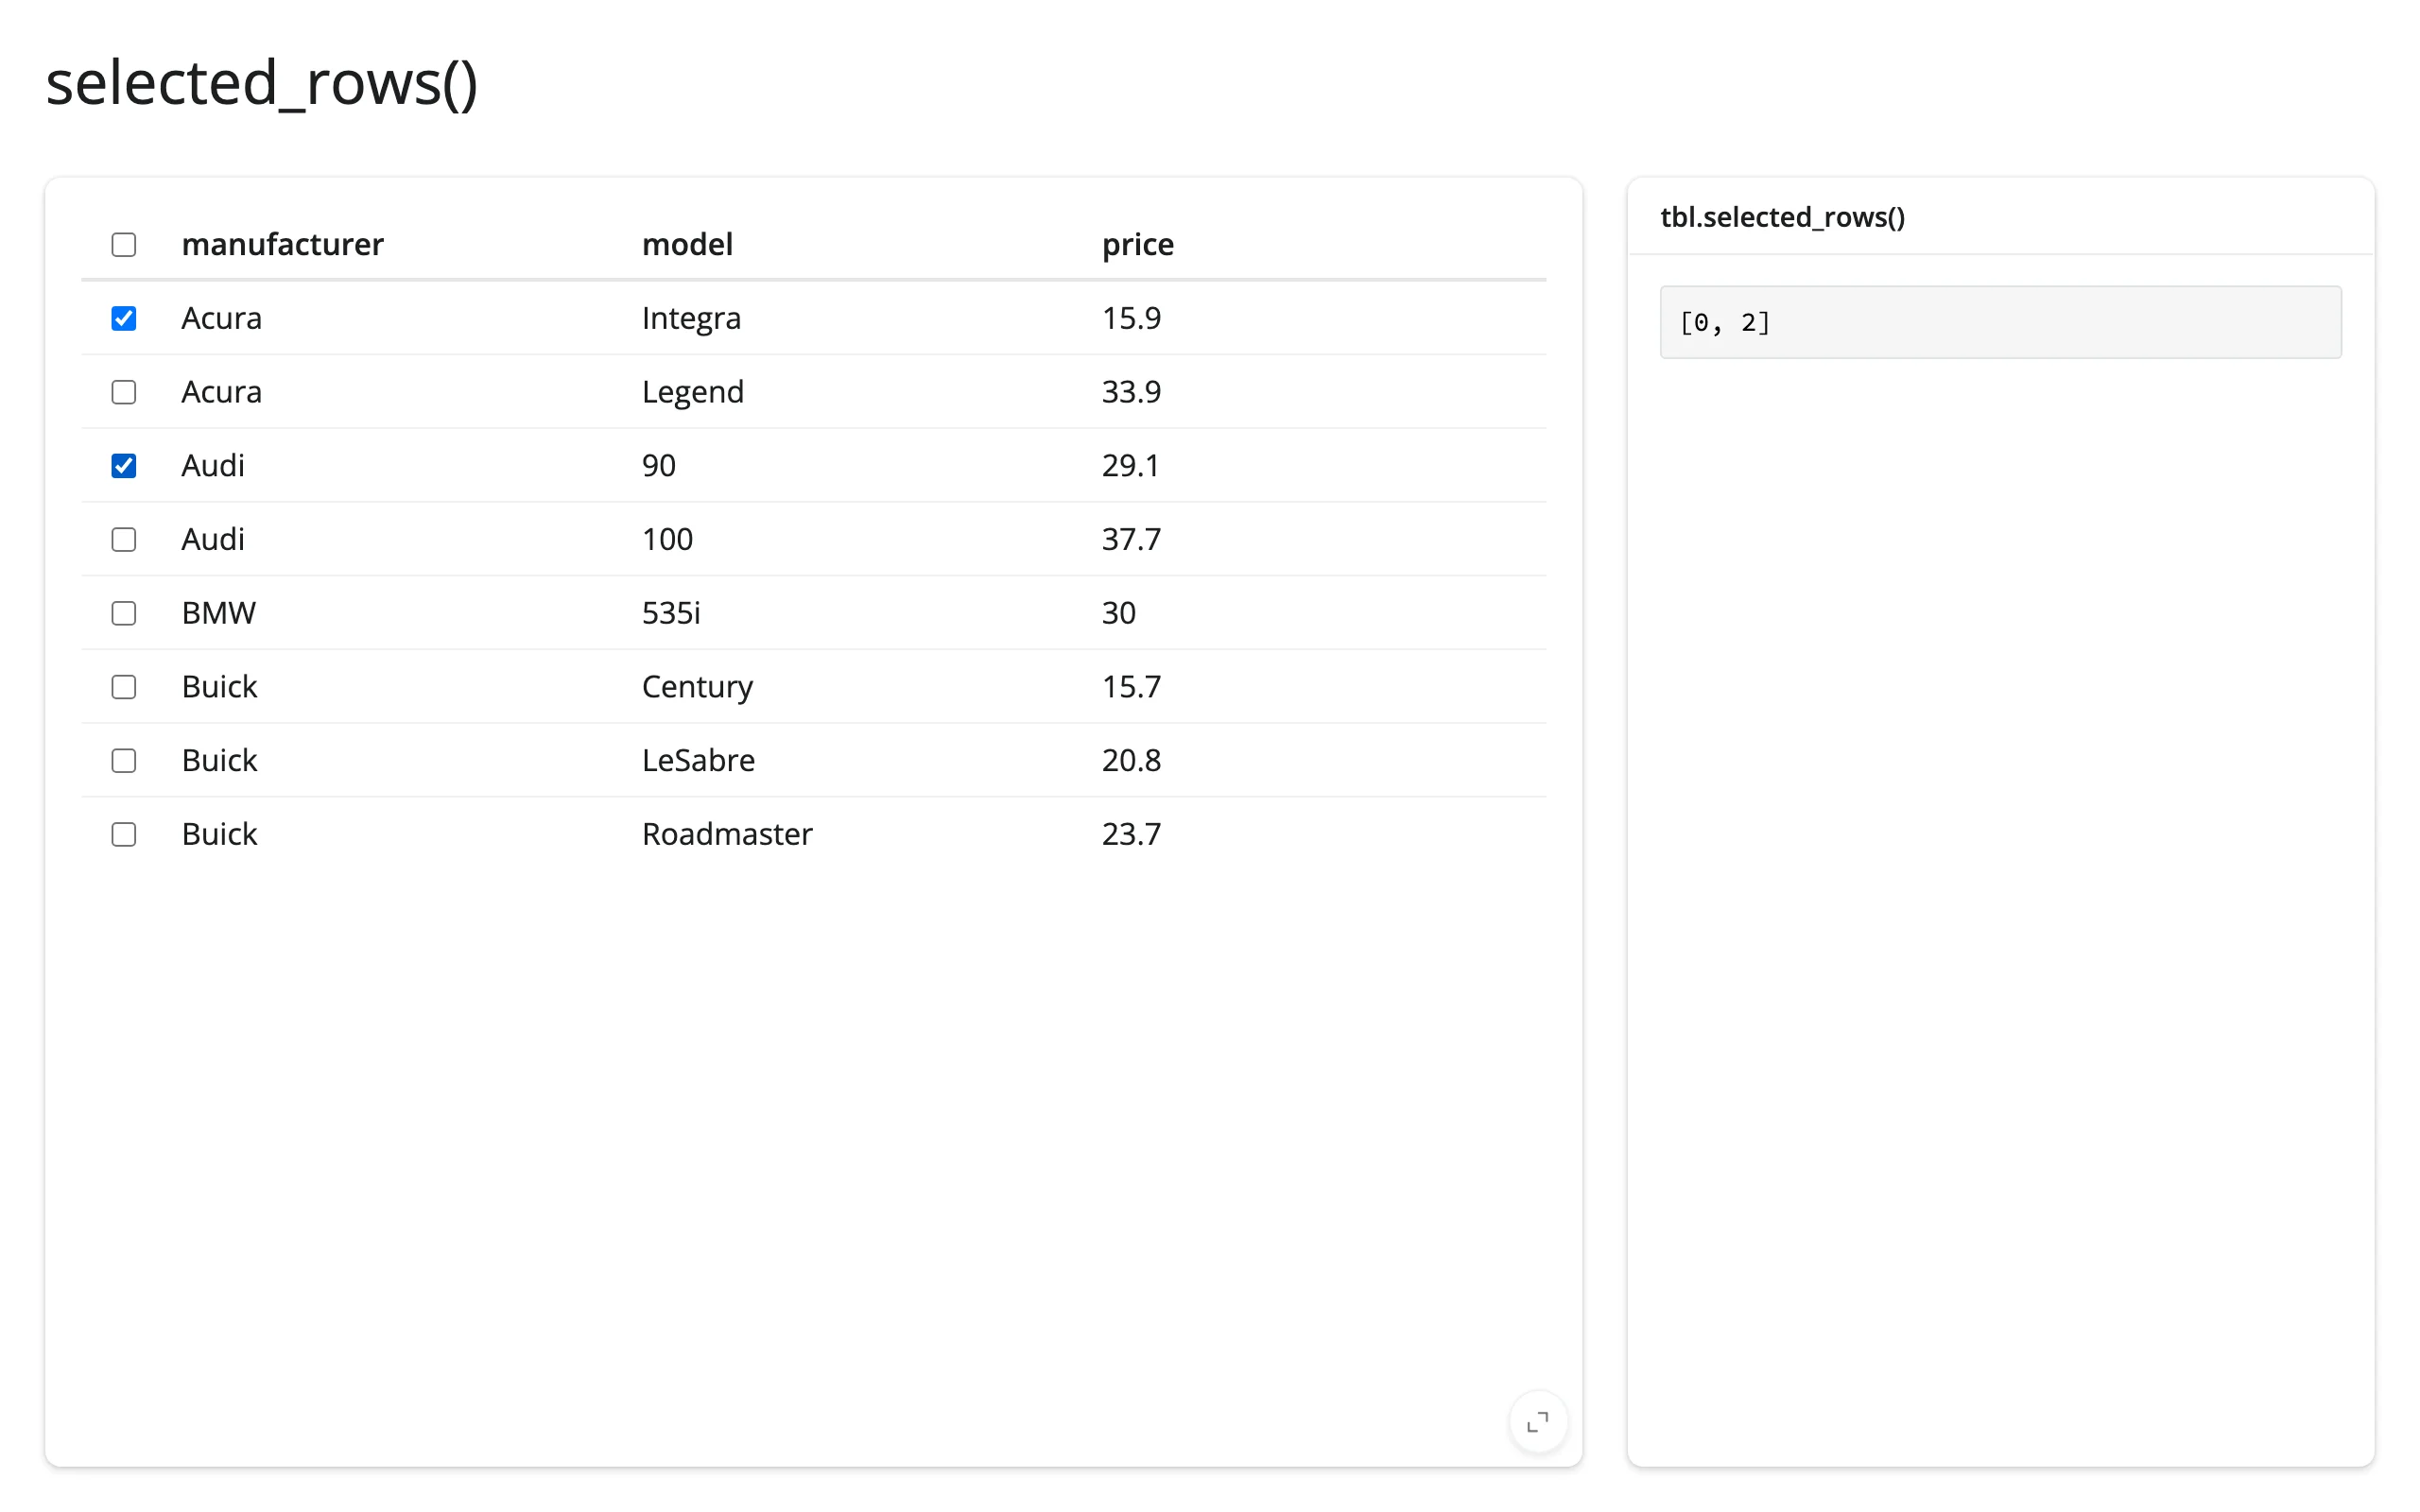
Selection: selected_rows()
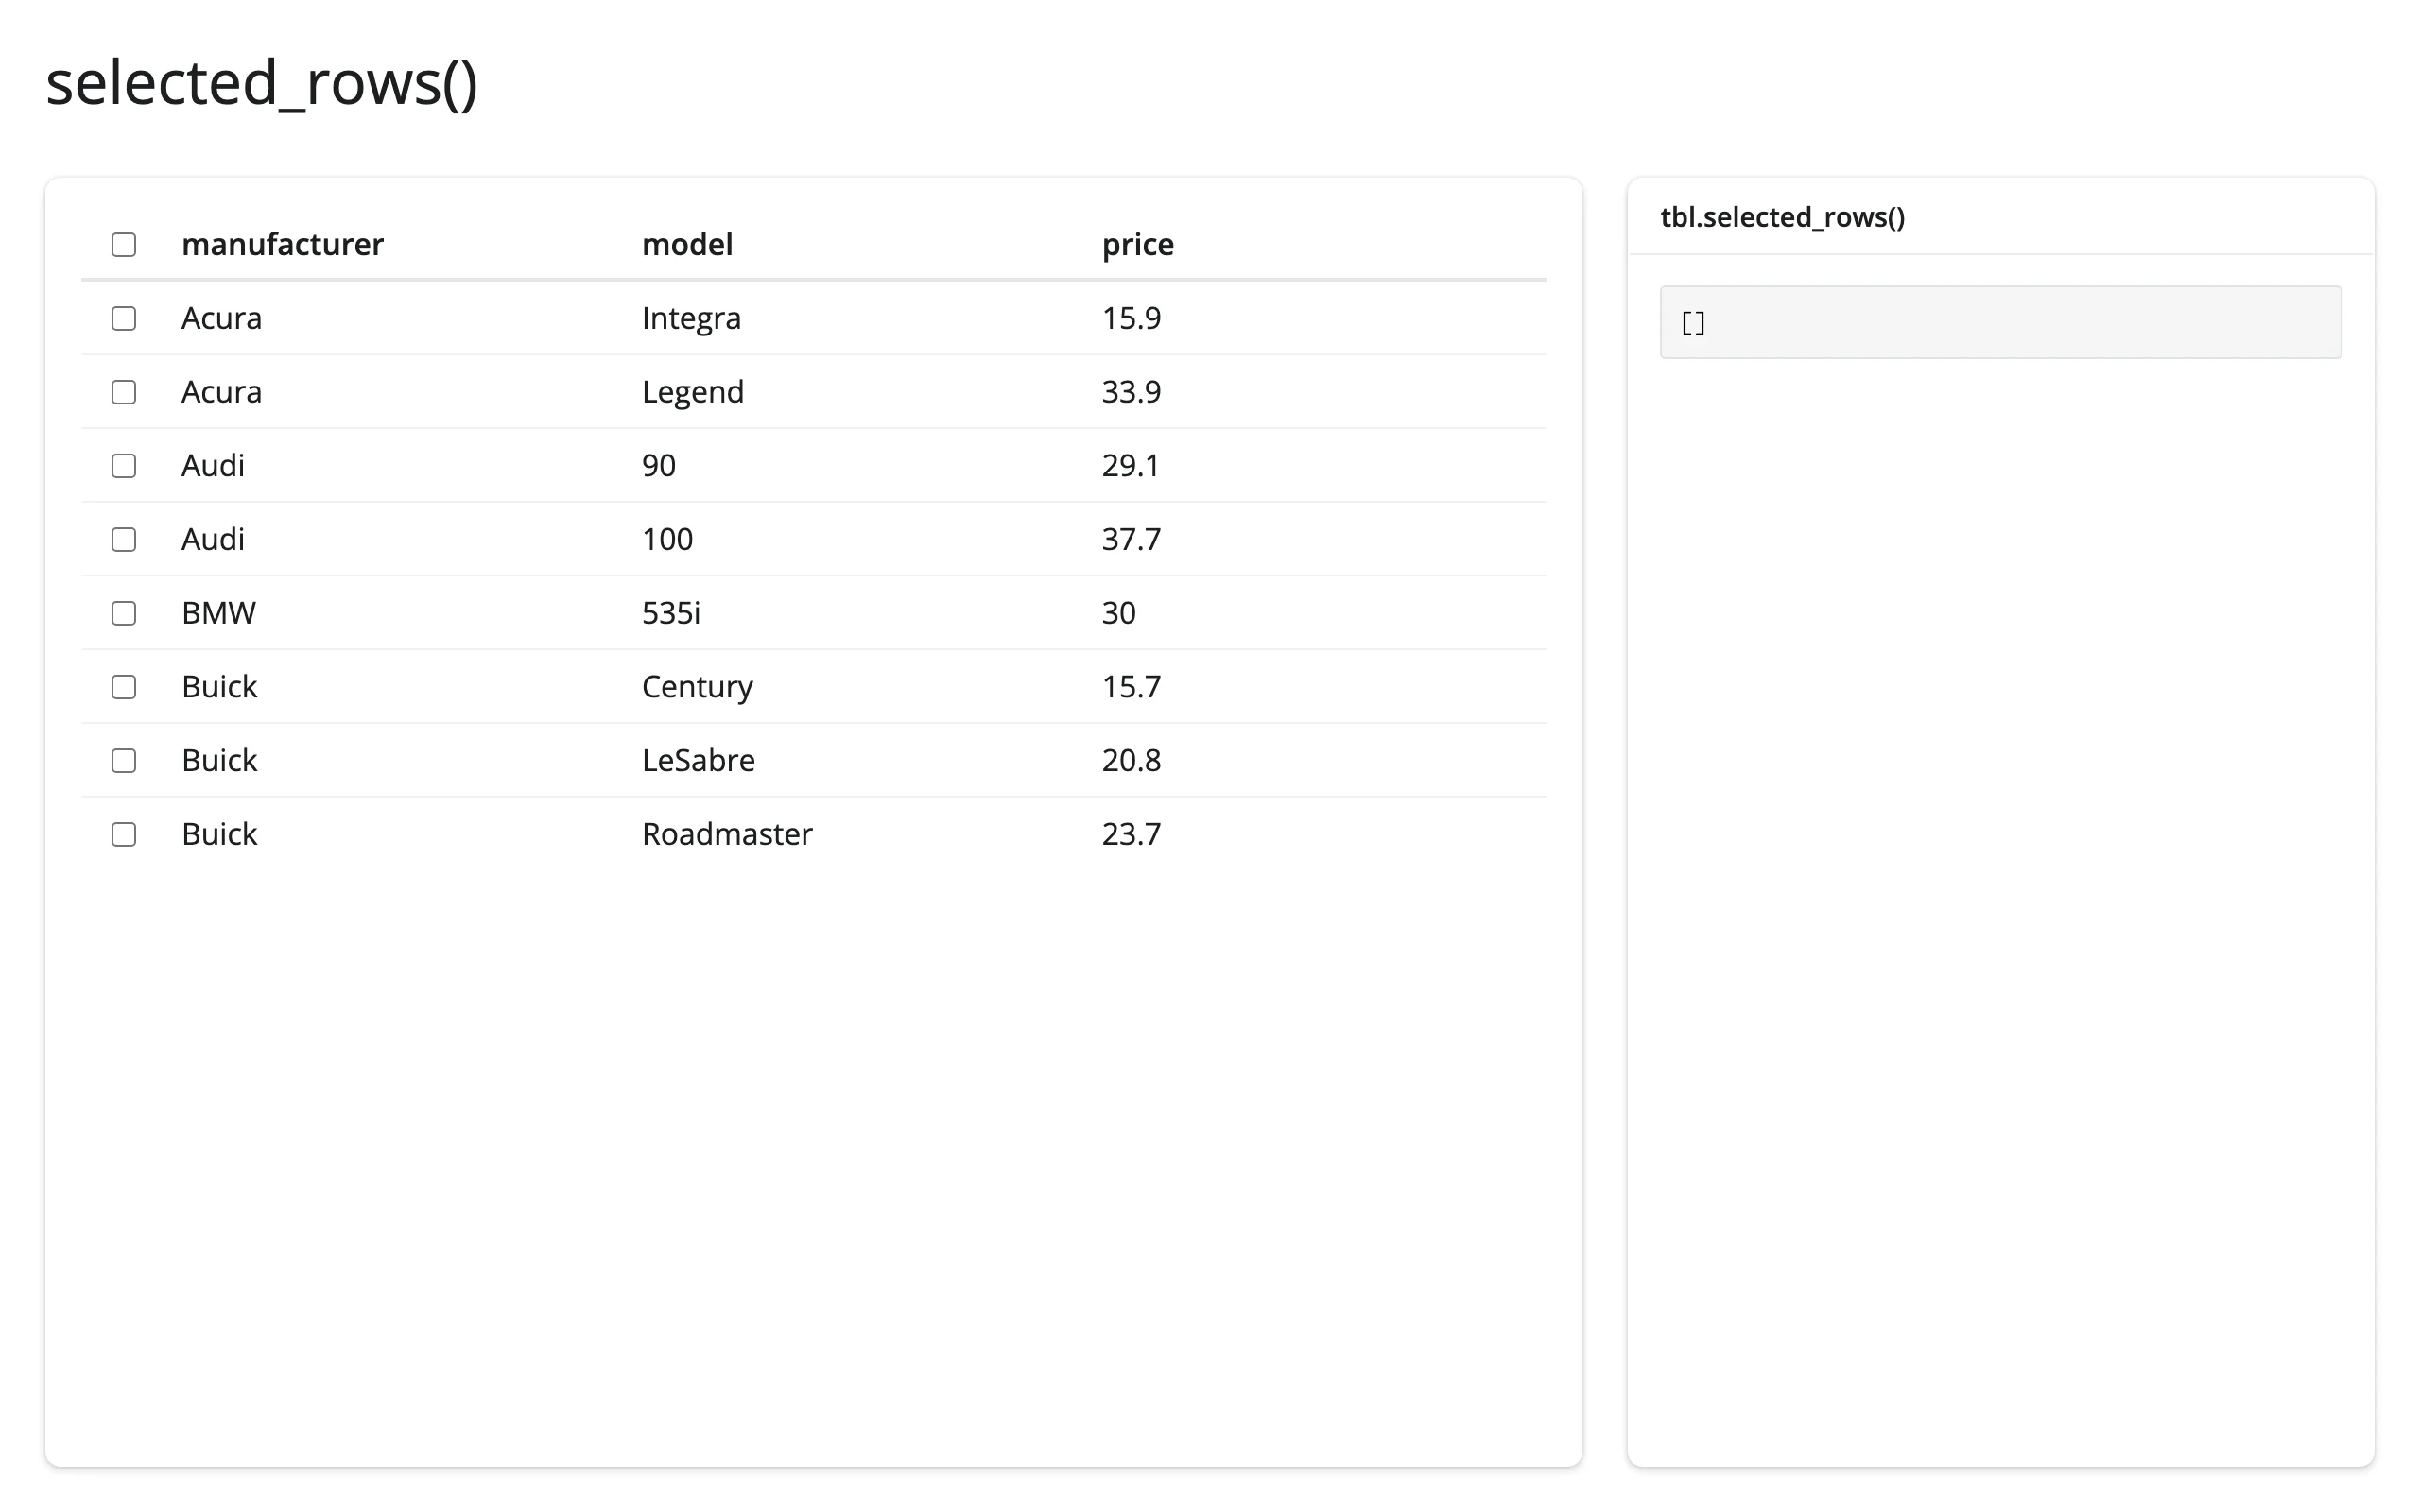
Requires selection="multiple" (or "single") on the table. Position indices are stable across sort and page. 08_selected_rows.py:
from reactable import Reactable
from reactable.data import cars_93
from shiny.express import render, ui
from shinywidgets import render_reactable

ui.page_opts(title="selected_rows()", fillable=True)

cars = cars_93.to_pandas()[["manufacturer", "model", "price"]].head(8)

with ui.layout_columns(col_widths=[8, 4]):
    with ui.card(full_screen=True):

        @render_reactable
        def tbl():
            return Reactable(cars, selection="multiple", default_page_size=8)

    with ui.card():
        ui.card_header("tbl.selected_rows()")

        @render.code
        def selected():
            return str(tbl.selected_rows())
Before selecting any rows, after checking the 1st and 3rd:
Where the user is: page() and sorted()
from reactable import Reactable
from reactable.data import cars_93
from shiny.express import render, ui
from shinywidgets import render_reactable

ui.page_opts(title="page() and sorted()", fillable=True)

cars = cars_93.to_pandas()[["manufacturer", "model", "price", "mpg_city"]]

with ui.layout_columns(col_widths=[8, 4]):
    with ui.card(full_screen=True):

        @render_reactable
        def tbl():
            return Reactable(cars, sortable=True, default_page_size=10)

    with ui.card():
        ui.card_header("Where the user is")

        @render.code
        def state():
            page_1based = tbl.page() + 1
            return f"page {page_1based}\nsorted {tbl.sorted()}"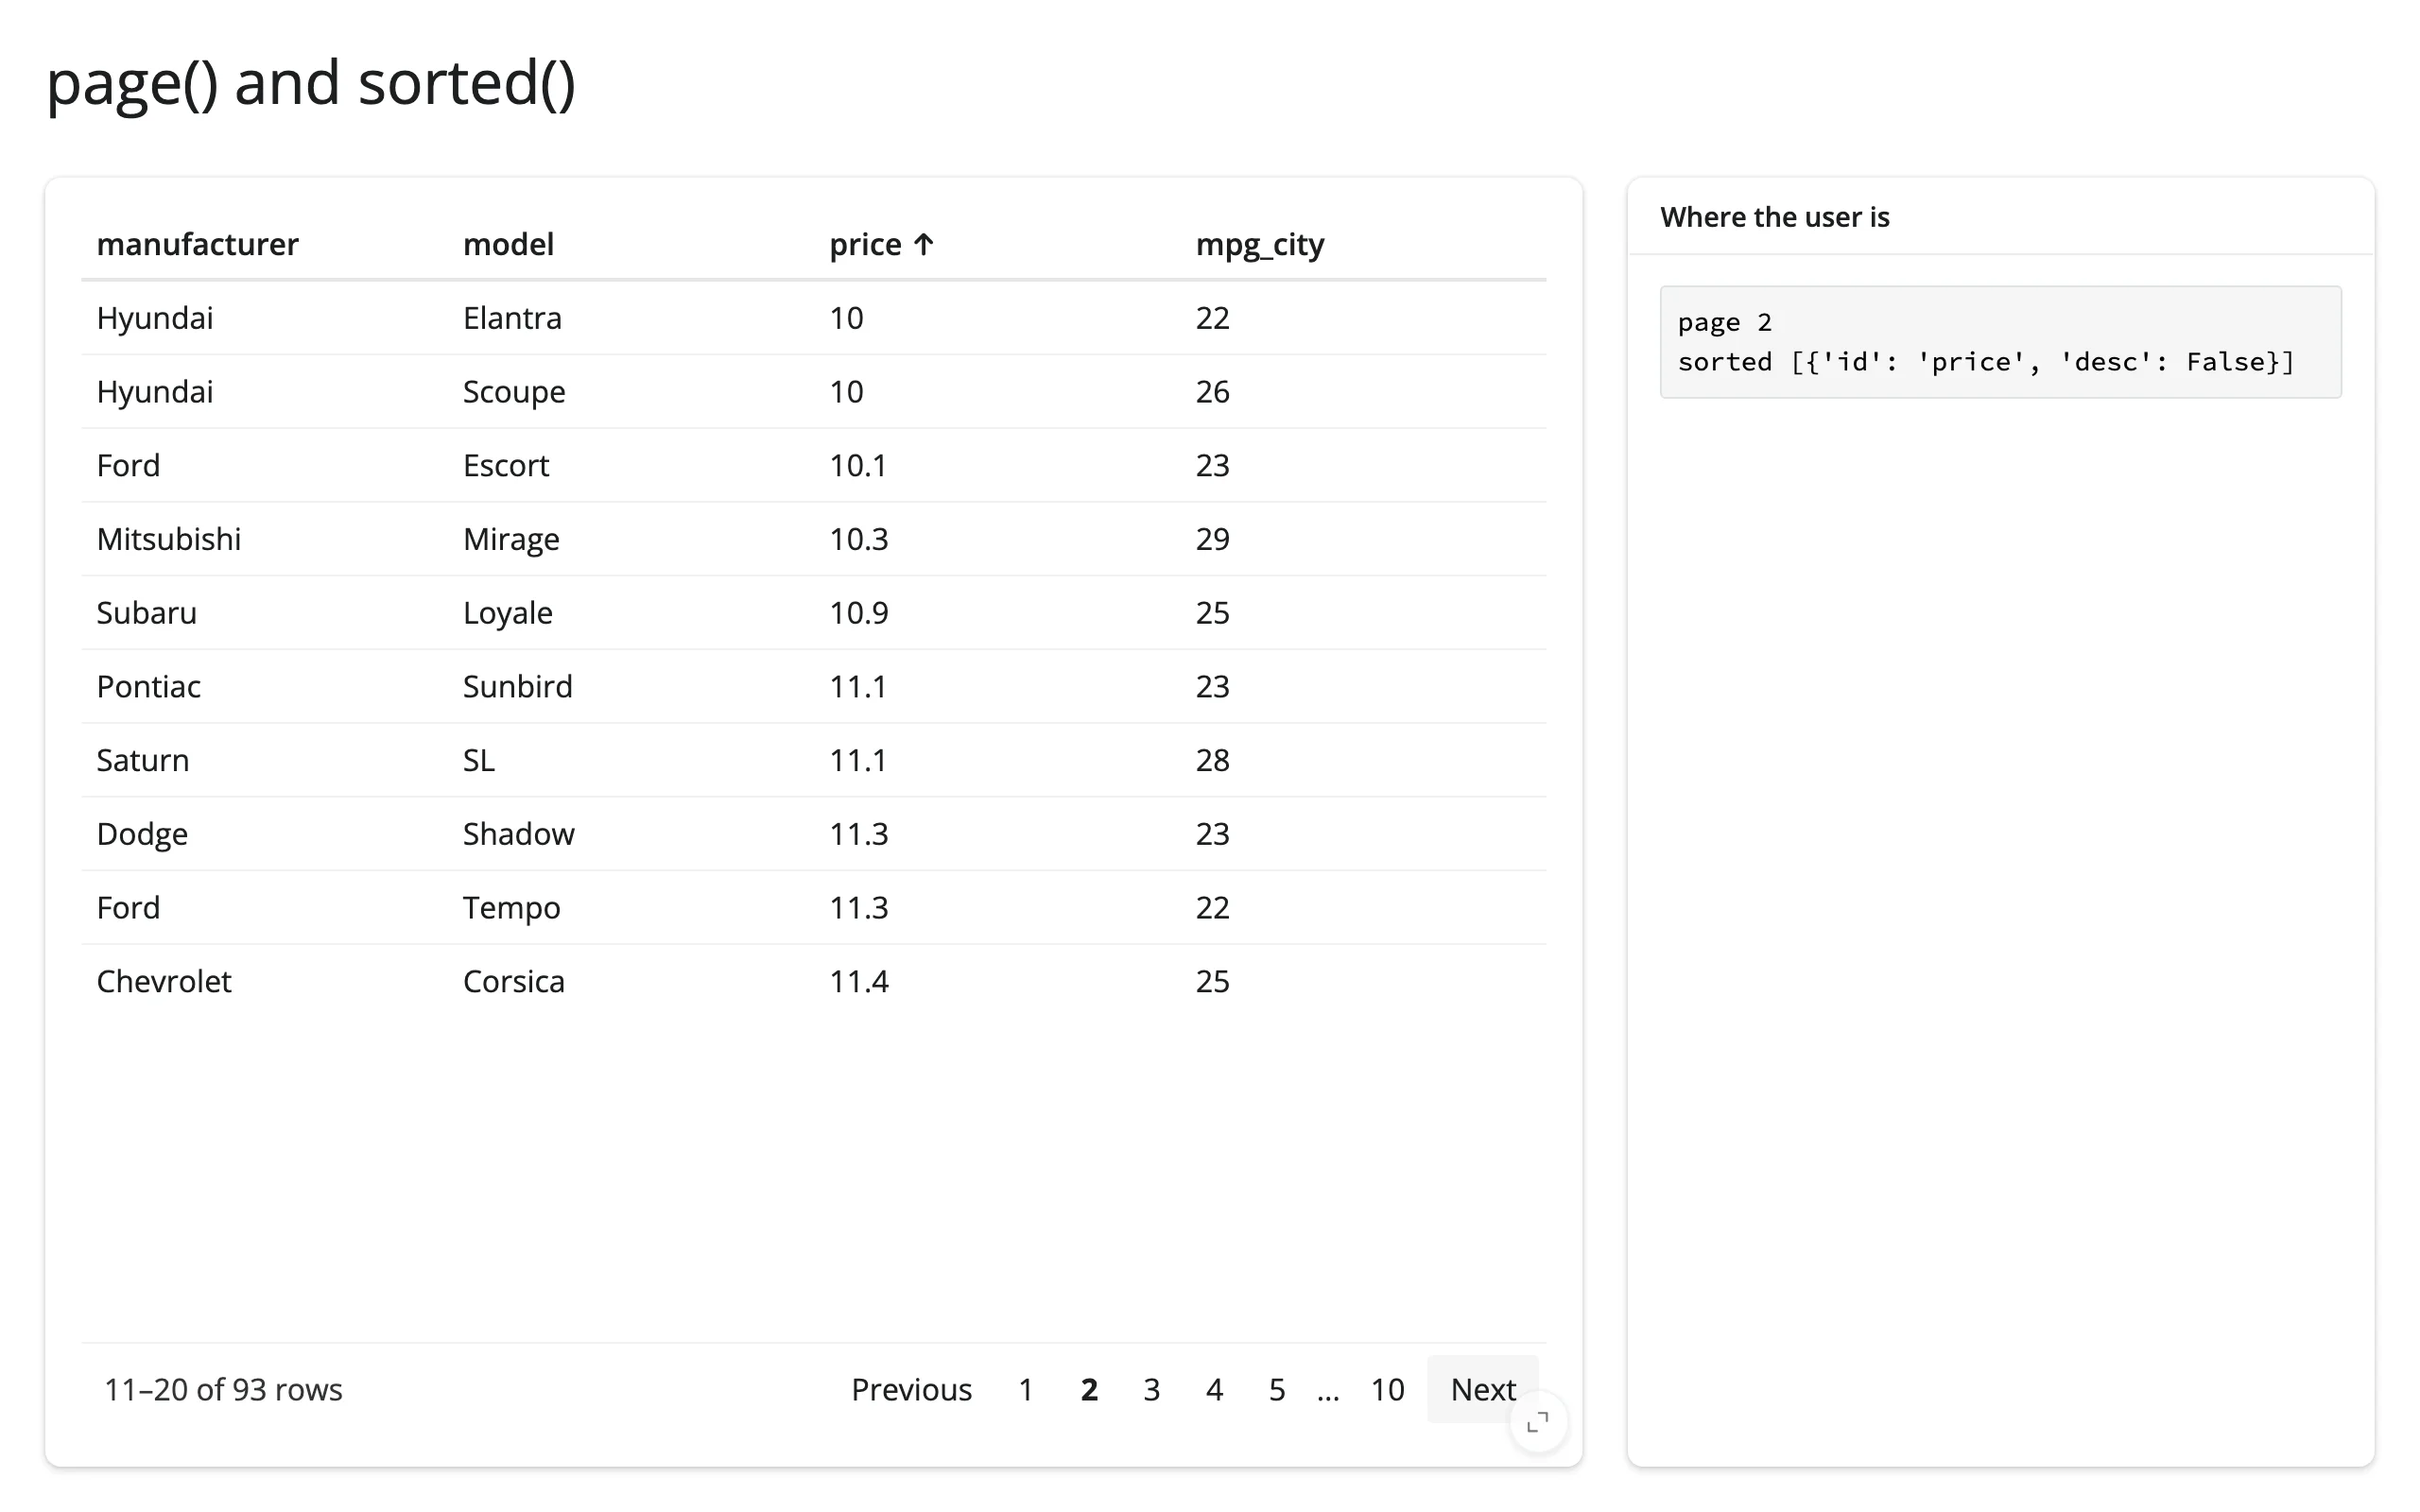
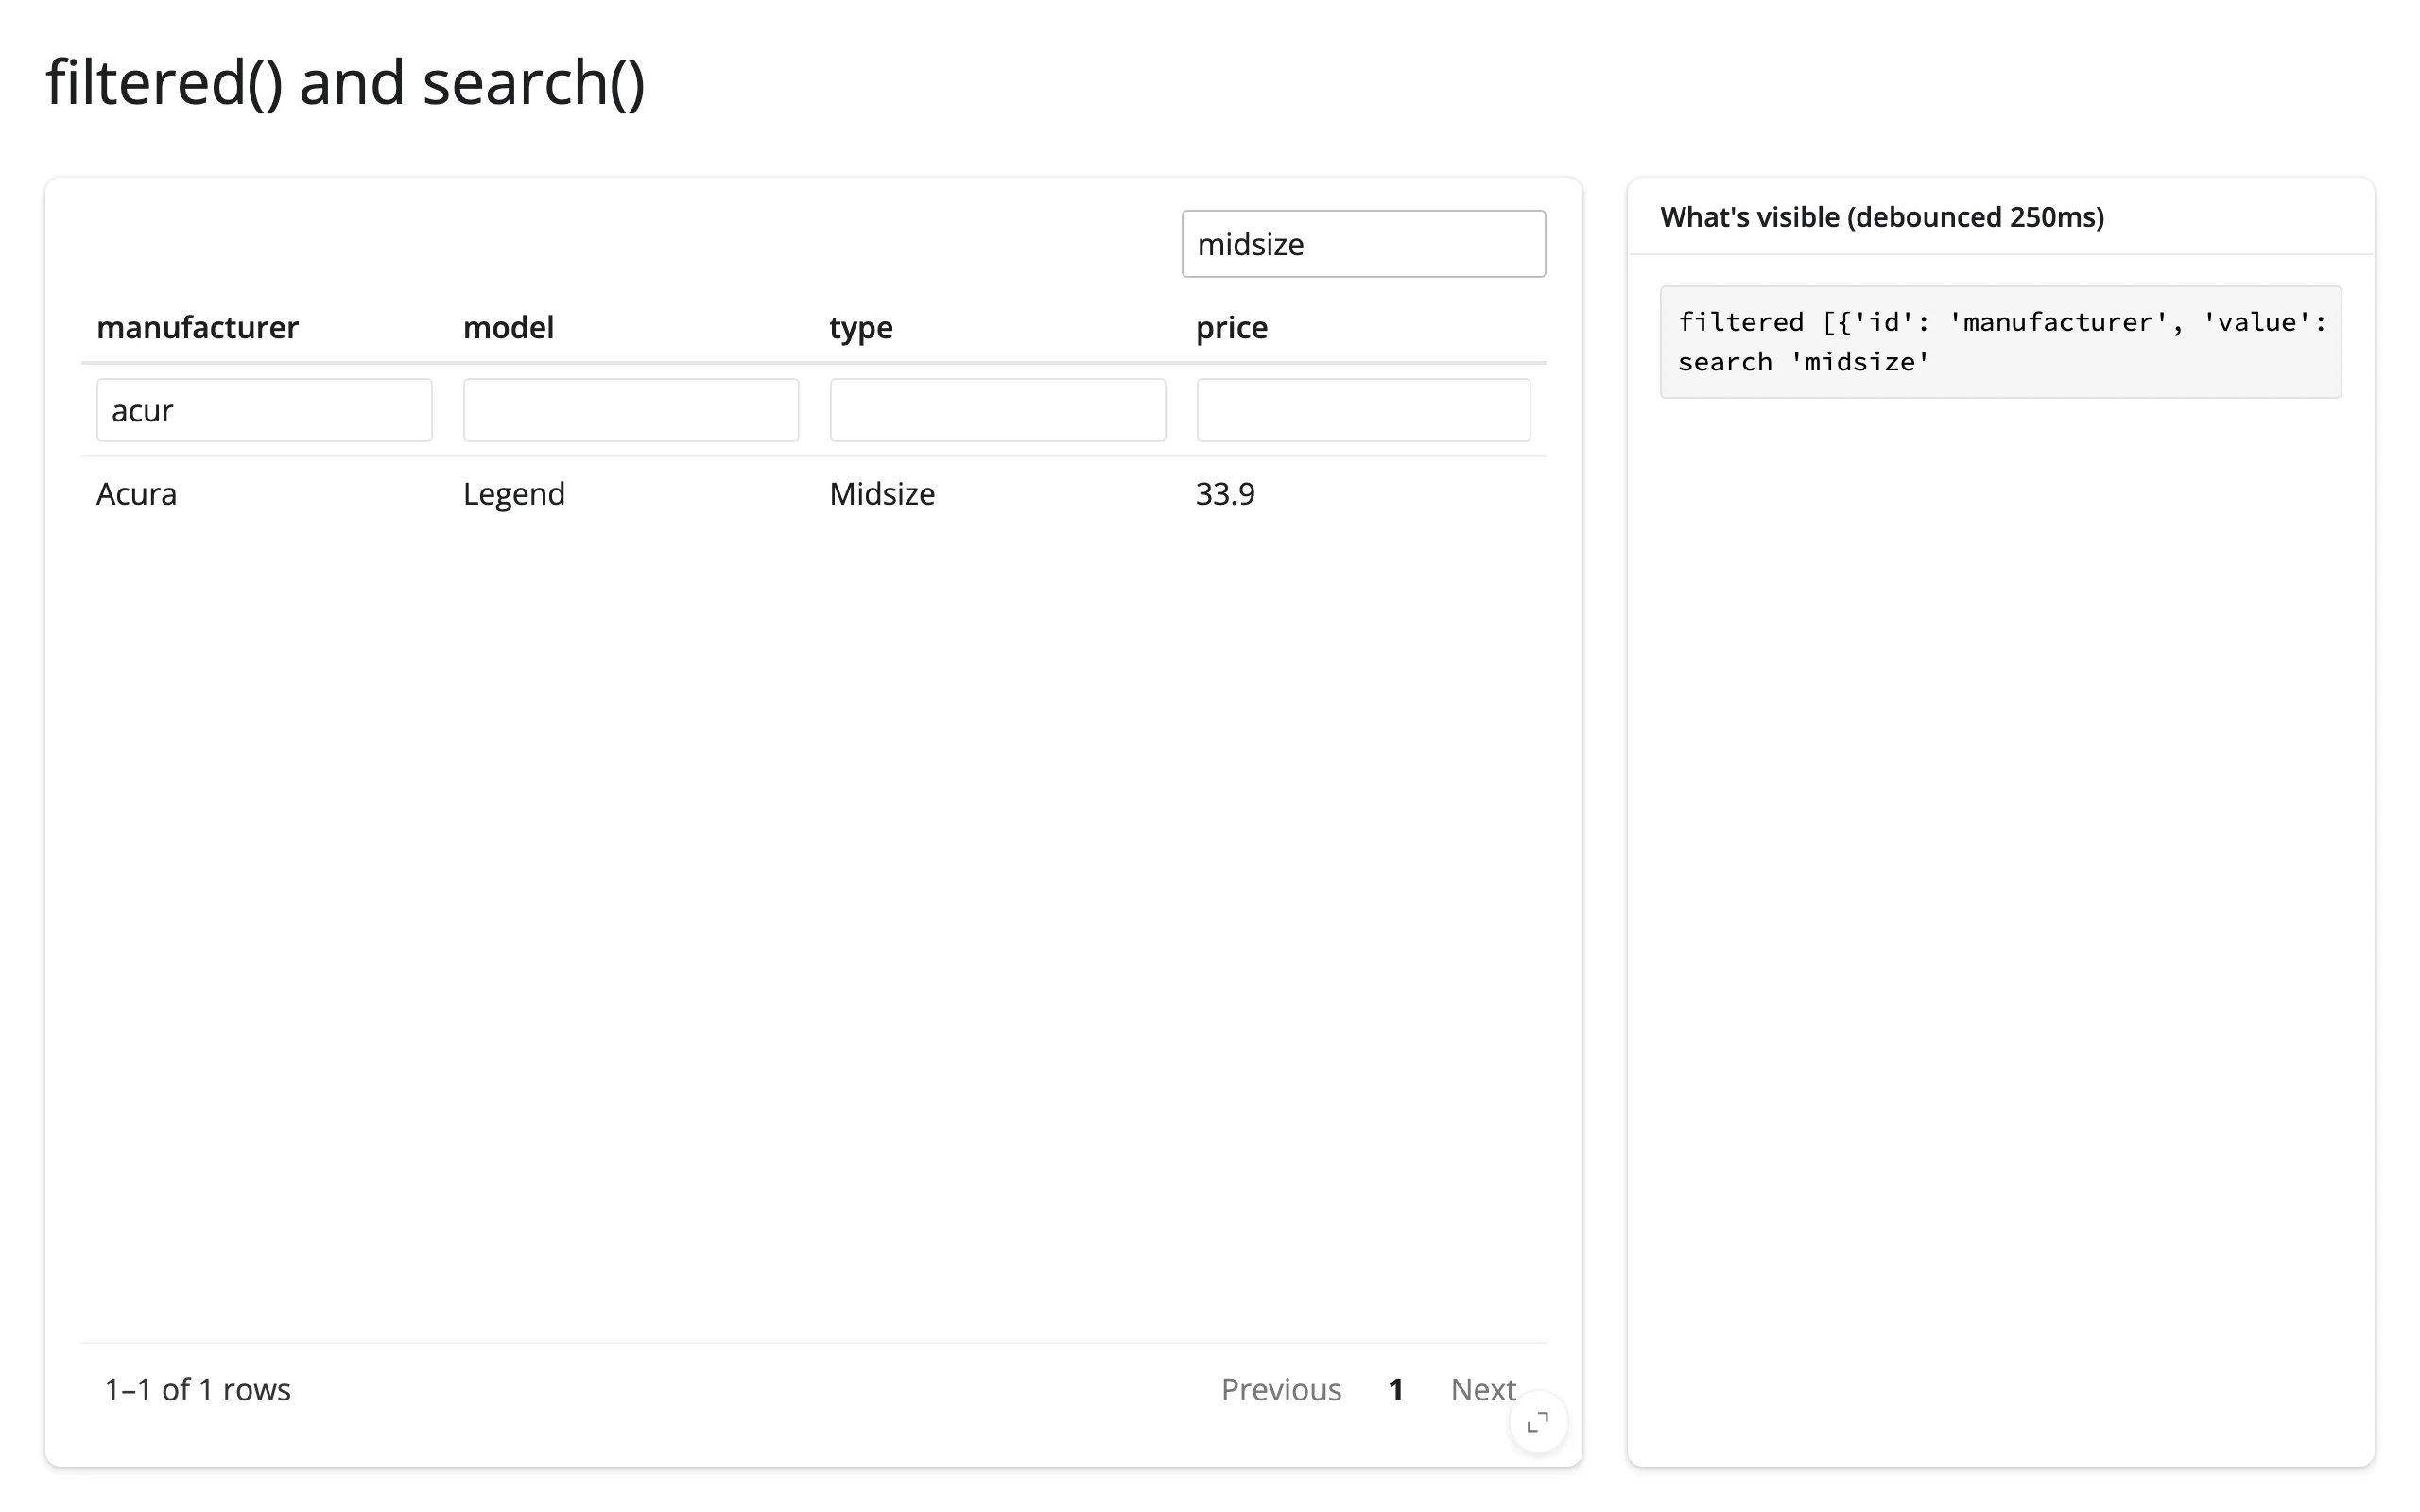
What’s visible: filtered() and search()
Both report the query, not the matching rows – see Coordinating multiple views for turning a search string into an actual filtered dataset. 10_filter_search.py:
from reactable import Reactable
from reactable.data import cars_93
from shiny.express import render, ui
from shinywidgets import render_reactable

ui.page_opts(title="filtered() and search()", fillable=True)

cars = cars_93.to_pandas()[["manufacturer", "model", "type", "price"]]

with ui.layout_columns(col_widths=[8, 4]):
    with ui.card(full_screen=True):

        @render_reactable
        def tbl():
            return Reactable(cars, filterable=True, searchable=True, default_page_size=8)

    with ui.card():
        ui.card_header("What's visible (debounced 250ms)")

        @render.code
        def state():
            return f"filtered {tbl.filtered()}\nsearch {tbl.search()!r}"
Filtering the manufacturer column to “acur” and searching “midsize”:
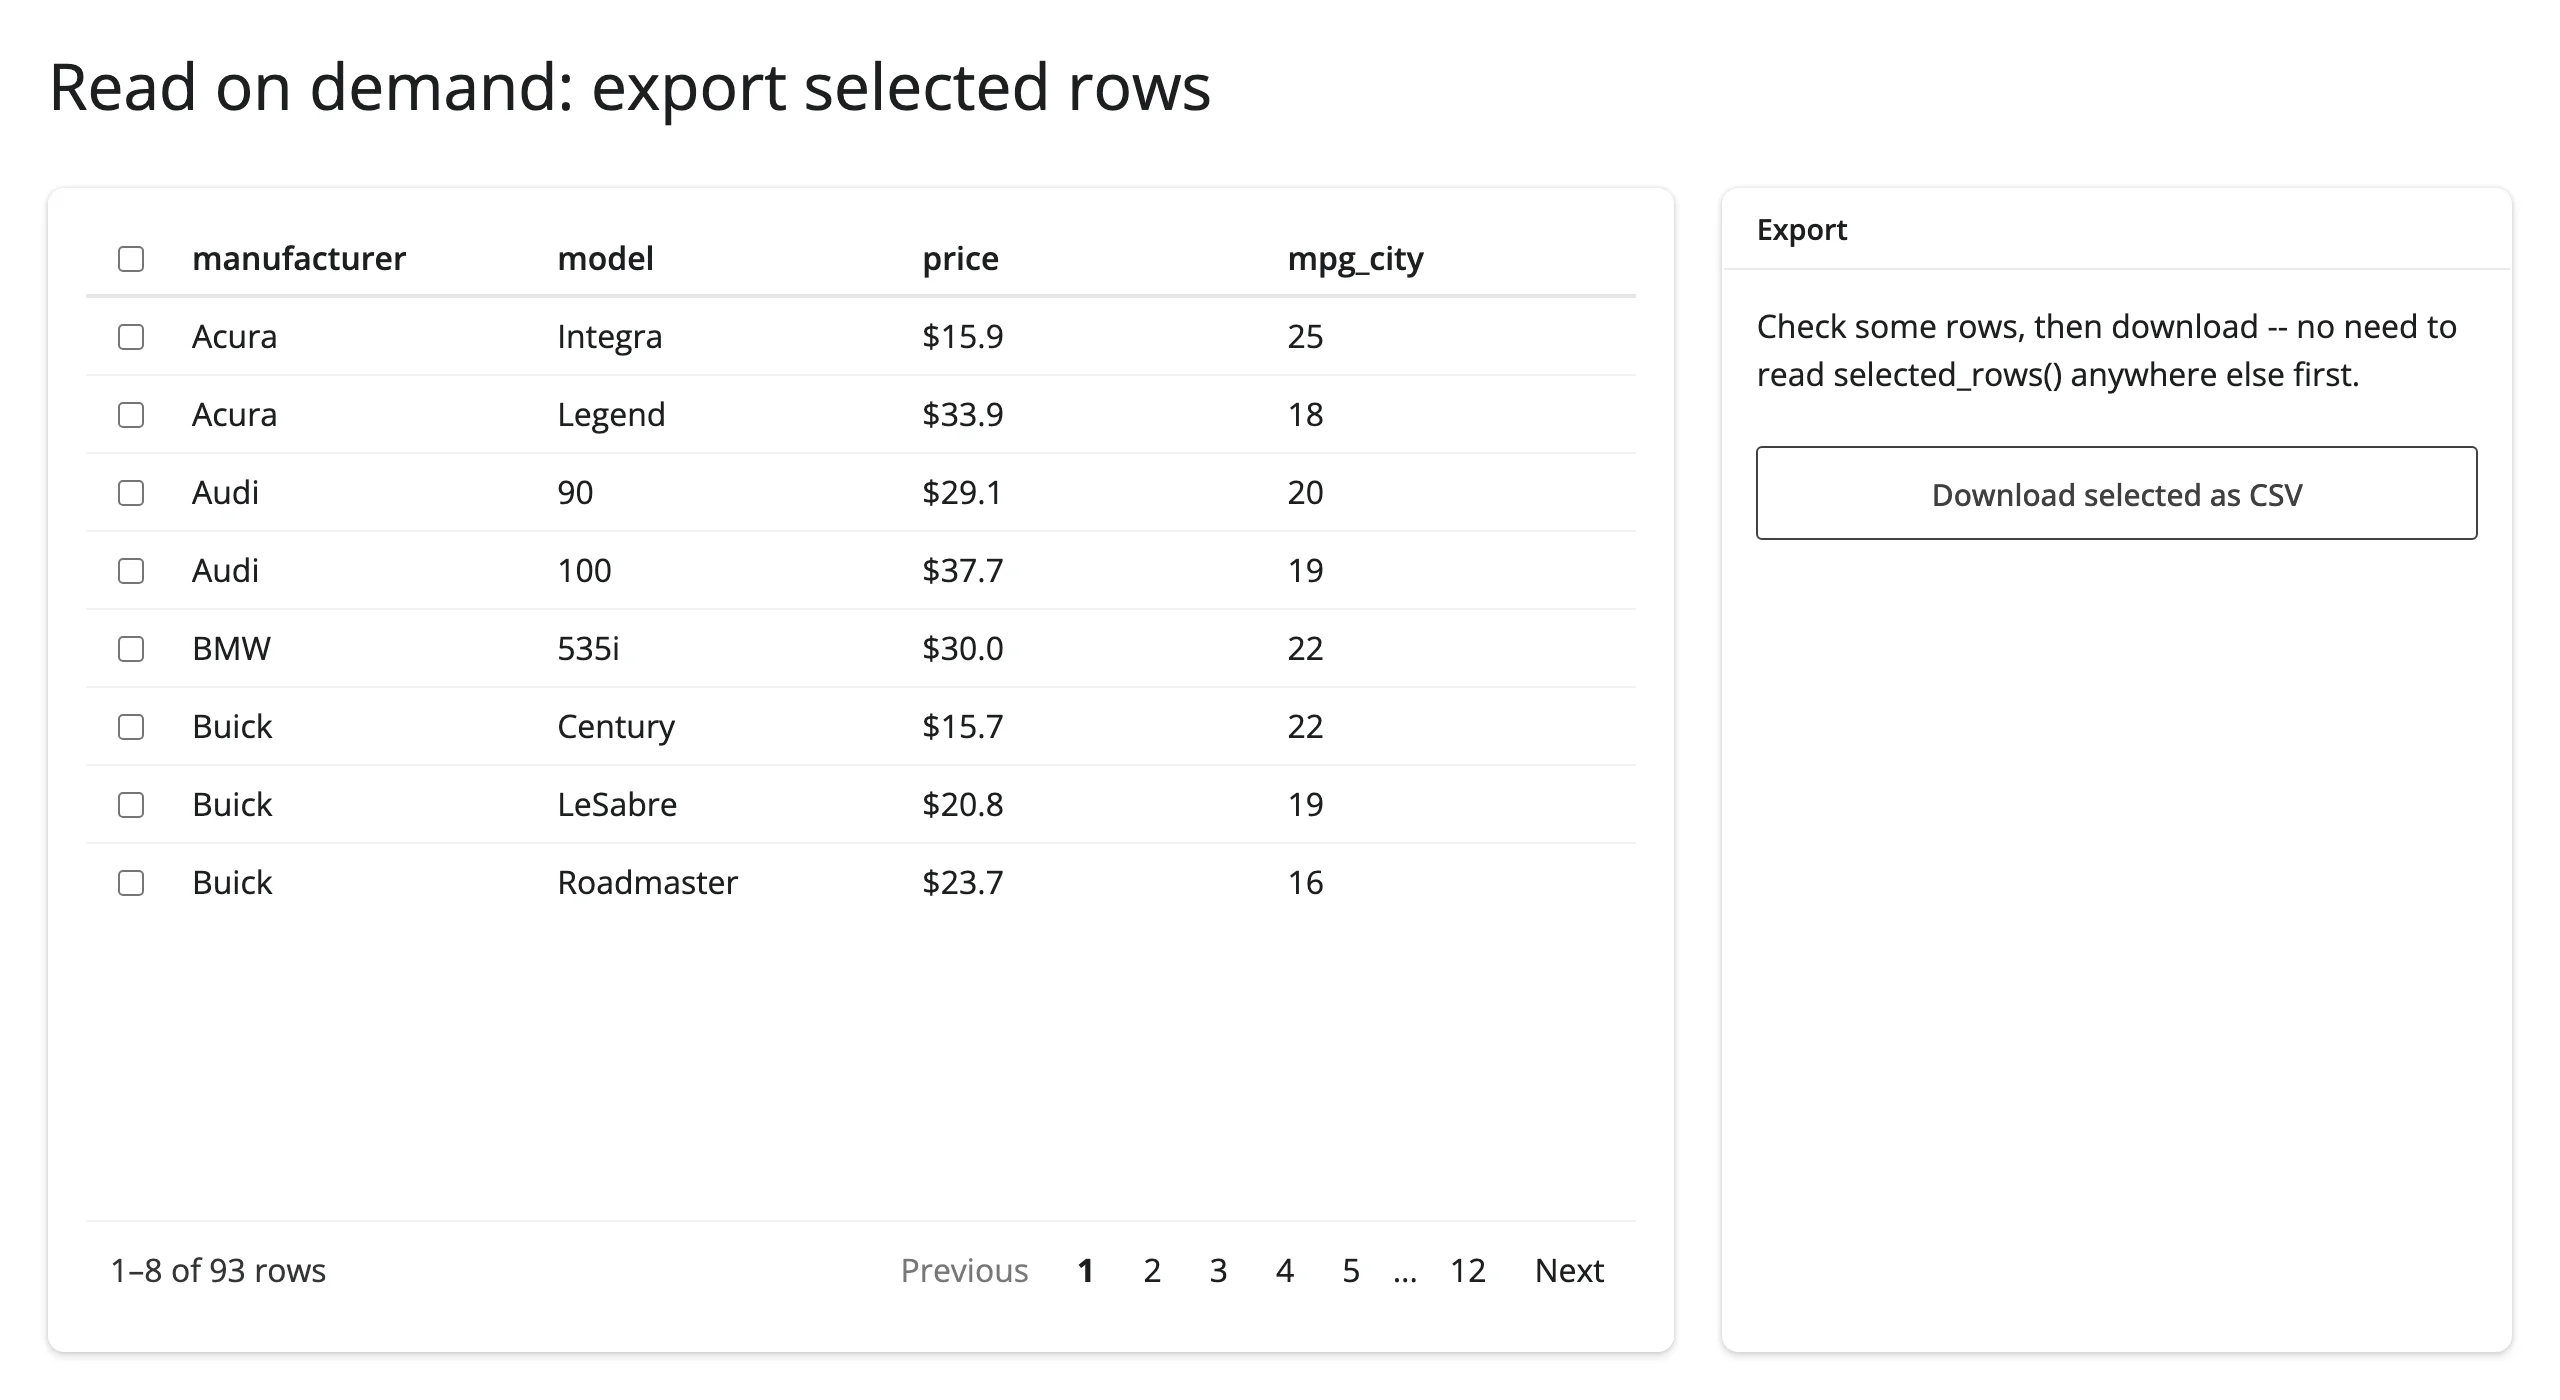
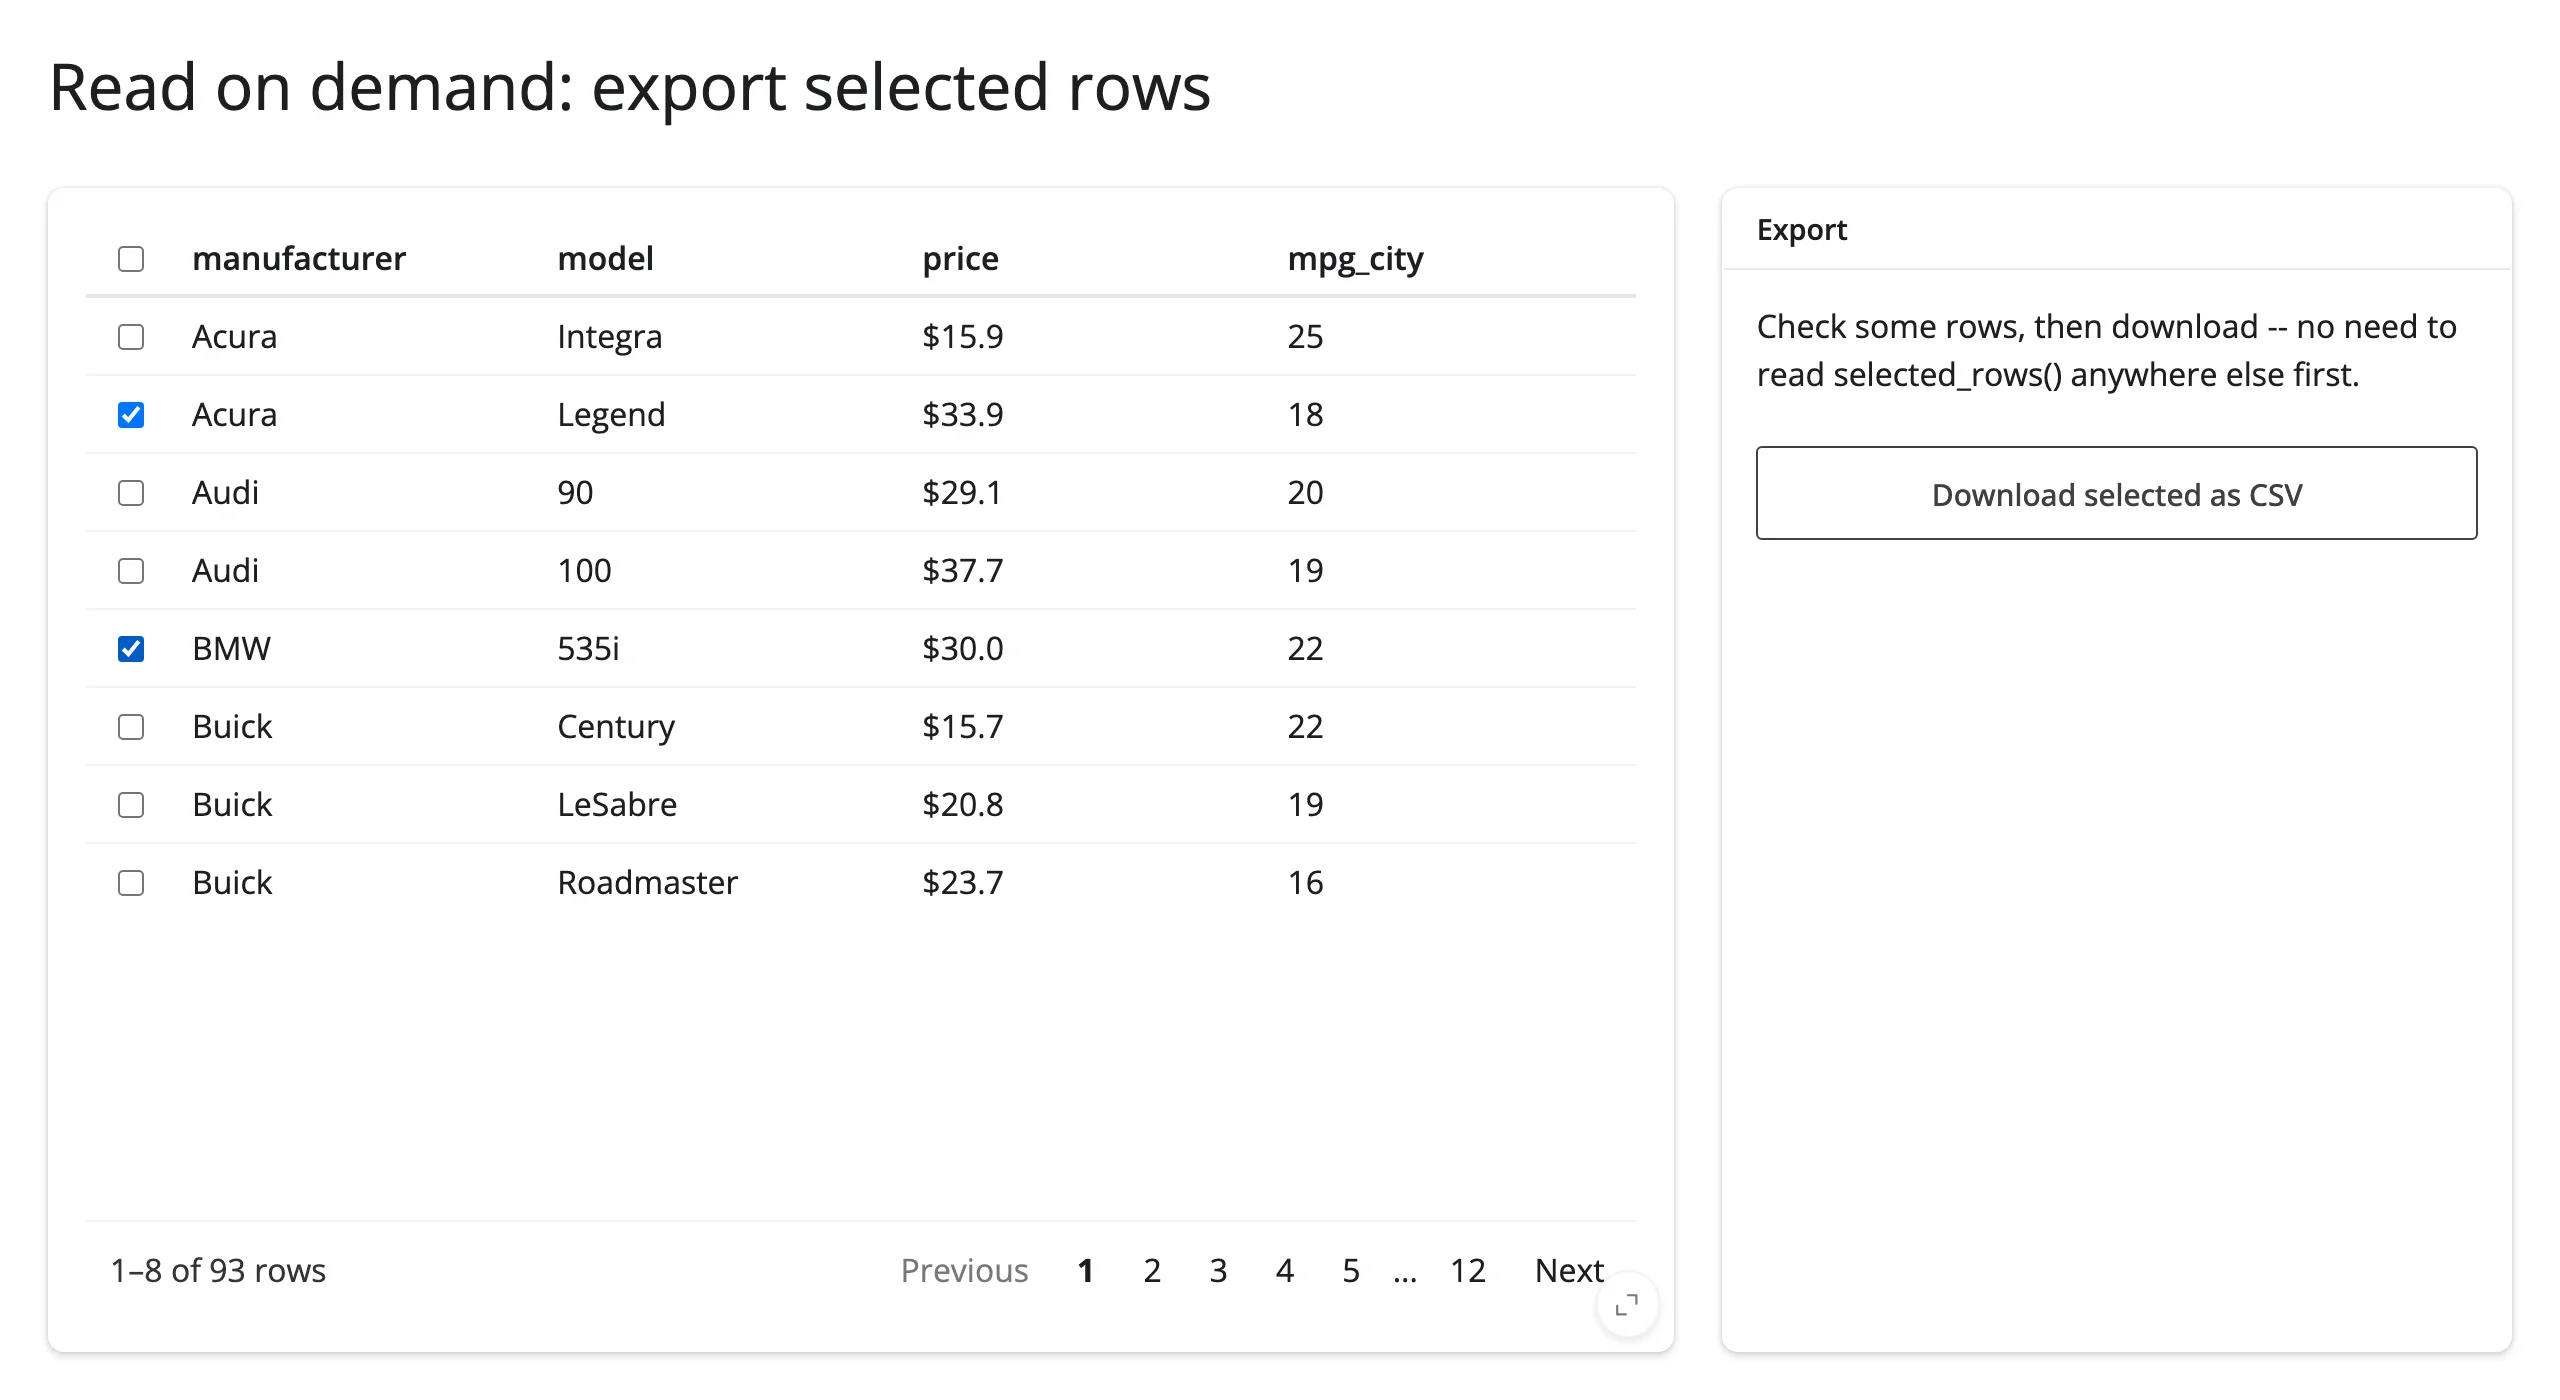
Read on demand: export selected rows
Because an accessor is live from the moment the table renders, you can read it the instant you need the value – in a download handler, a button click, a chat tool call – with no reader warming it up beforehand. 17_export_selected.py:
import io

from reactable import ColFormat, Column, Reactable
from reactable.data import cars_93
from shiny.express import render, ui
from shinywidgets import render_reactable

ui.page_opts(title="Read on demand: export selected rows", fillable=True)

cars = cars_93.to_pandas()[["manufacturer", "model", "price", "mpg_city"]]

with ui.layout_columns(col_widths=[8, 4]):
    with ui.card(full_screen=True):

        @render_reactable
        def tbl():
            return Reactable(
                cars,
                selection="multiple",
                columns={"price": Column(format=ColFormat(prefix="$", digits=1))},
                default_page_size=8,
            )

    with ui.card():
        ui.card_header("Export")
        ui.p("Check some rows, then download -- no need to read selected_rows() anywhere else first.")

        # selected_rows() is live from the moment the table renders, whether
        # or not anything has read it yet, so this handler can read it cold,
        # the instant the user clicks download: no warm-up reader required.
        @render.download_button(filename="selected_cars.csv", label="Download selected as CSV")
        def download_csv():
            rows = tbl.selected_rows()
            buf = io.StringIO()
            cars.iloc[rows].to_csv(buf, index=False)
            yield buf.getvalue()
Checking two rows, then downloading – the exported CSV contains exactly those two rows, read cold at click time:
Row clicks: the on_click escape hatch
Clicks aren’t part of reactable’s reported state, so no accessor sees them. reactable’s own on_click=JS(...) prop can forward a click as an ordinary Shiny input instead. 16_row_click.py:
from reactable import JS, Reactable
from reactable.data import cars_93
from shiny import req
from shiny.express import input, render, ui
from shinywidgets import render_reactable

ui.page_opts(title="Row clicks via on_click", fillable=True)

cars = cars_93.to_pandas()[["manufacturer", "model", "price"]]

# Clicks aren't part of reactable's reported state, so no accessor sees them.
# reactable's own `on_click=JS(...)` prop can forward a click as an ordinary
# Shiny input instead.
on_click = JS(
    "function(rowInfo, colInfo) {"
    "  Shiny.setInputValue('row_clicked', "
    "    {row: rowInfo.index, col: colInfo.id}, {priority: 'event'});"
    "}"
)

with ui.layout_columns(col_widths=[8, 4]):
    with ui.card(full_screen=True):

        @render_reactable
        def tbl():
            return Reactable(cars, on_click=on_click, default_page_size=8)

    with ui.card():
        ui.card_header("input.row_clicked()")

        @render.code
        def clicked():
            req(input.row_clicked())
            return str(input.row_clicked())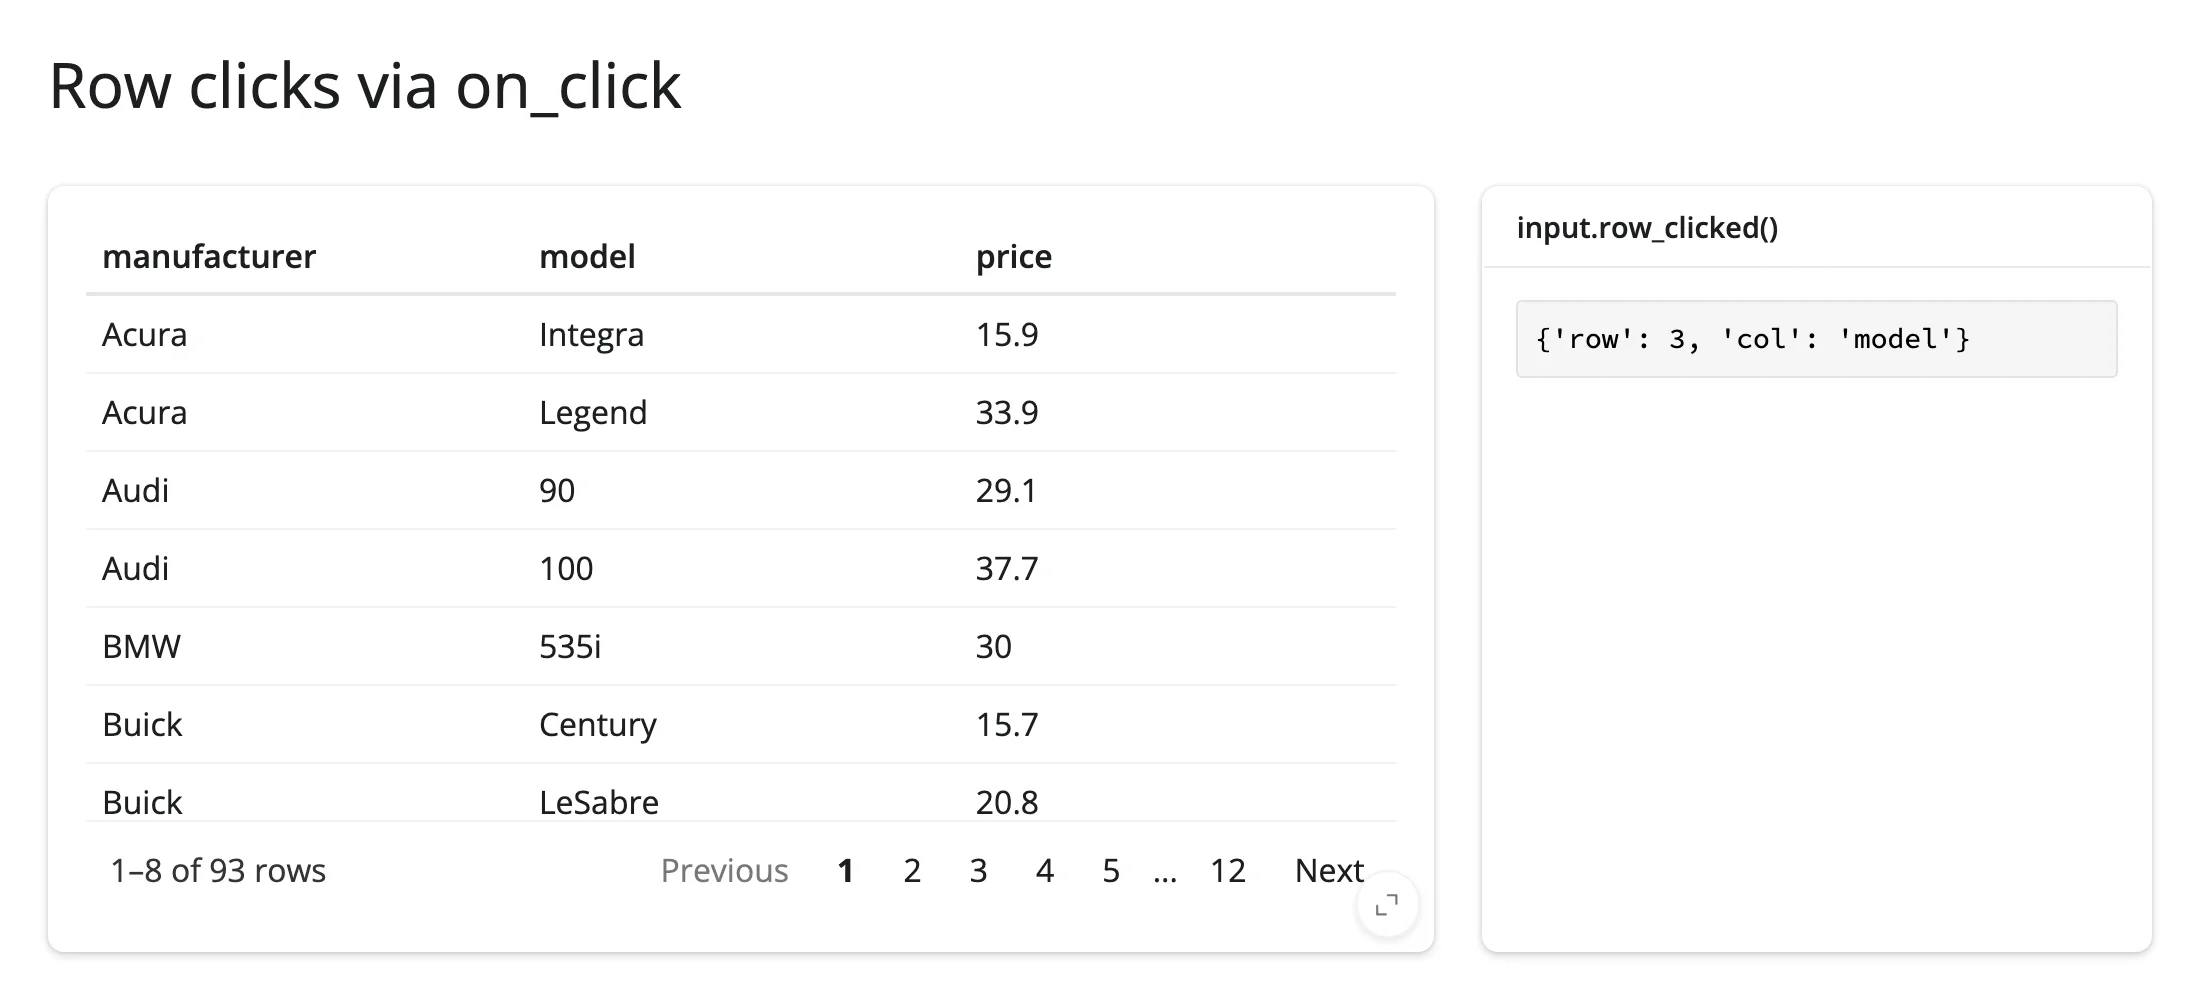
Beyond the accessors: reactive_read
There isn’t much to add here: ReactableWidget has exactly one meaningful ipywidgets trait, .props (the whole table configuration as one dict), and it changes on every prop update – including ones you make yourself (see Updating the widget from Python). reactive_read(tbl.widget, "props") would fire on your own writes as well as the user’s, so it isn’t a useful substitute for the accessors above. The accessors already cover reactable’s entire user-facing state surface.
Rate limiting
filtered() and search() debounce at 250ms by default, since both stream on every keystroke; selected_rows(), page(), and sorted() are click-driven and unthrottled. Override with rate_policy/rate_delay on the decorator – this changes the policy only for accessors that already debounce (it doesn’t add a limit to click-driven ones). 11_rate_limiting.py:
from reactable import Reactable
from reactable.data import cars_93
from shiny.express import render, ui
from shinywidgets import render_reactable

ui.page_opts(title="Rate limiting", fillable=True)

cars = cars_93.to_pandas()[["manufacturer", "model", "type", "price"]]

with ui.layout_columns(col_widths=[8, 4]):
    with ui.card(full_screen=True):
        # A longer debounce (1s) than the 250ms default: useful if reading
        # search()/filtered() triggers expensive downstream work (a database
        # query, a heavy re-plot) you don't want firing on every keystroke.
        @render_reactable(rate_policy="debounce", rate_delay=1.0)
        def tbl():
            return Reactable(cars, searchable=True, default_page_size=8)

    with ui.card():
        ui.card_header("search() (1s debounce)")

        @render.code
        def state():
            return repr(tbl.search())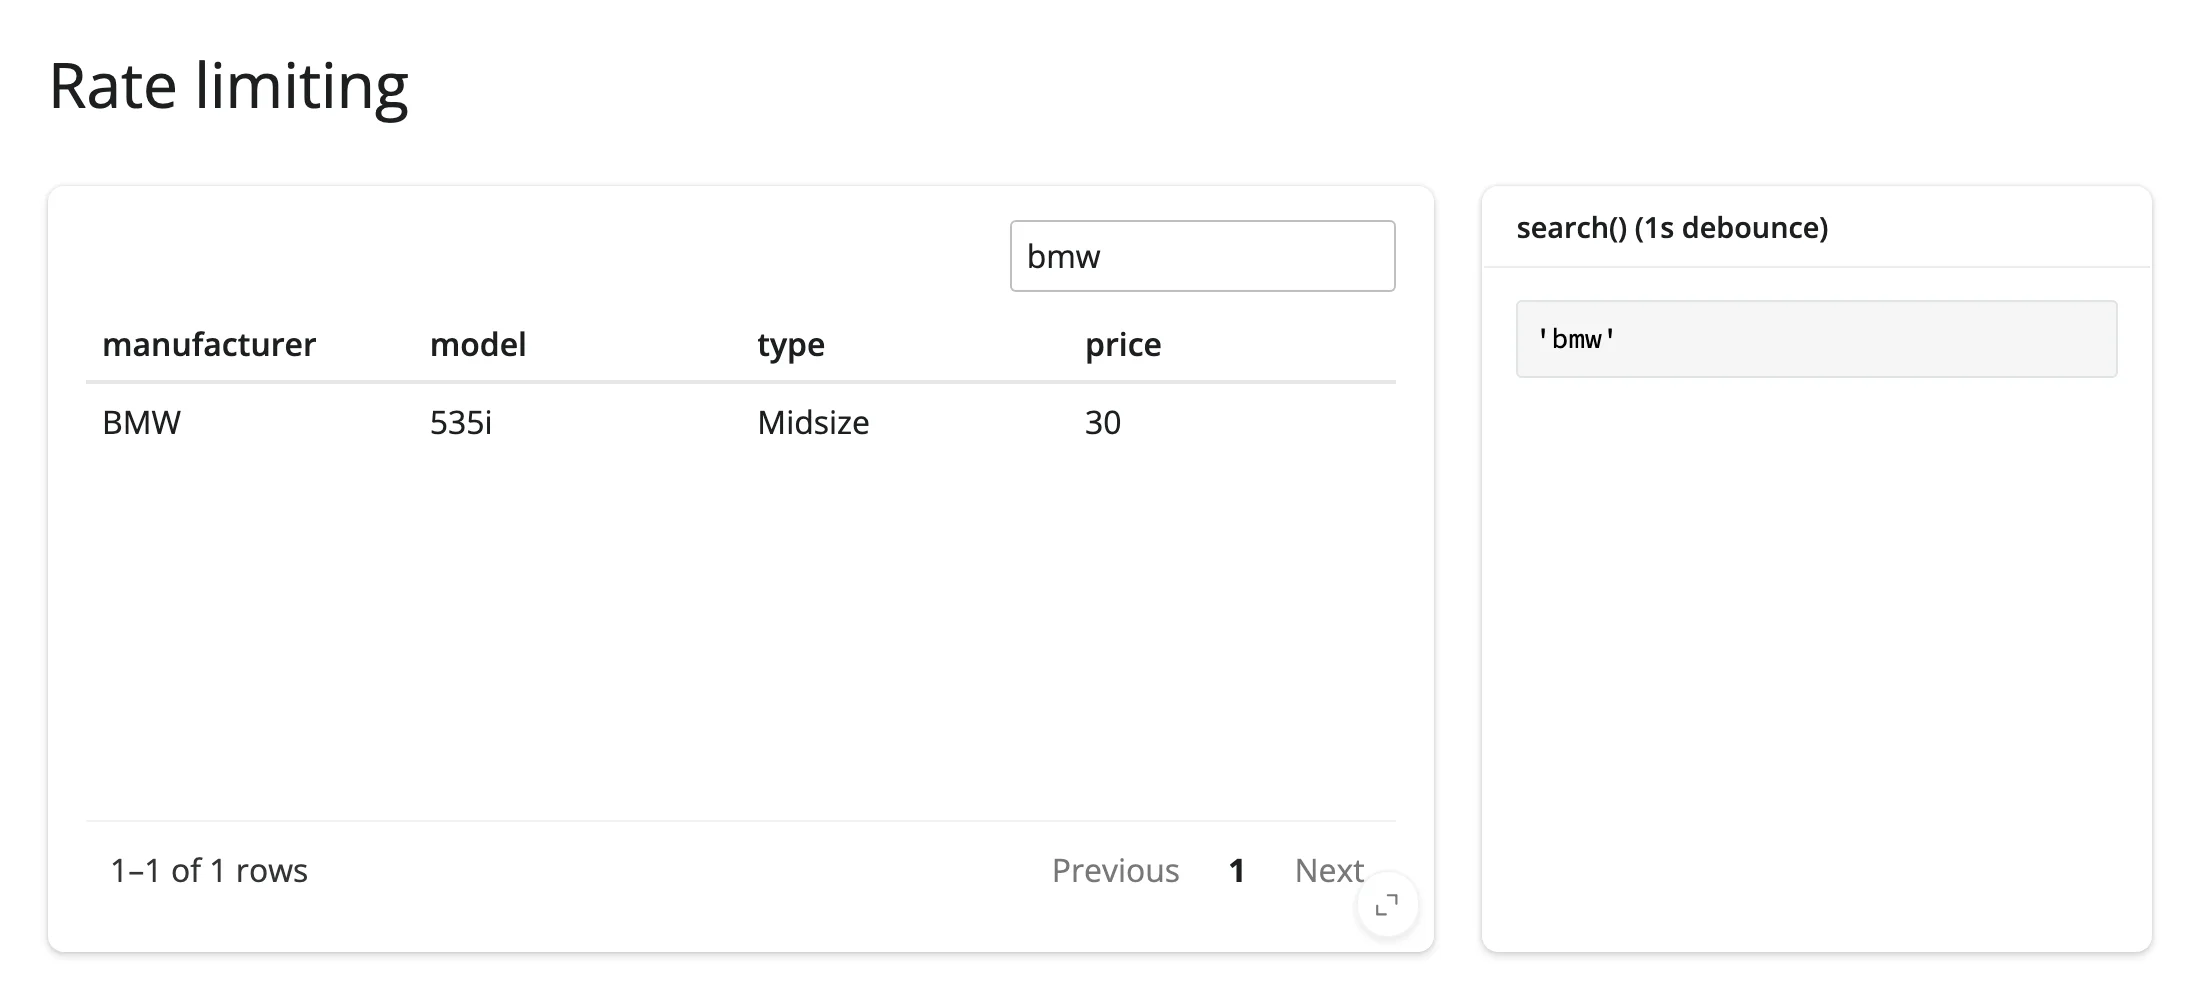
Updating the widget from Python
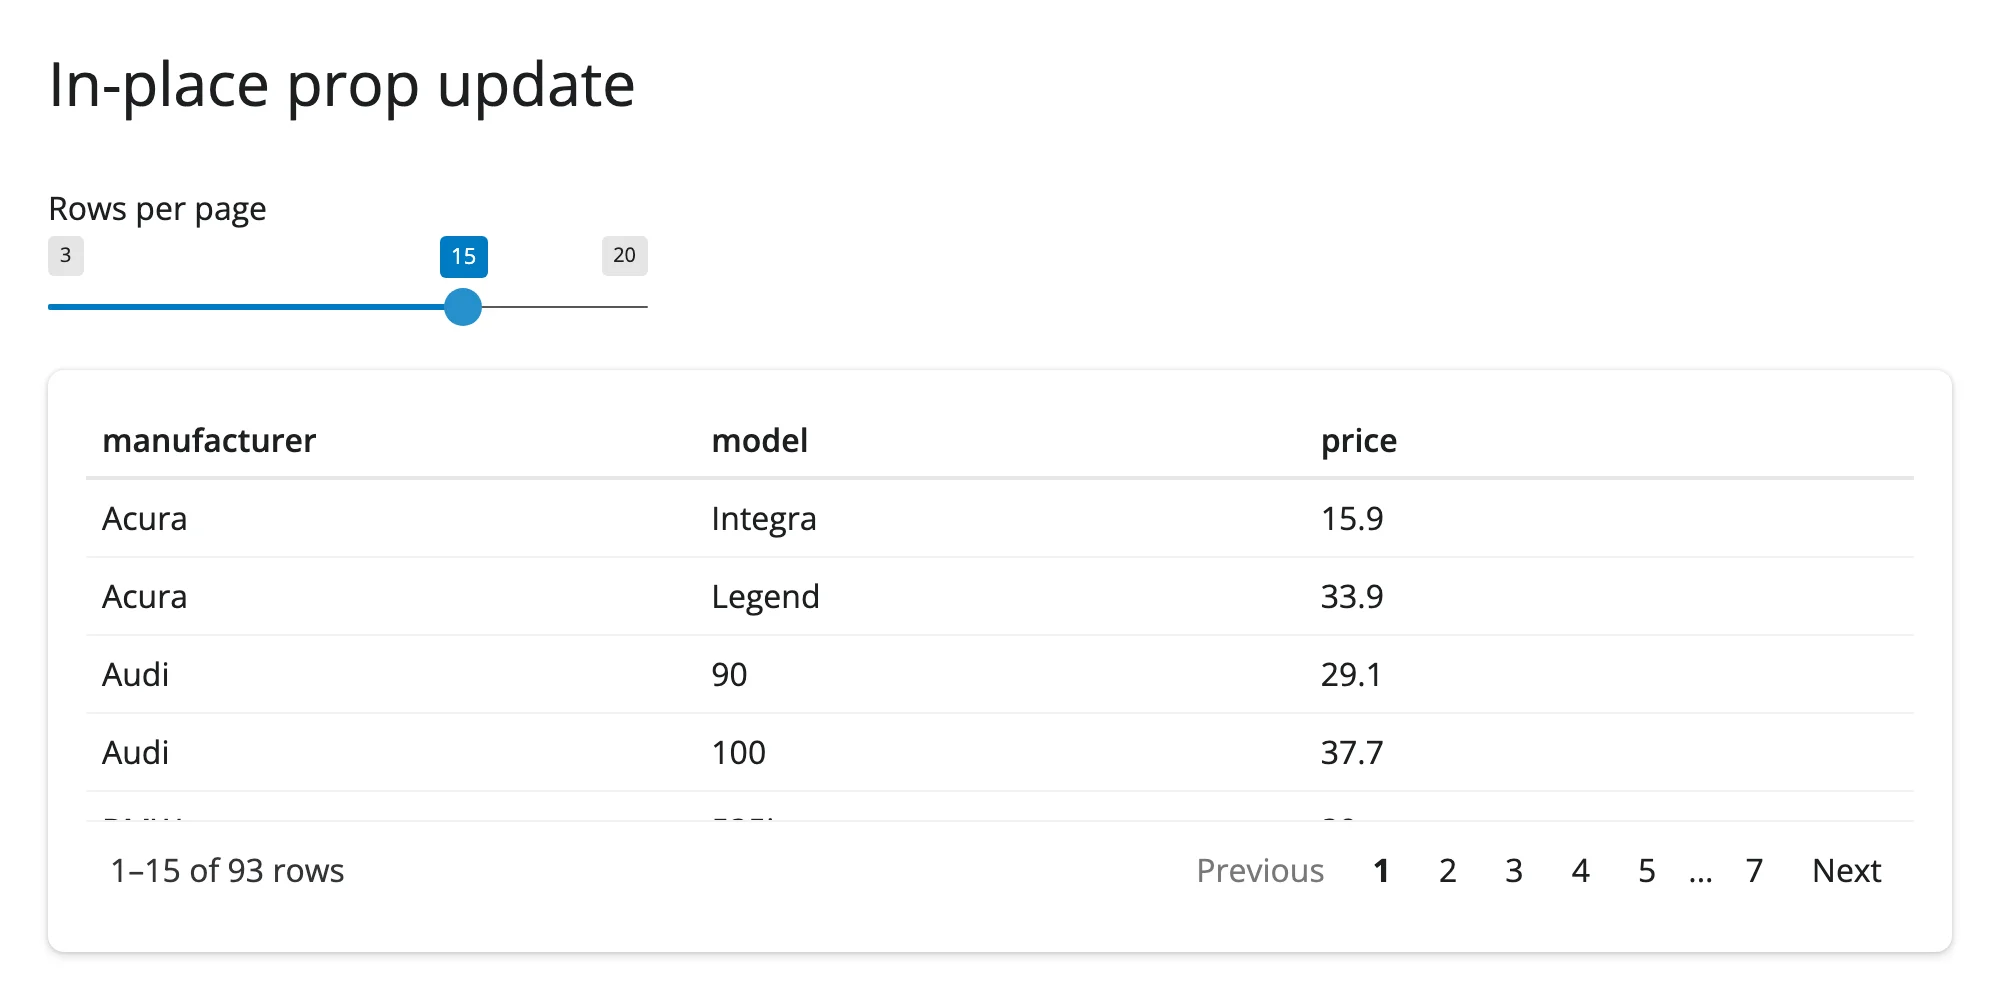
Two ways to change a rendered table: re-render (have the render function depend on a reactive and return a new Reactable) or update .widget.props in place inside a @reactive.effect. Re-rendering is simplest and always correct – it creates a fresh widget, so the user’s sort, filter, page, and selection reset to the table’s defaults, matching ordinary Shiny semantics.
Updating .widget.props in place is cheaper (no new widget, no re-sent dependencies) and, for non-data props like defaultPageSize, is the documented pattern:
@reactive.effect
def _():
    # A non-data prop updates the mounted widget directly: no re-render,
    # no re-sent JS bundle, and any sort/filter/selection stays intact.
    w = tbl.widget
    if w is not None:
        w.props = {**w.props, "defaultPageSize": input.page_size()}
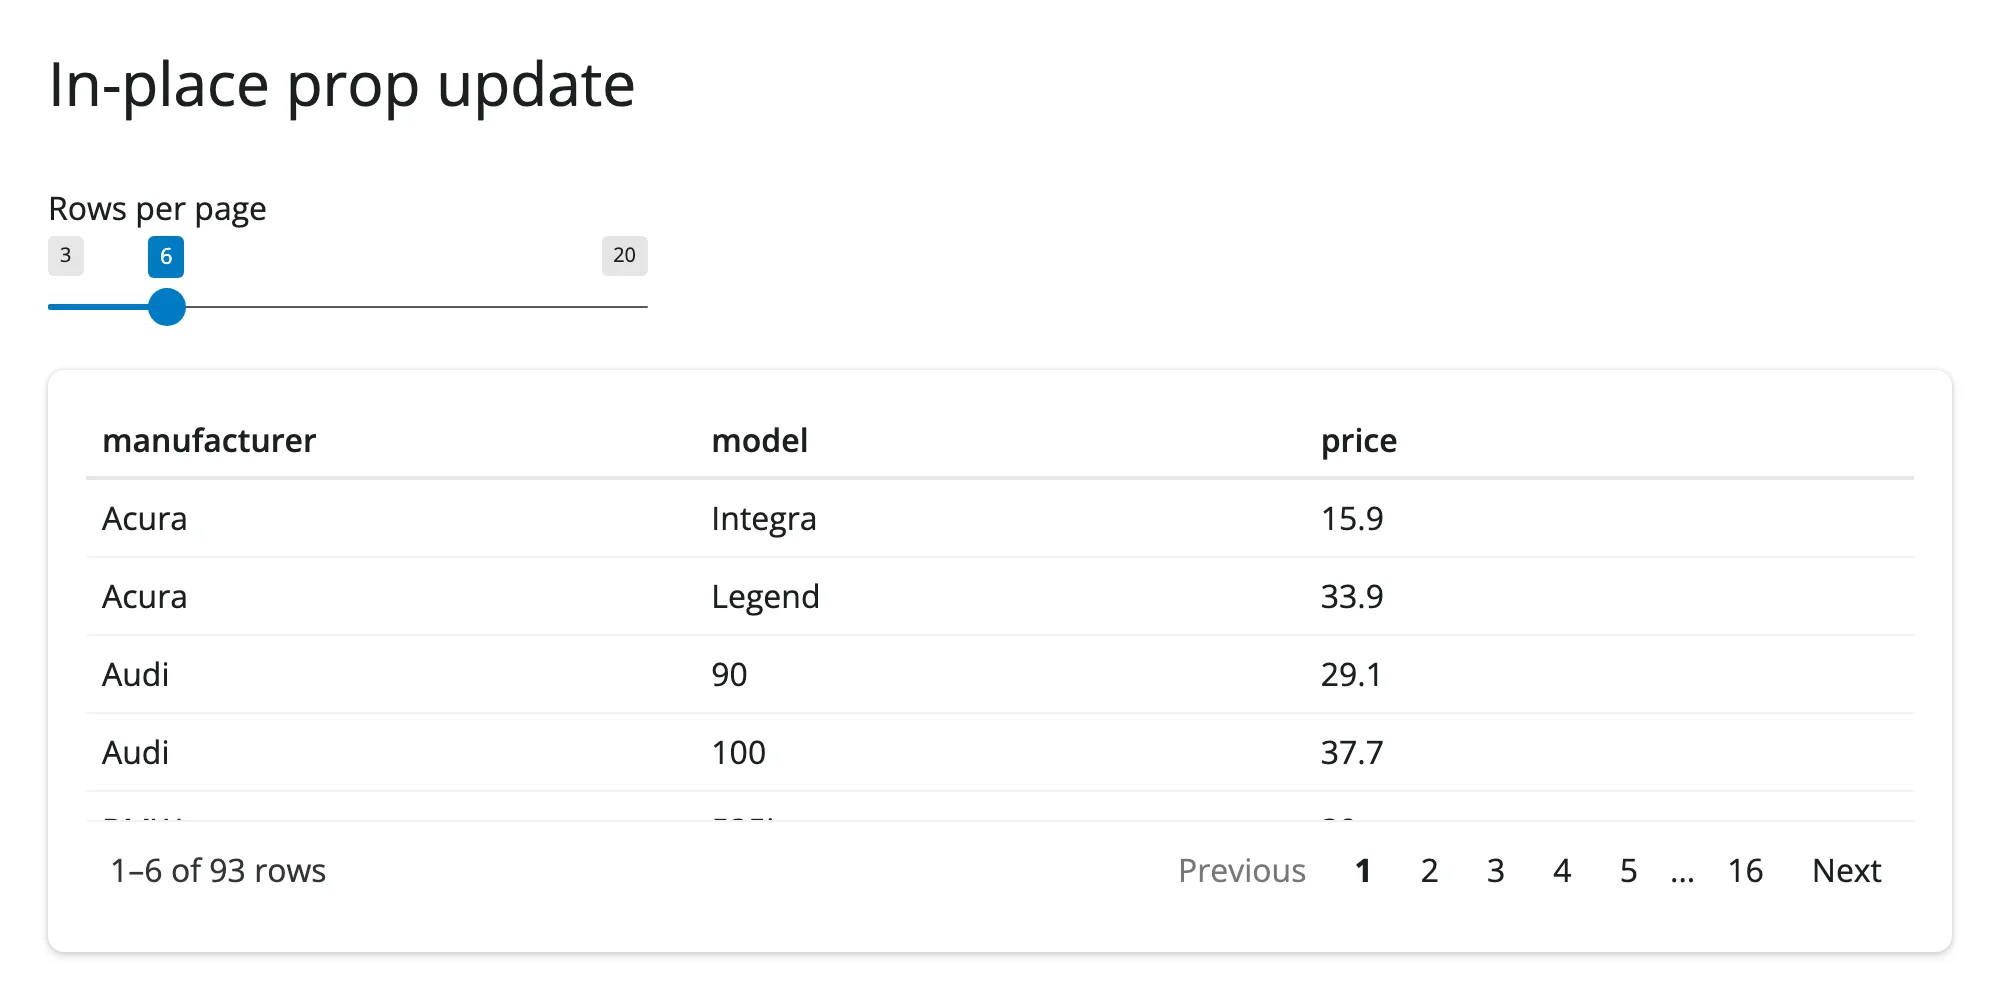
12_inplace_props.py – before and after dragging the slider to 15:
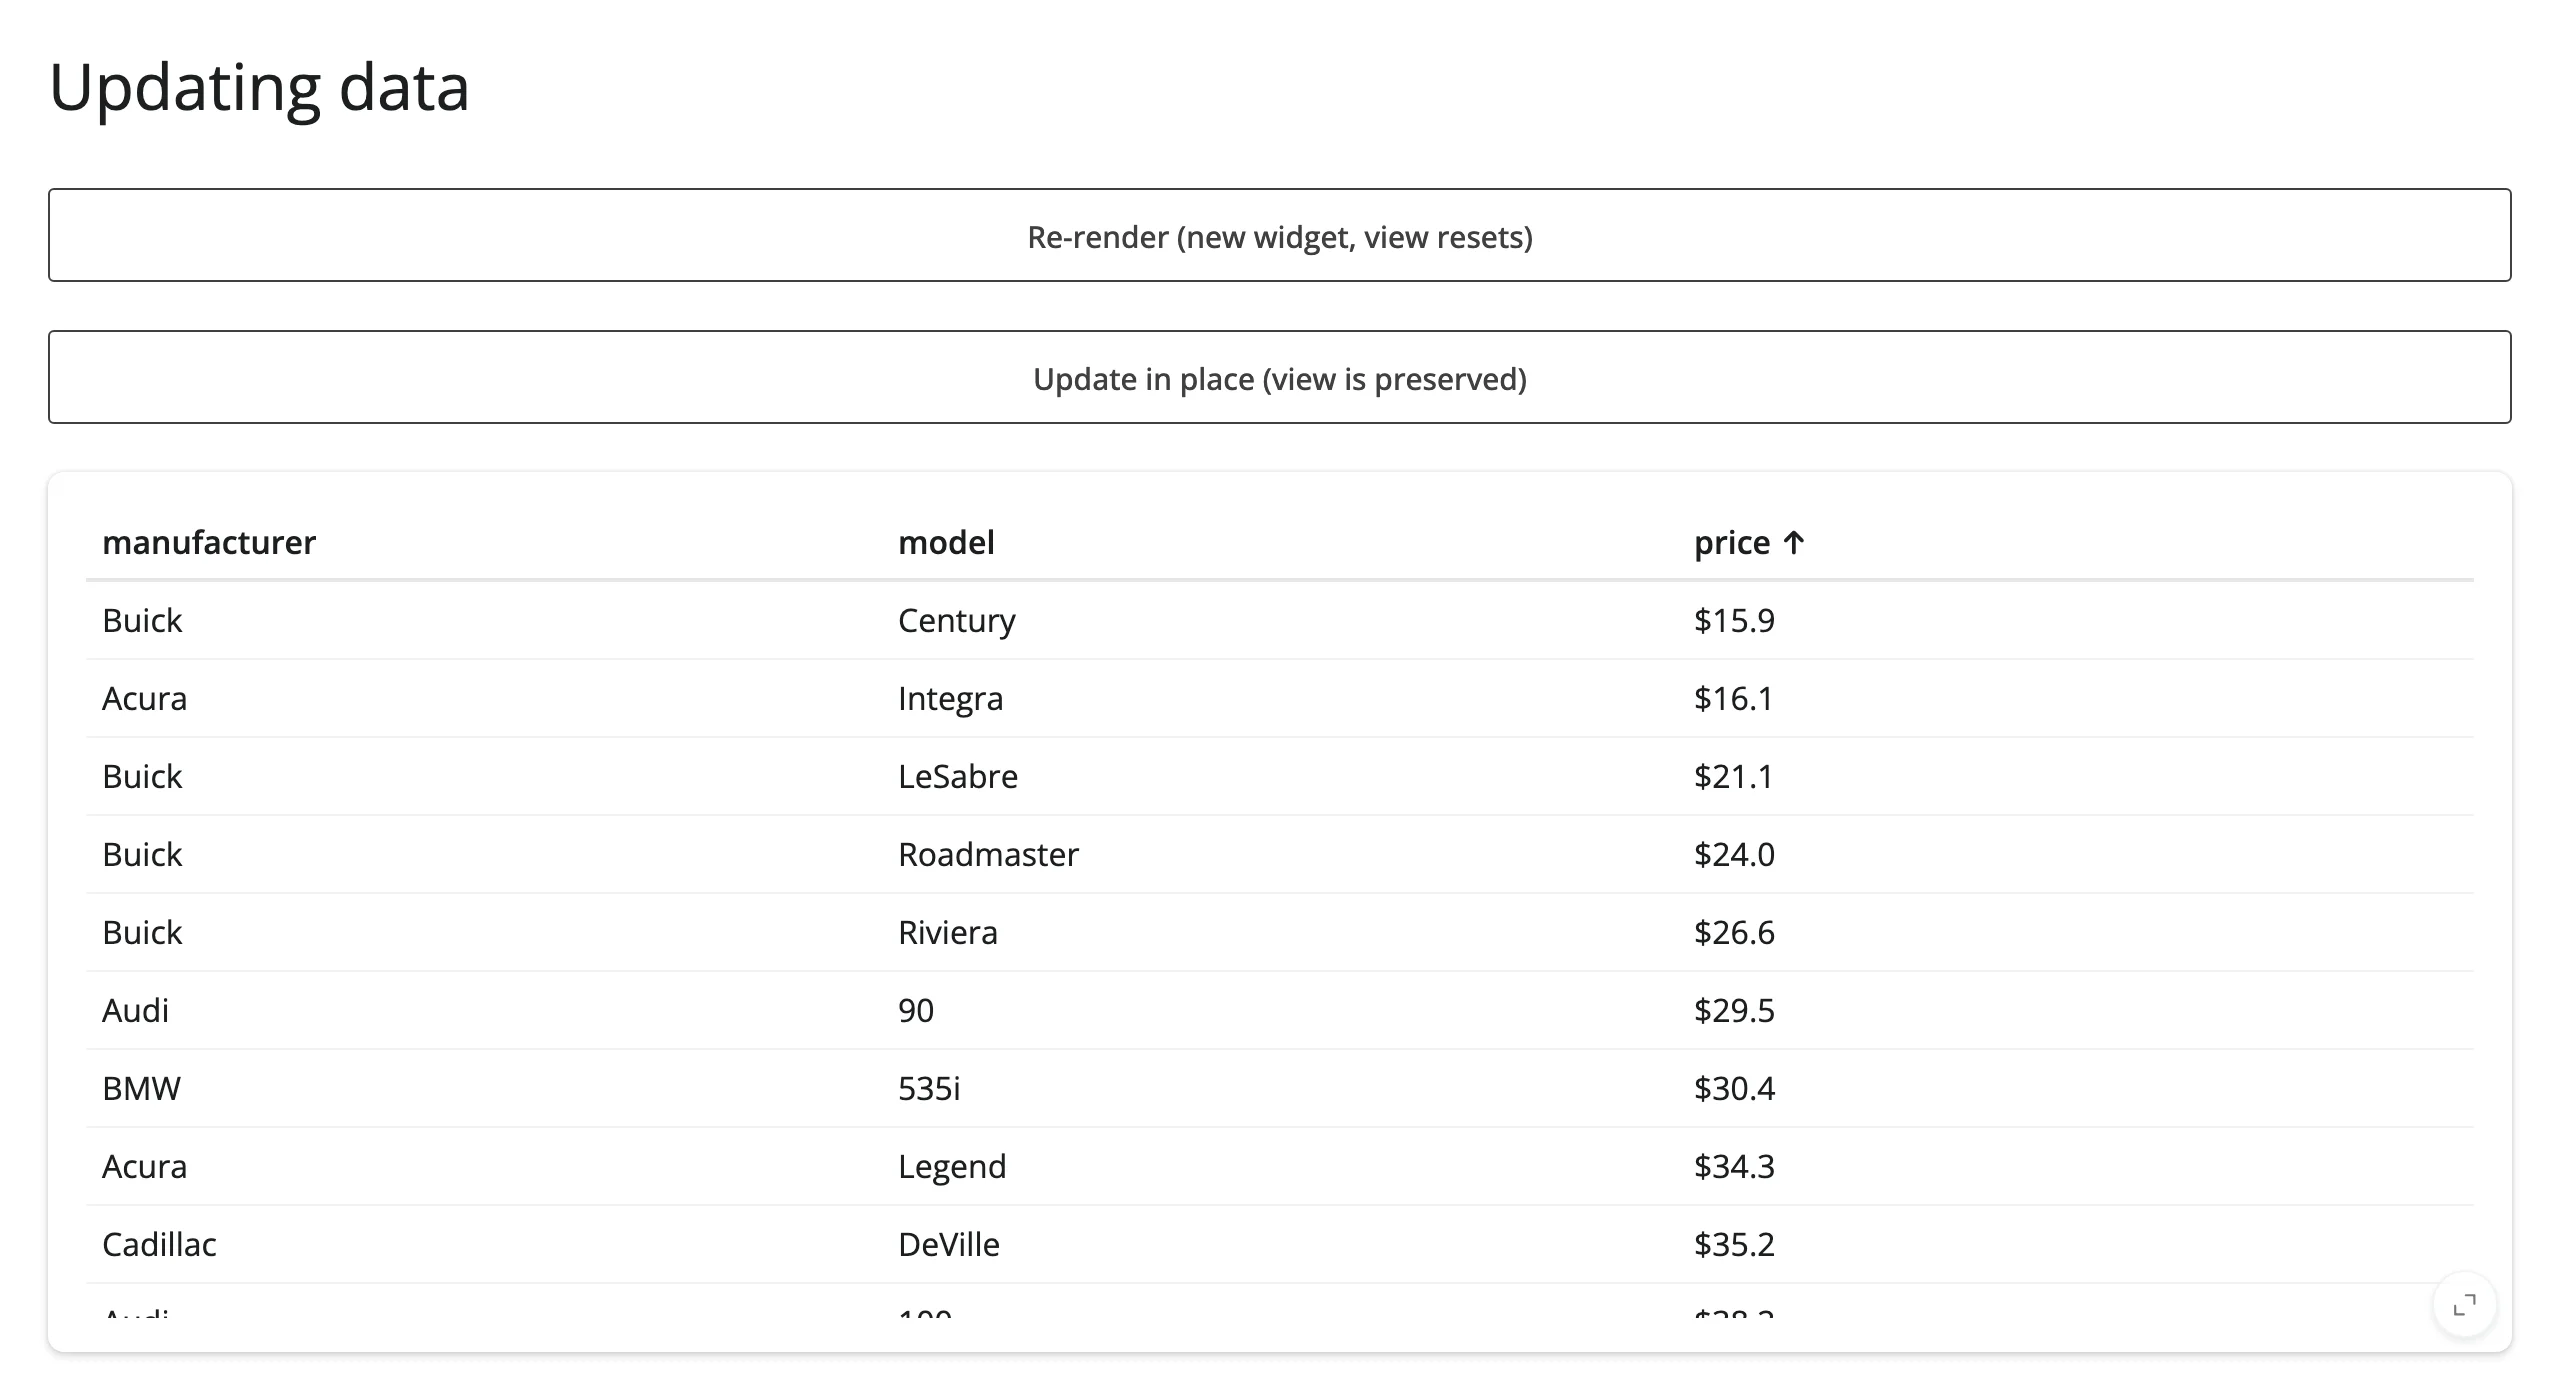
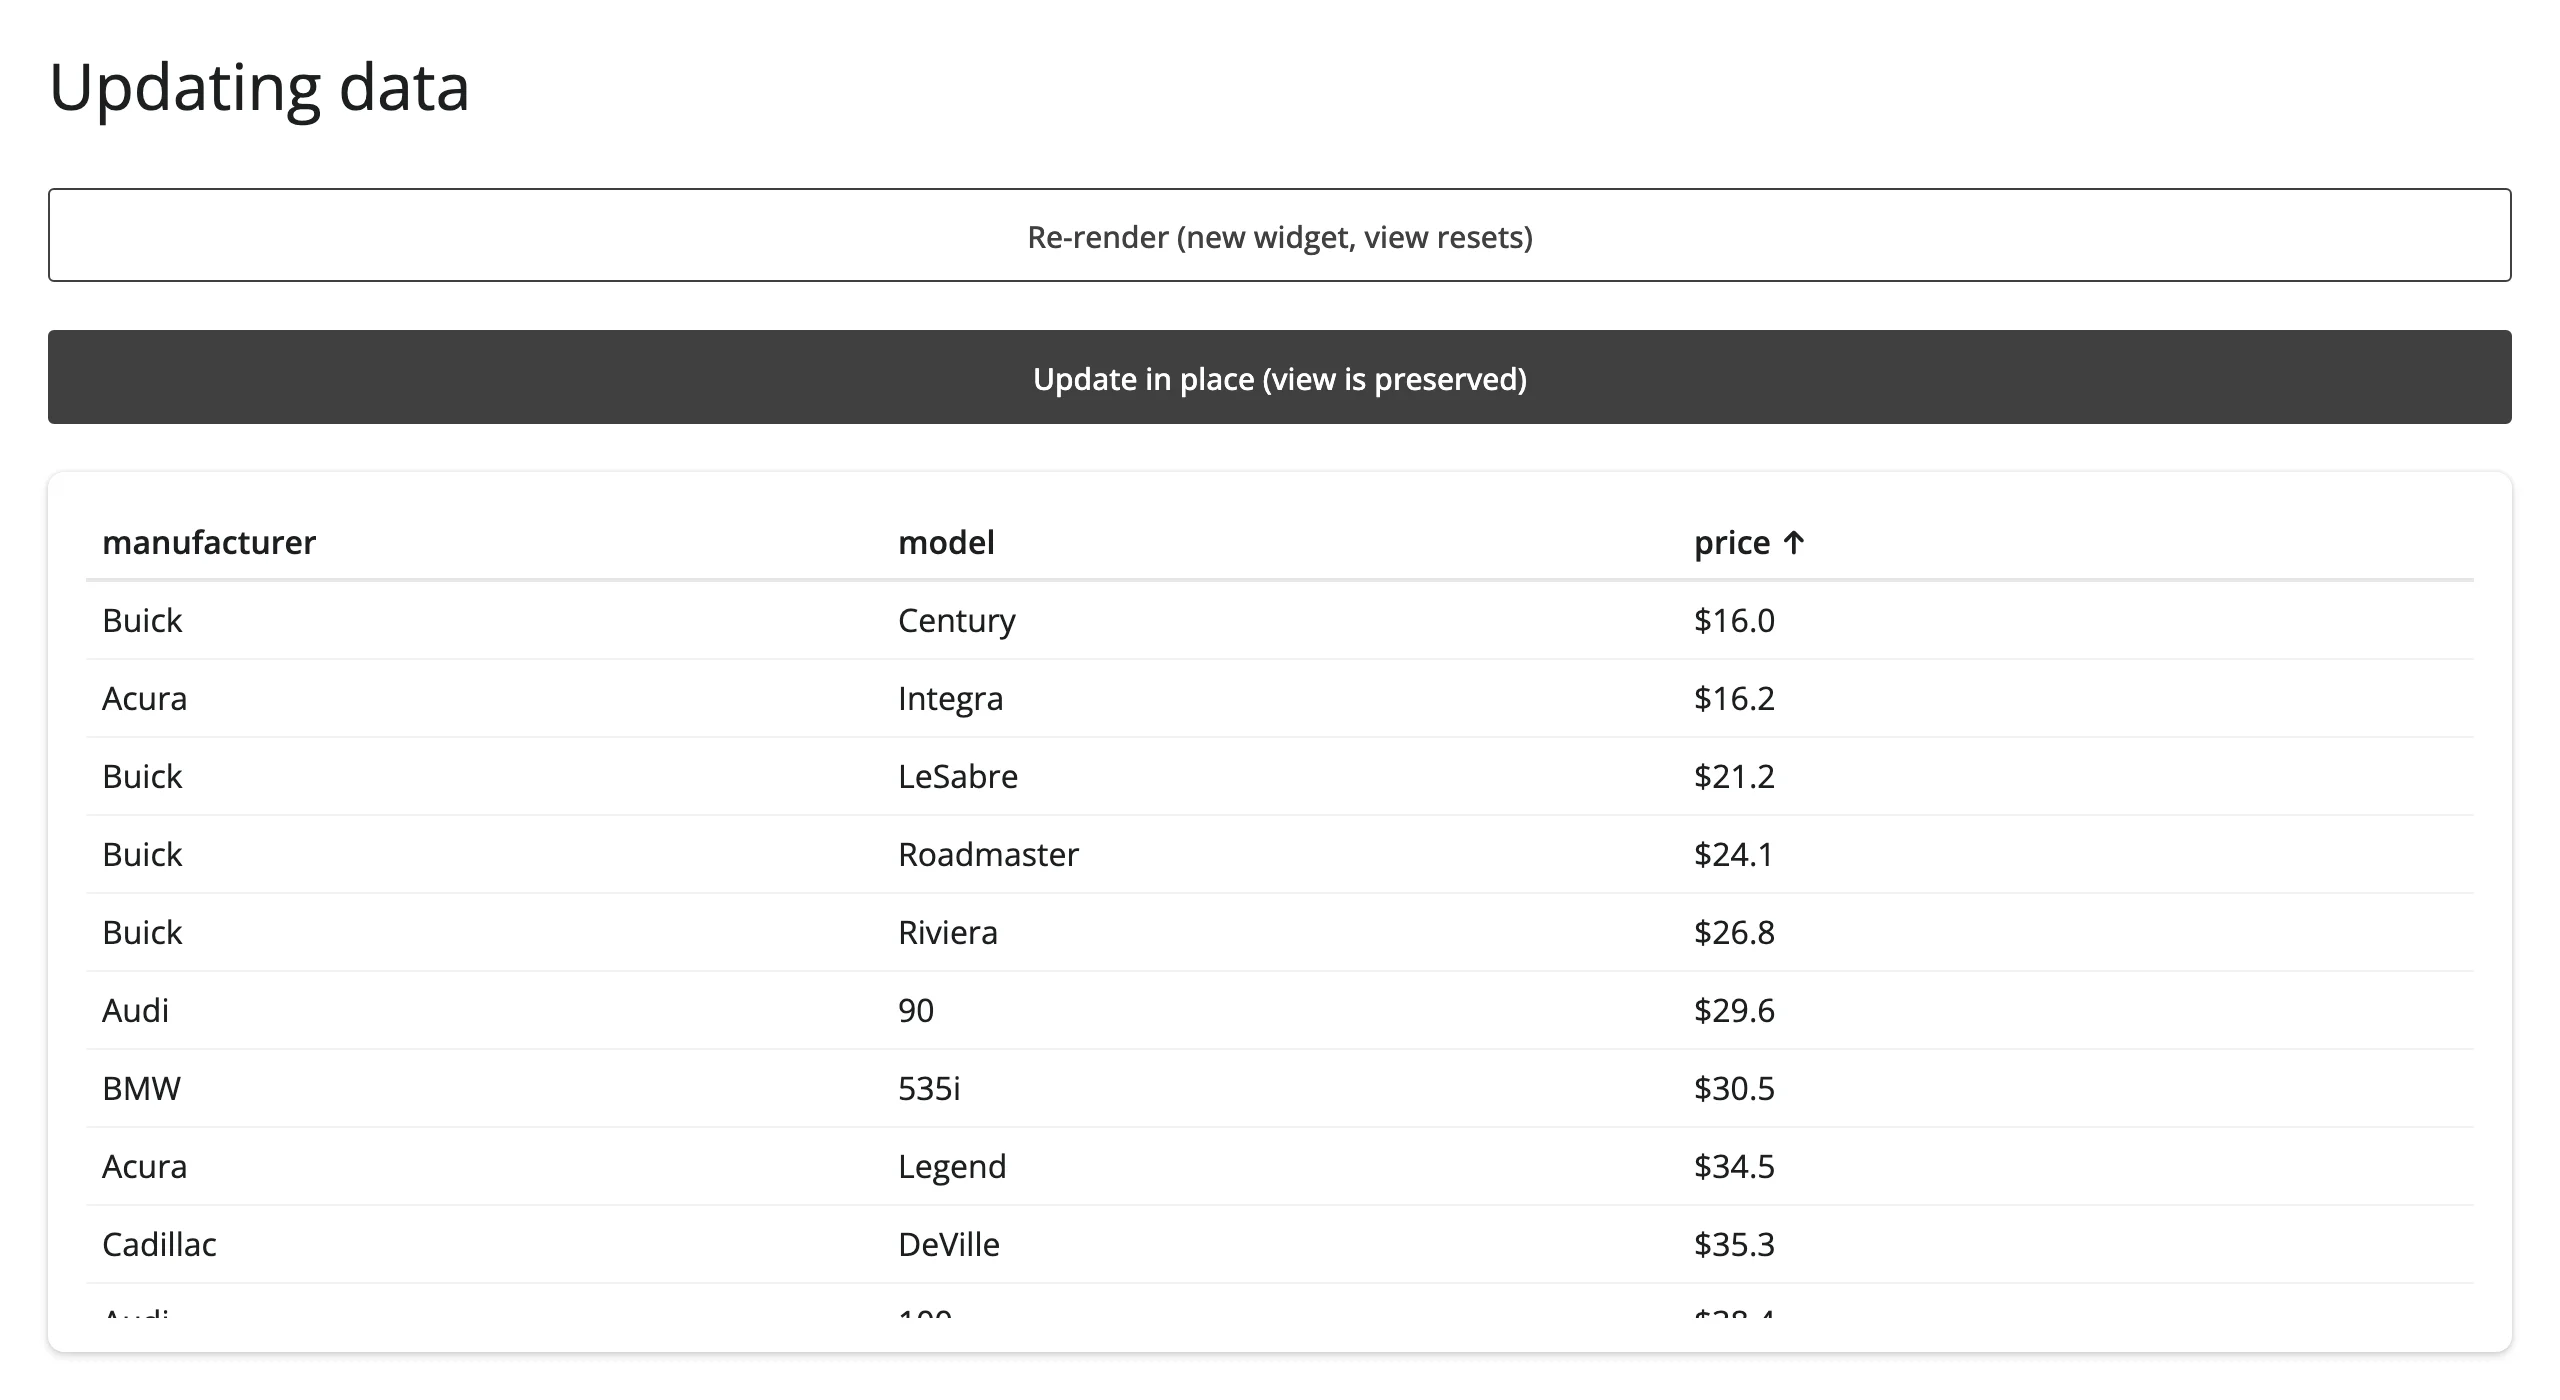
The same pattern updates the table’s data, not just its non-data props. Reassign .widget.props with a new "data" entry (mutating .widget.props["data"] in place without reassigning the dict never syncs, since props is a traitlets trait) and the table refreshes while the user’s current sort, filter, page, and selection stay put, because it’s still the same widget instance:
@reactive.effect
@reactive.event(input.inplace)
def _():
    w = tbl.widget
    if w is None:
        return
    prices = [round(p, 1) for p in cars["price"] * random.uniform(0.8, 1.2)]
    # Reassigning `props["data"]` (not mutating the dict in place)
    # refreshes the table and keeps the current sort, filters, page, and
    # selection as the user left them.
    w.props = {**w.props, "data": {**w.props["data"], "price": prices}}
13_update_data.py – sorted by price ascending, then updated in place (values change, order is preserved) vs. re-rendered (order resets):
Use re-render when the data genuinely changes shape (different columns, a totally different query) or when you want the clean-slate reset. Use the in-place form when you’re refreshing values the user is already looking at and want to preserve their sort/filter/page/selection – a live-updating price column, for example.
Coordinating multiple views
Selection drives a detail card
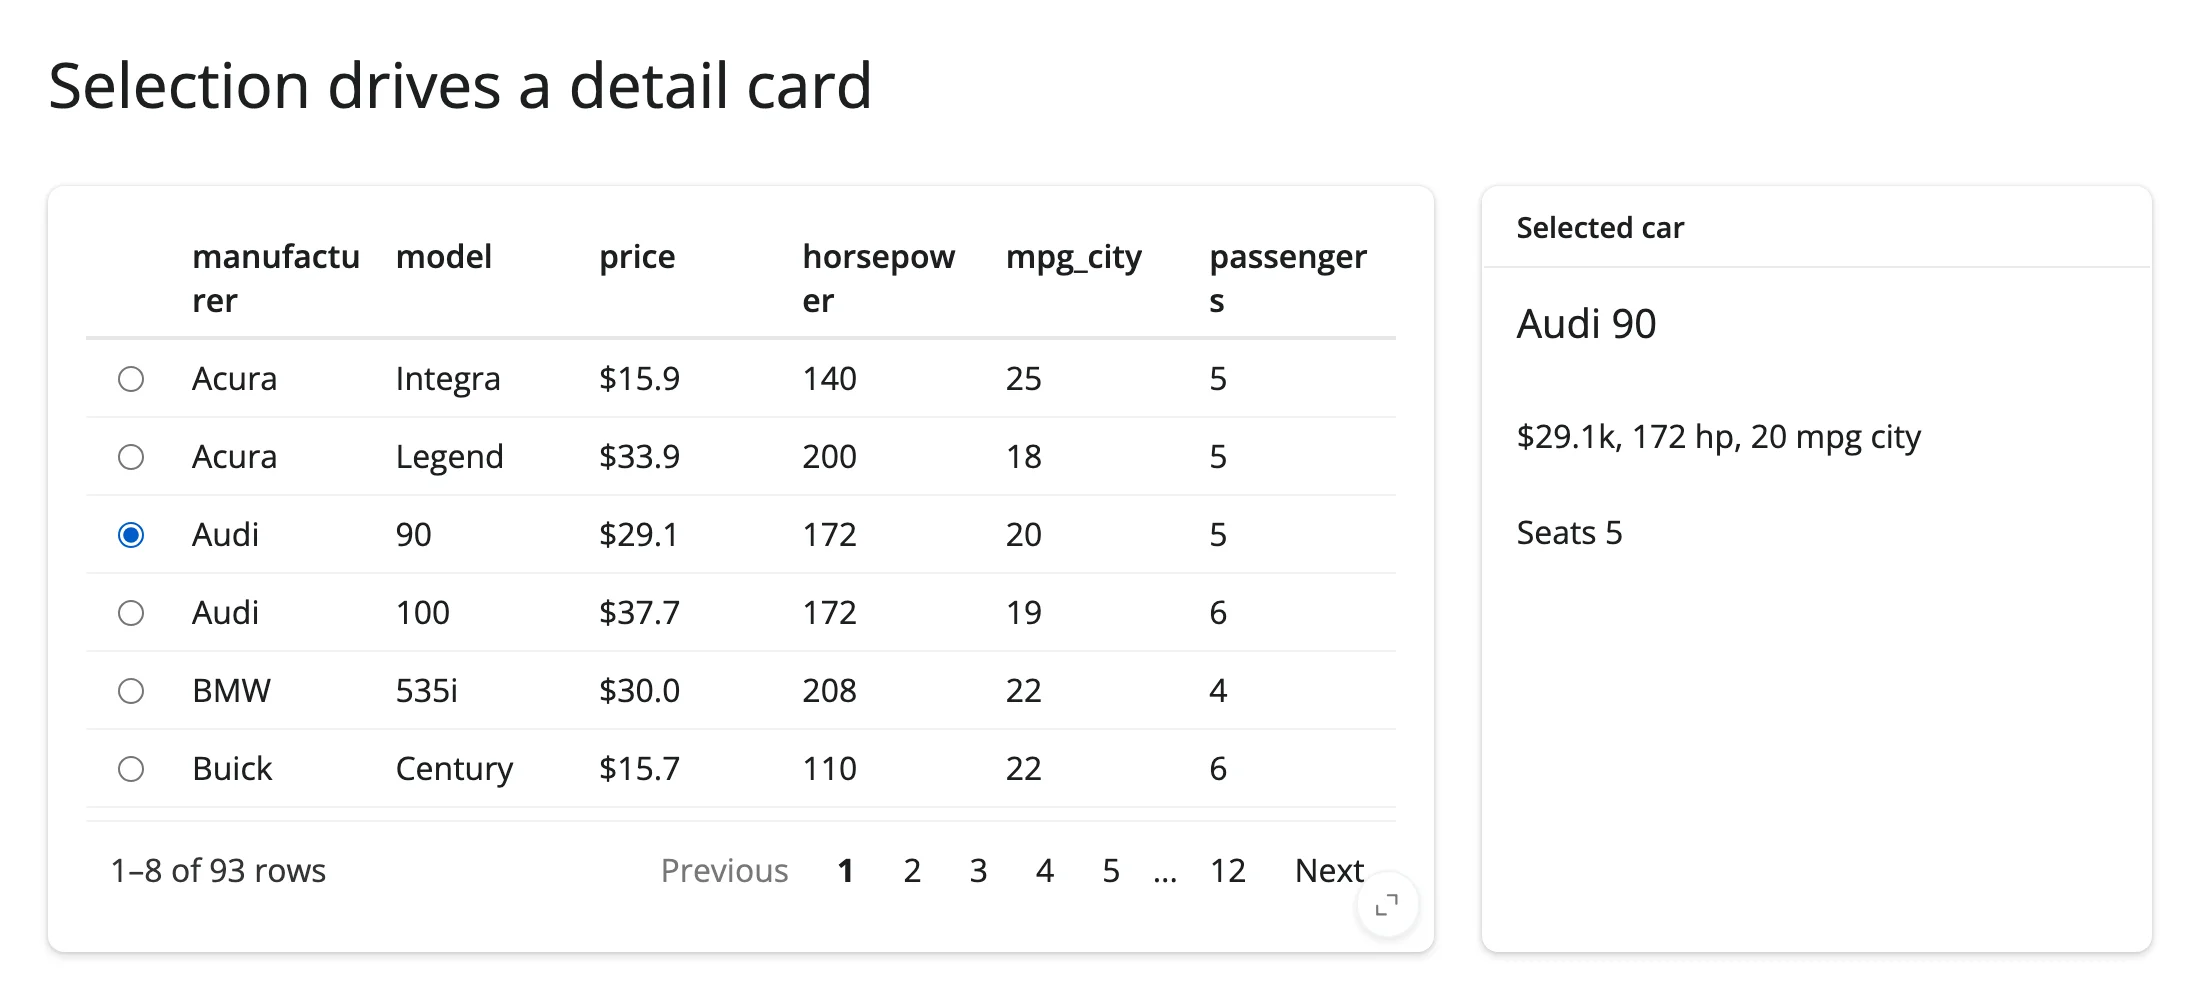
selected_rows() gives positions in the currently-rendered data, so df.iloc[rows] gets you the selected records. on_click="select" lets a row click toggle selection (in addition to the checkbox). 14_selection_to_detail.py:
from reactable import ColFormat, Column, Reactable
from reactable.data import cars_93
from shiny import req
from shiny.express import render, ui
from shinywidgets import render_reactable

ui.page_opts(title="Selection drives a detail card", fillable=True)

cars = cars_93.to_pandas()[
    ["manufacturer", "model", "price", "horsepower", "mpg_city", "passengers"]
]

with ui.layout_columns(col_widths=[8, 4]):
    with ui.card(full_screen=True):

        @render_reactable
        def tbl():
            return Reactable(
                cars,
                selection="single",
                on_click="select",
                columns={"price": Column(format=ColFormat(prefix="$", digits=1))},
                default_page_size=8,
            )

    with ui.card():
        ui.card_header("Selected car")

        @render.ui
        def detail():
            rows = tbl.selected_rows()
            req(len(rows) > 0)
            car = cars.iloc[rows[0]]
            return ui.TagList(
                ui.h5(f"{car.manufacturer} {car.model}"),
                ui.p(f"${car.price}k, {car.horsepower} hp, {car.mpg_city} mpg city"),
                ui.p(f"Seats {car.passengers}"),
            )
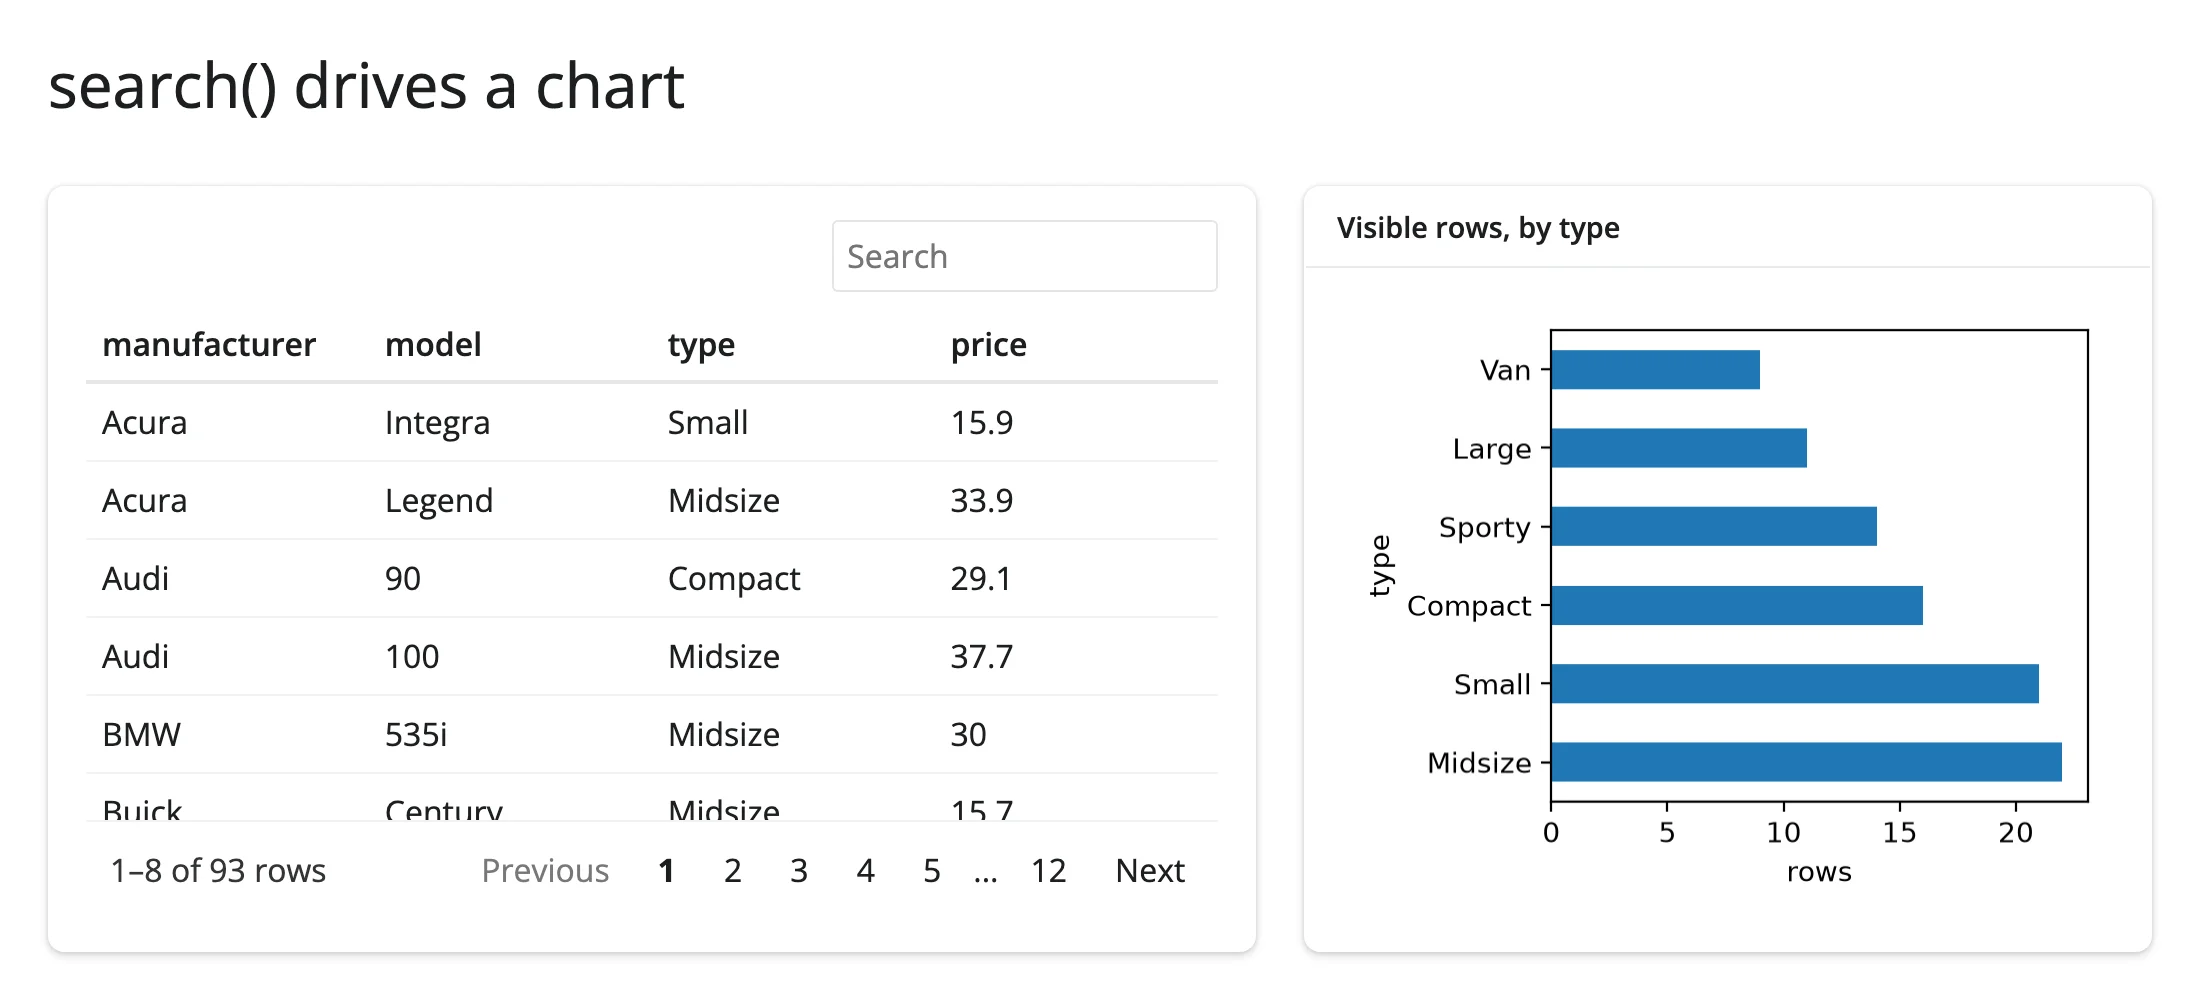
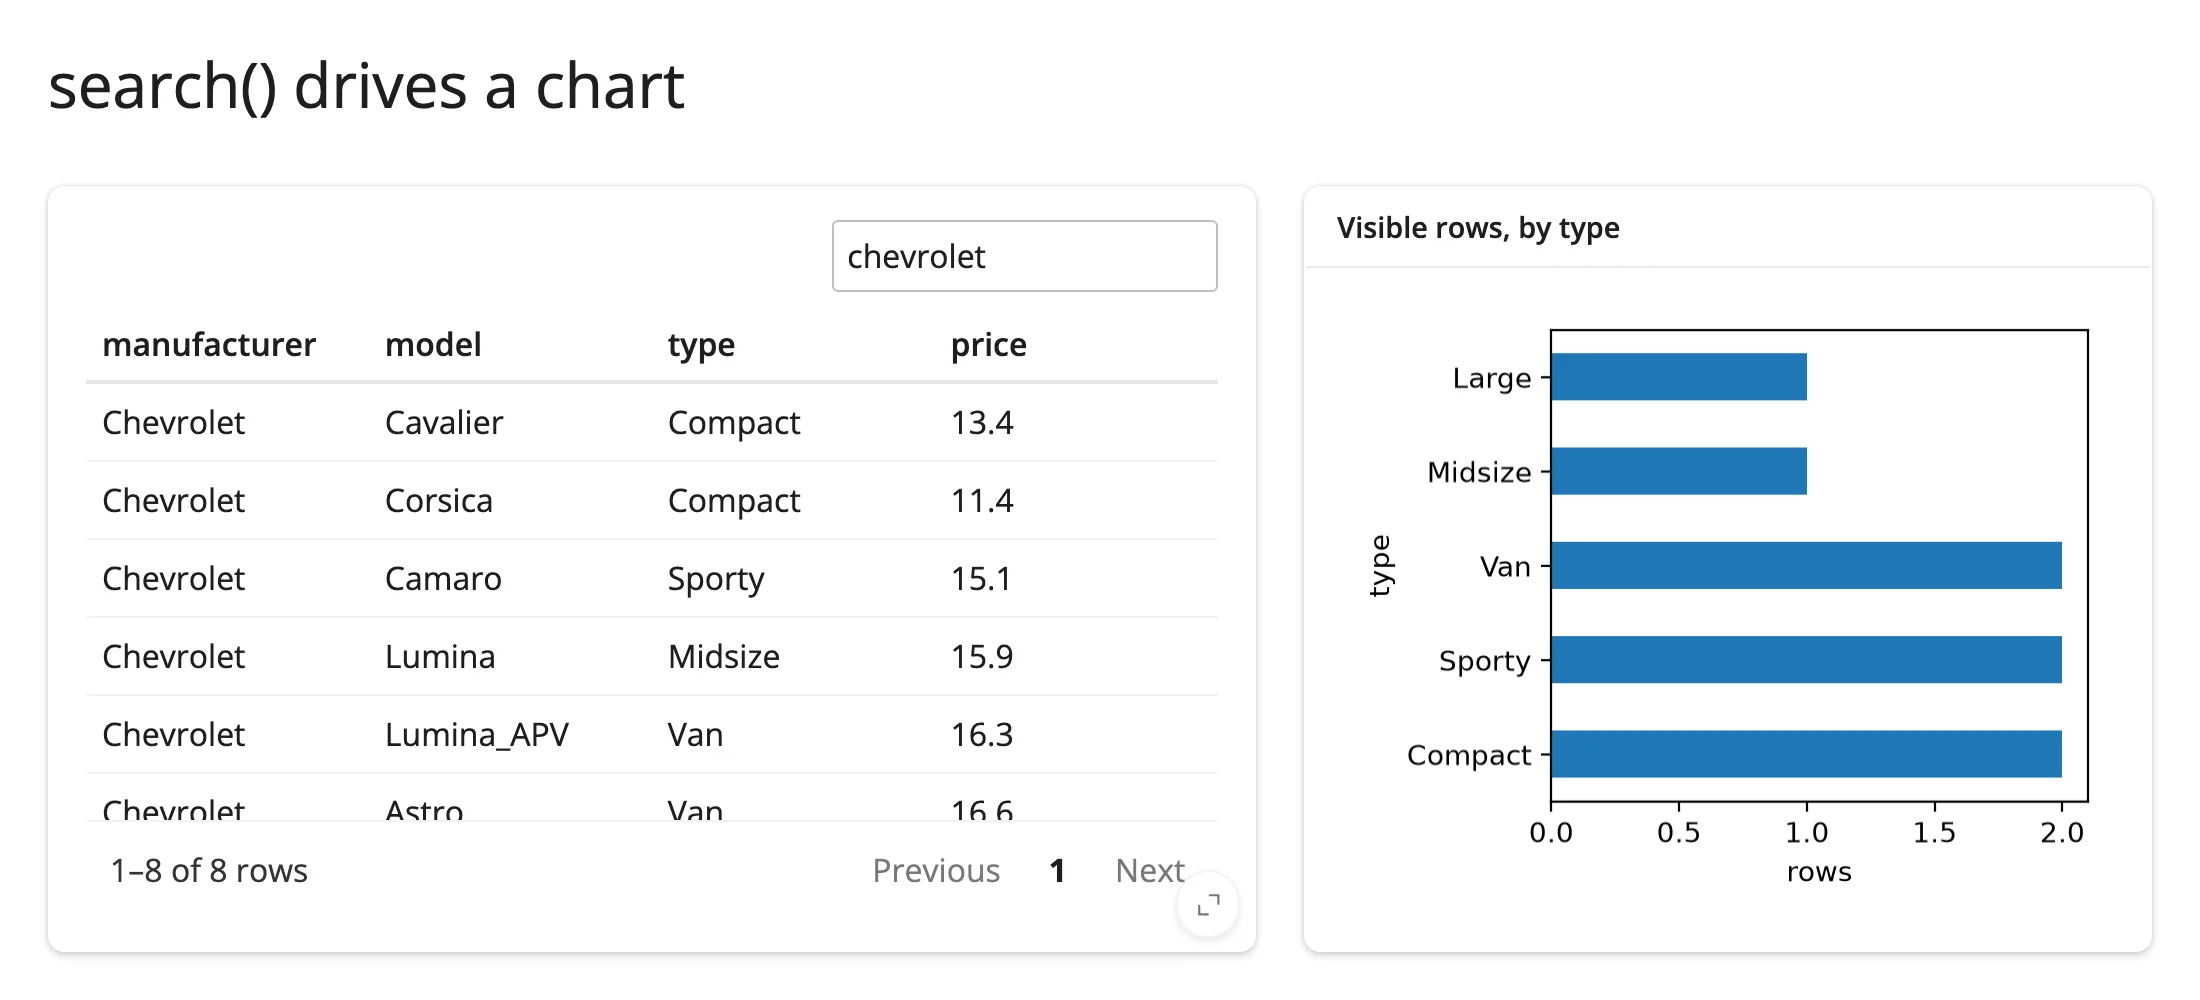
Search drives a chart of what’s visible
search() and filtered() report the query, not the result set, so showing “what’s visible” elsewhere means reproducing reactable’s matching (case-insensitive substring, across every column’s stringified value) in pandas. 15_search_to_chart.py:
import matplotlib.pyplot as plt
from reactable import Reactable
from reactable.data import cars_93
from shiny.express import render, ui
from shinywidgets import render_reactable

ui.page_opts(title="search() drives a chart", fillable=True)

cars = cars_93.to_pandas()[["manufacturer", "model", "type", "price"]]


def visible_rows():
    # search()/filtered() report the *query*, not the matching rows, so
    # showing "what's visible" elsewhere means reproducing reactable's
    # search (case-insensitive substring, any column) in pandas.
    query = tbl.search().lower()
    if not query:
        return cars
    hit = cars.astype(str).apply(lambda col: col.str.lower().str.contains(query))
    return cars[hit.any(axis=1)]


with ui.layout_columns(col_widths=[7, 5]):
    with ui.card(full_screen=True):

        @render_reactable
        def tbl():
            return Reactable(cars, searchable=True, default_page_size=8)

    with ui.card():
        ui.card_header("Visible rows, by type")

        @render.plot
        def chart():
            counts = visible_rows()["type"].value_counts()
            fig, ax = plt.subplots()
            counts.plot.barh(ax=ax)
            ax.set_xlabel("rows")
            return fig
Before searching, and after searching “chevrolet”:
Large data
reactable is client-side, like itables: the whole data frame is serialized to the browser up front, and pagination only limits what’s rendered in the DOM at once, not what’s sent over the wire. Unlike itables, reactable has no built-in downsampling (no maxBytes equivalent). No practical row limit was measured this pass. For tables beyond the low hundreds of thousands of rows, prefer ipydatagrid’s StreamingDataGrid (sends only the visible window) or a DuckDB-backed view (quak, mosaic) where only aggregates and the visible rows cross the wire. See Large data & performance for how those compare.
Layout and sizing
In a filling layout (ui.page_opts(fillable=True), ui.card(full_screen=True)), the table grows to fill its container and pagination stays pinned at the bottom. Setting reactable’s own height= prop (e.g. Reactable(df, height=250)) opts out of filling – it’s treated like an explicit ipywidgets Layout(height=...), matching how other shinywidgets renderers handle a widget-level height. There’s nothing else reactable-specific to configure: width/height/fill/fillable on @render_reactable behave like every other renderer in the package.
Gotchas and limitations
aggregate="mean"/"sum"/"median"silently produce blank cells with a pandas DataFrame (verified on current main, reactable 0.1.6). reactable-py’s pandas column-type detection (_tbl_data.py, thePdSeriesbranch ofcol_type()) always returns"UNKNOWN"instead of inspecting the dtype – unlike its polars branch, which correctly detects"numeric". The three gated aggregators (mean,sum,median) only run when a column’s type is"numeric"; the type-agnostic ones (count,max,min,unique,frequency) work regardless. A JS aggregate function (aggregate=JS("values => values.reduce((a,b)=>a+b,0)/values.length")) sidesteps it entirely, shown in What you can build above. Switching to a polars DataFrame also fixes it, since polars columns are typed correctly.- A details column needs
html=Trueof its own.Reactable(df, details=my_fn)(a bare function) renders the returned markup as escaped literal text, not HTML. Wrap it:details=Column(details=my_fn, html=True). default_sorted={"col": "desc"}ignores the direction (long-standing upstream limitation, unrelated to shinywidgets): the dict form ofdefault_sortedalways sorts ascending. Usedefault_sorted=["col"]together with the table-widedefault_sort_order="desc"instead.reactable.dataSimpleFrameobjects don’t support boolean-mask indexing (df[mask, :]silently returns all rows; long-standing upstream quirk). Convert to pandas or polars first (cars_93.to_pandas()), or use positional indices.- A module-level docstring in a Shiny Express app renders as visible page text (not reactable-specific – this is general Express behavior, documented here because it’s easy to hit while adapting these examples: Express treats every top-level bare expression, including a plain string, as something to display). Use
#comments for a file’s metadata header instead. - Row clicks aren’t reported state. No accessor sees a plain click; use the
on_click=JS(...)+Shiny.setInputValue()pattern shown above.
Gallery candidates
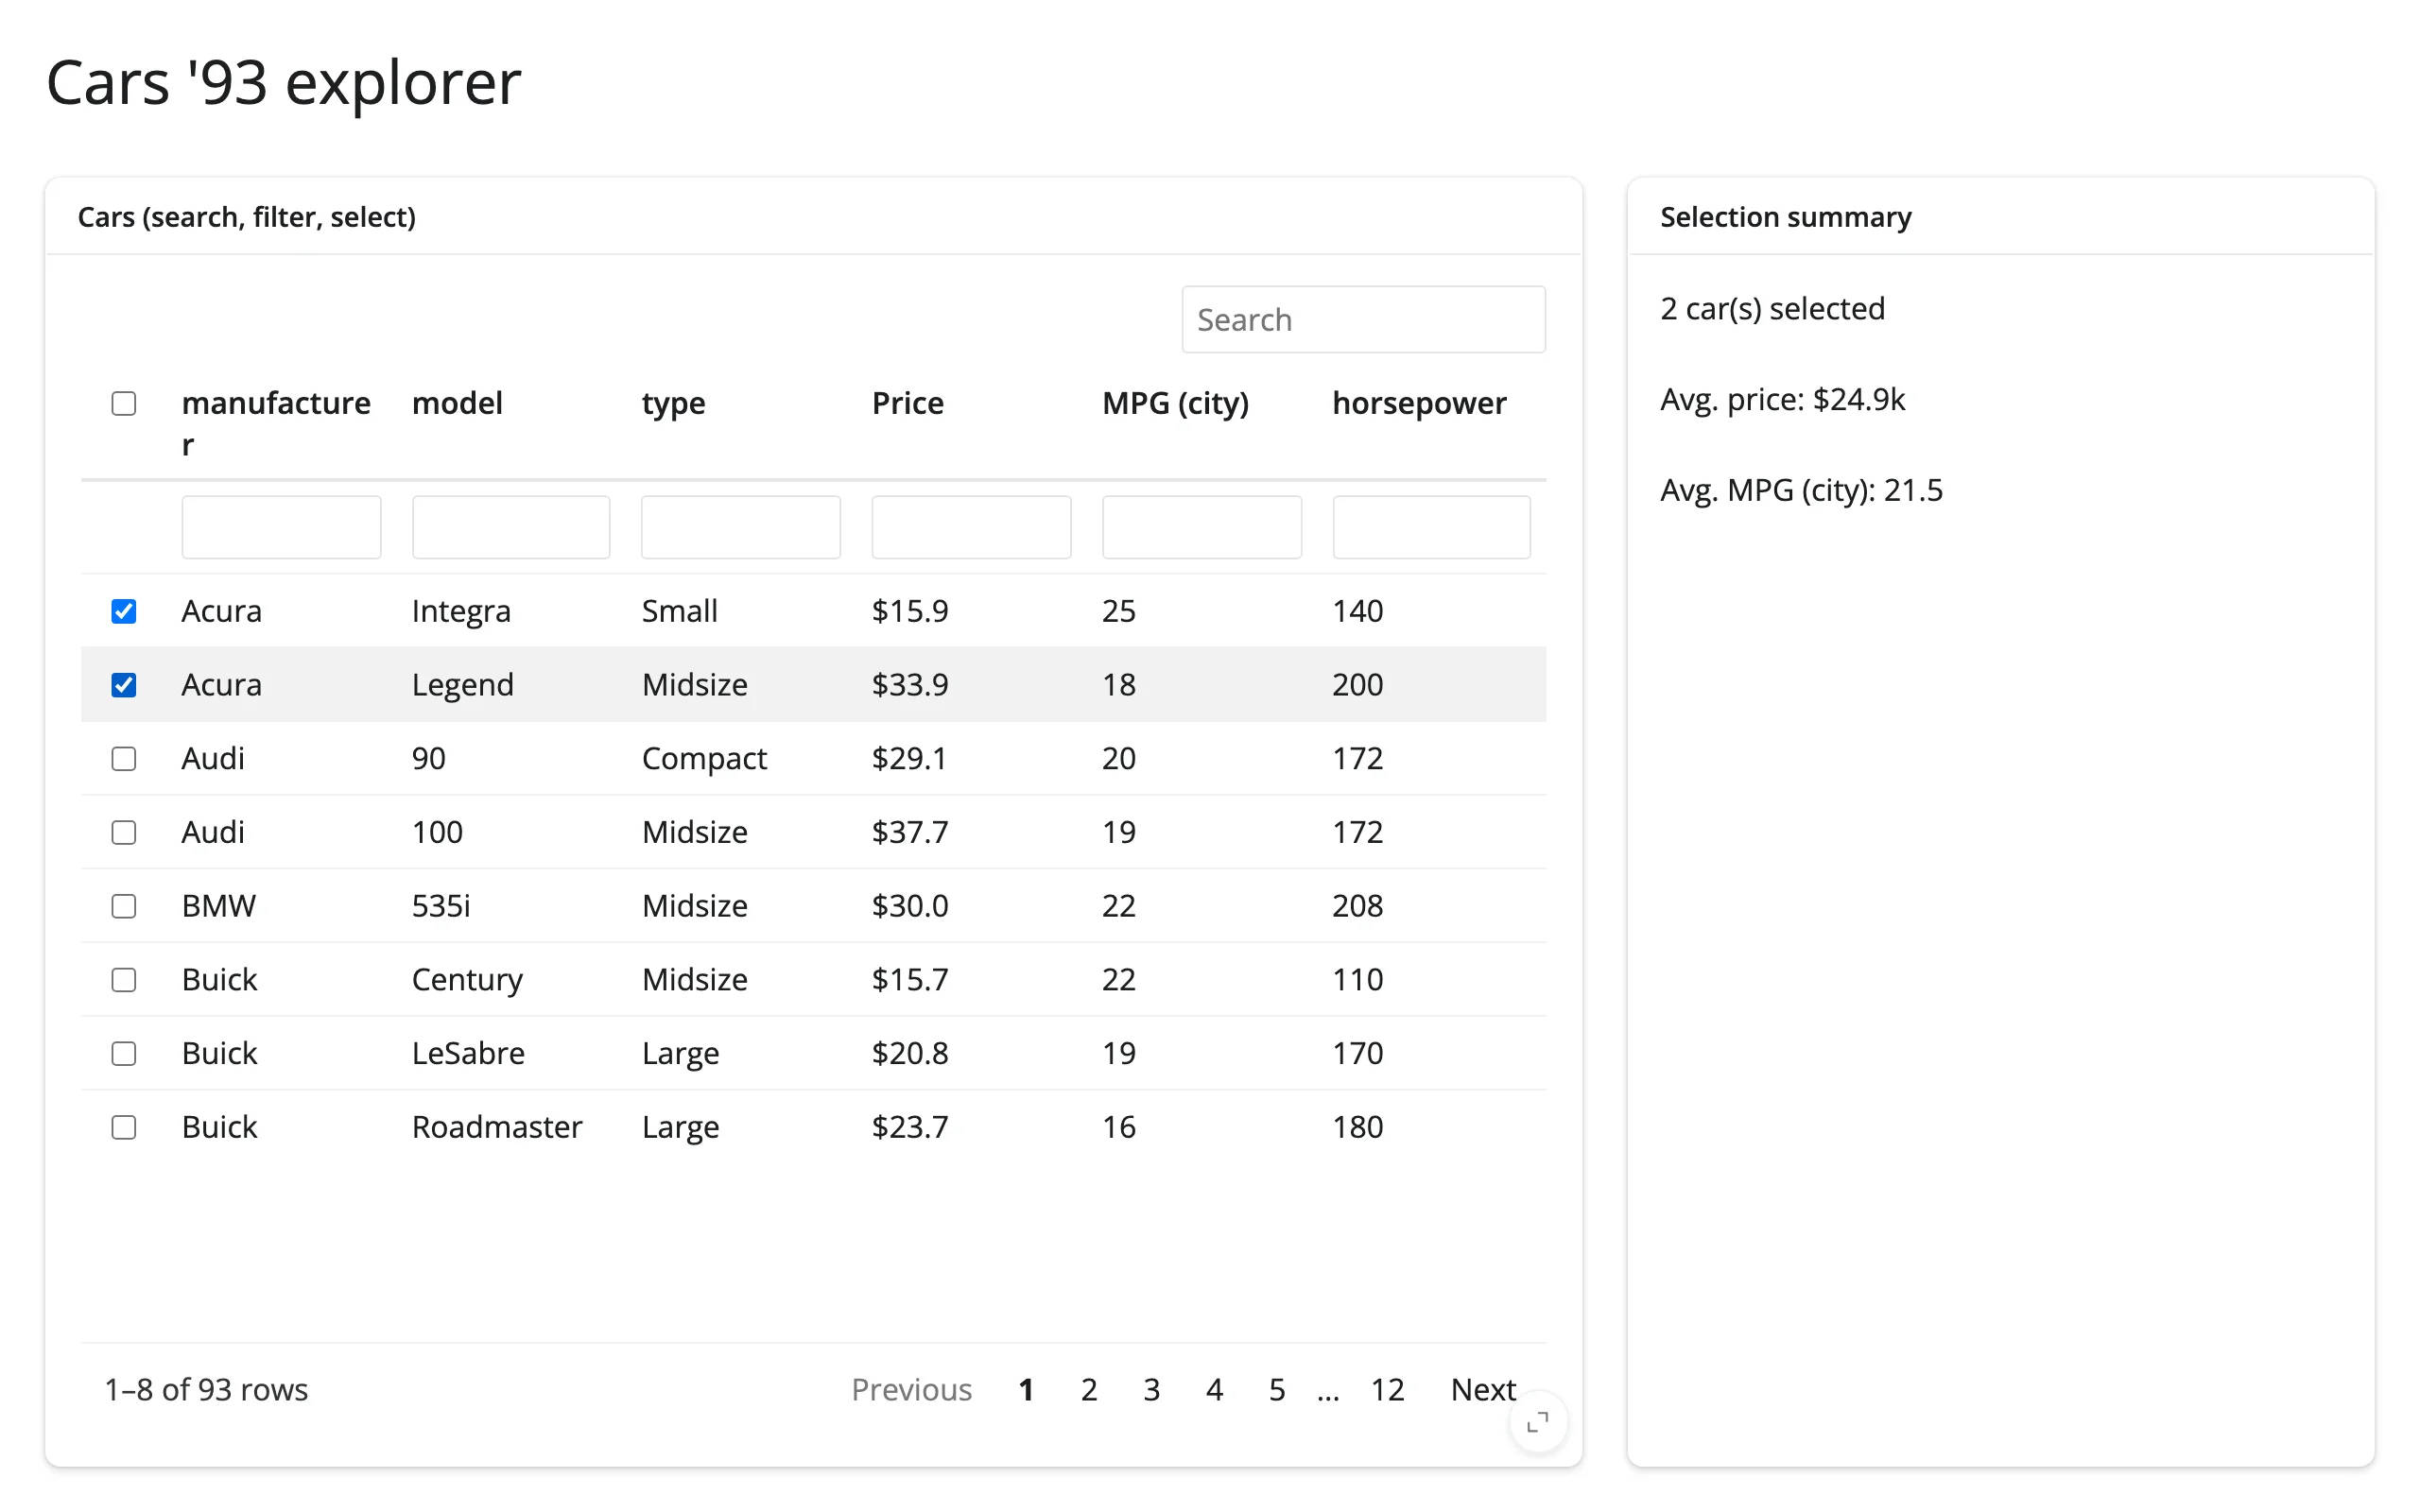
Filterable table with a selection summary (template)
A searchable, filterable table whose selection drives a small summary card – a clean ~60-line starting point for “pick some rows, see a number” dashboards. gallery/template_filterable_table.py
Cars ’93 dashboard (showcase)
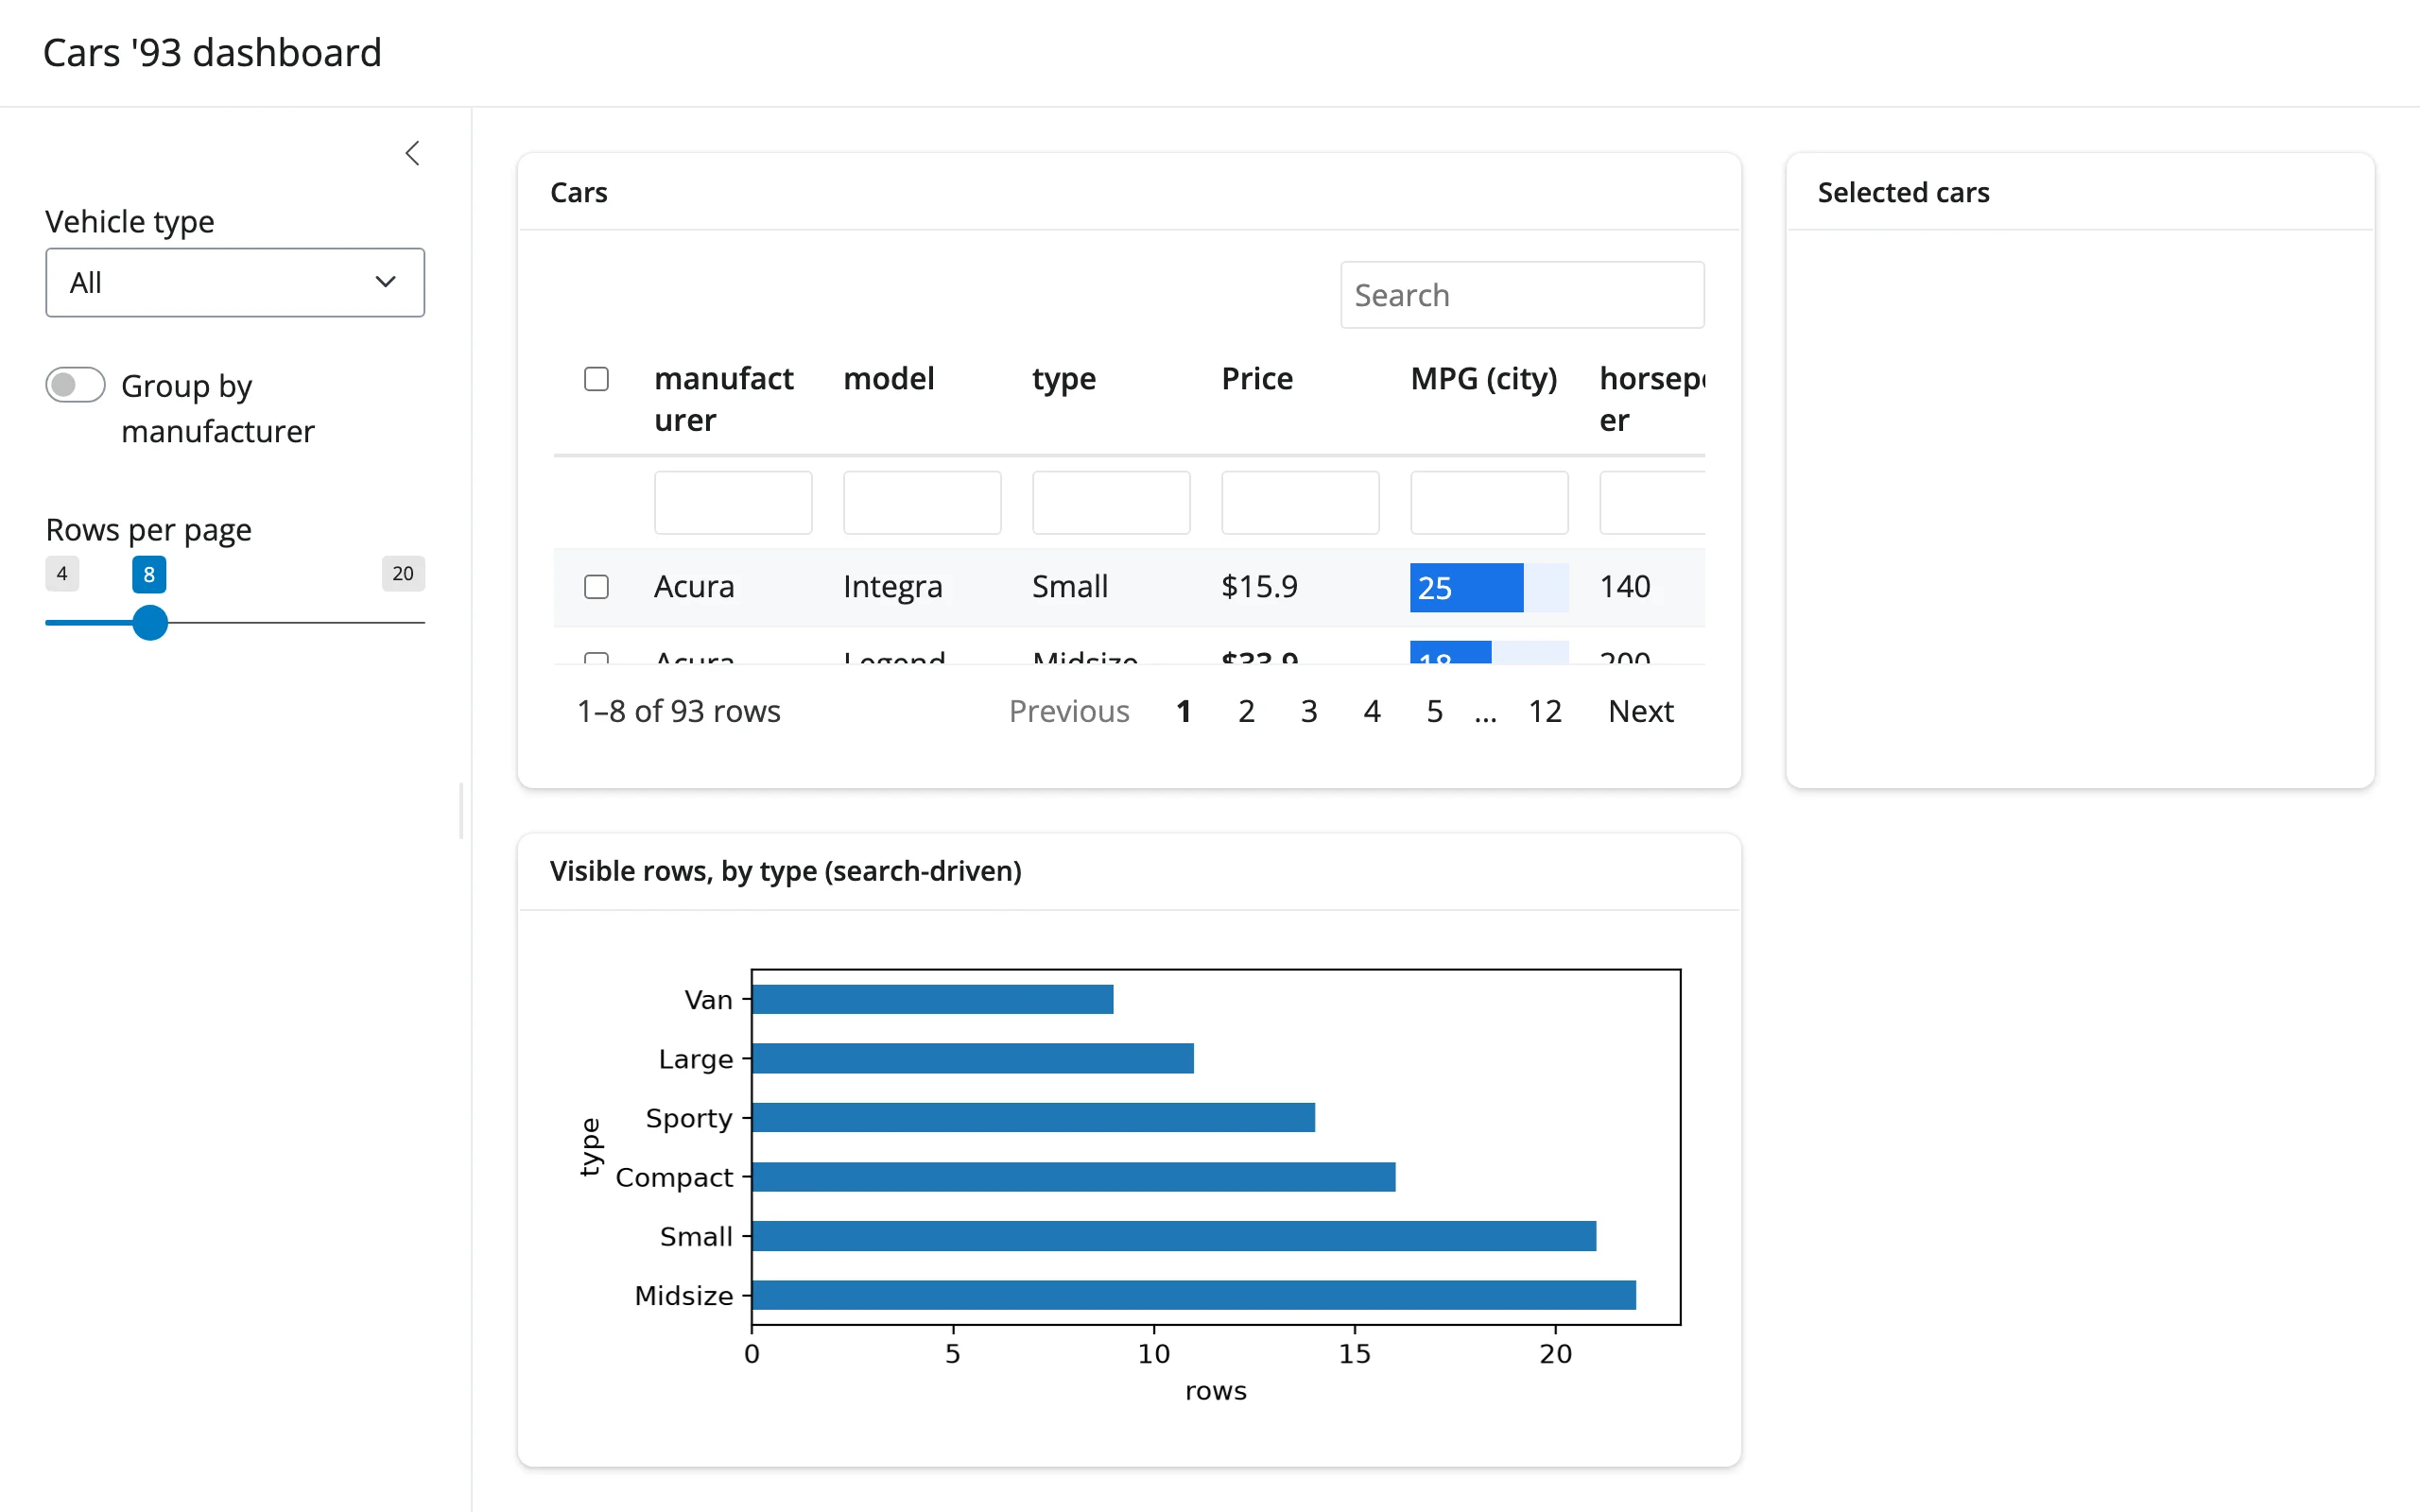
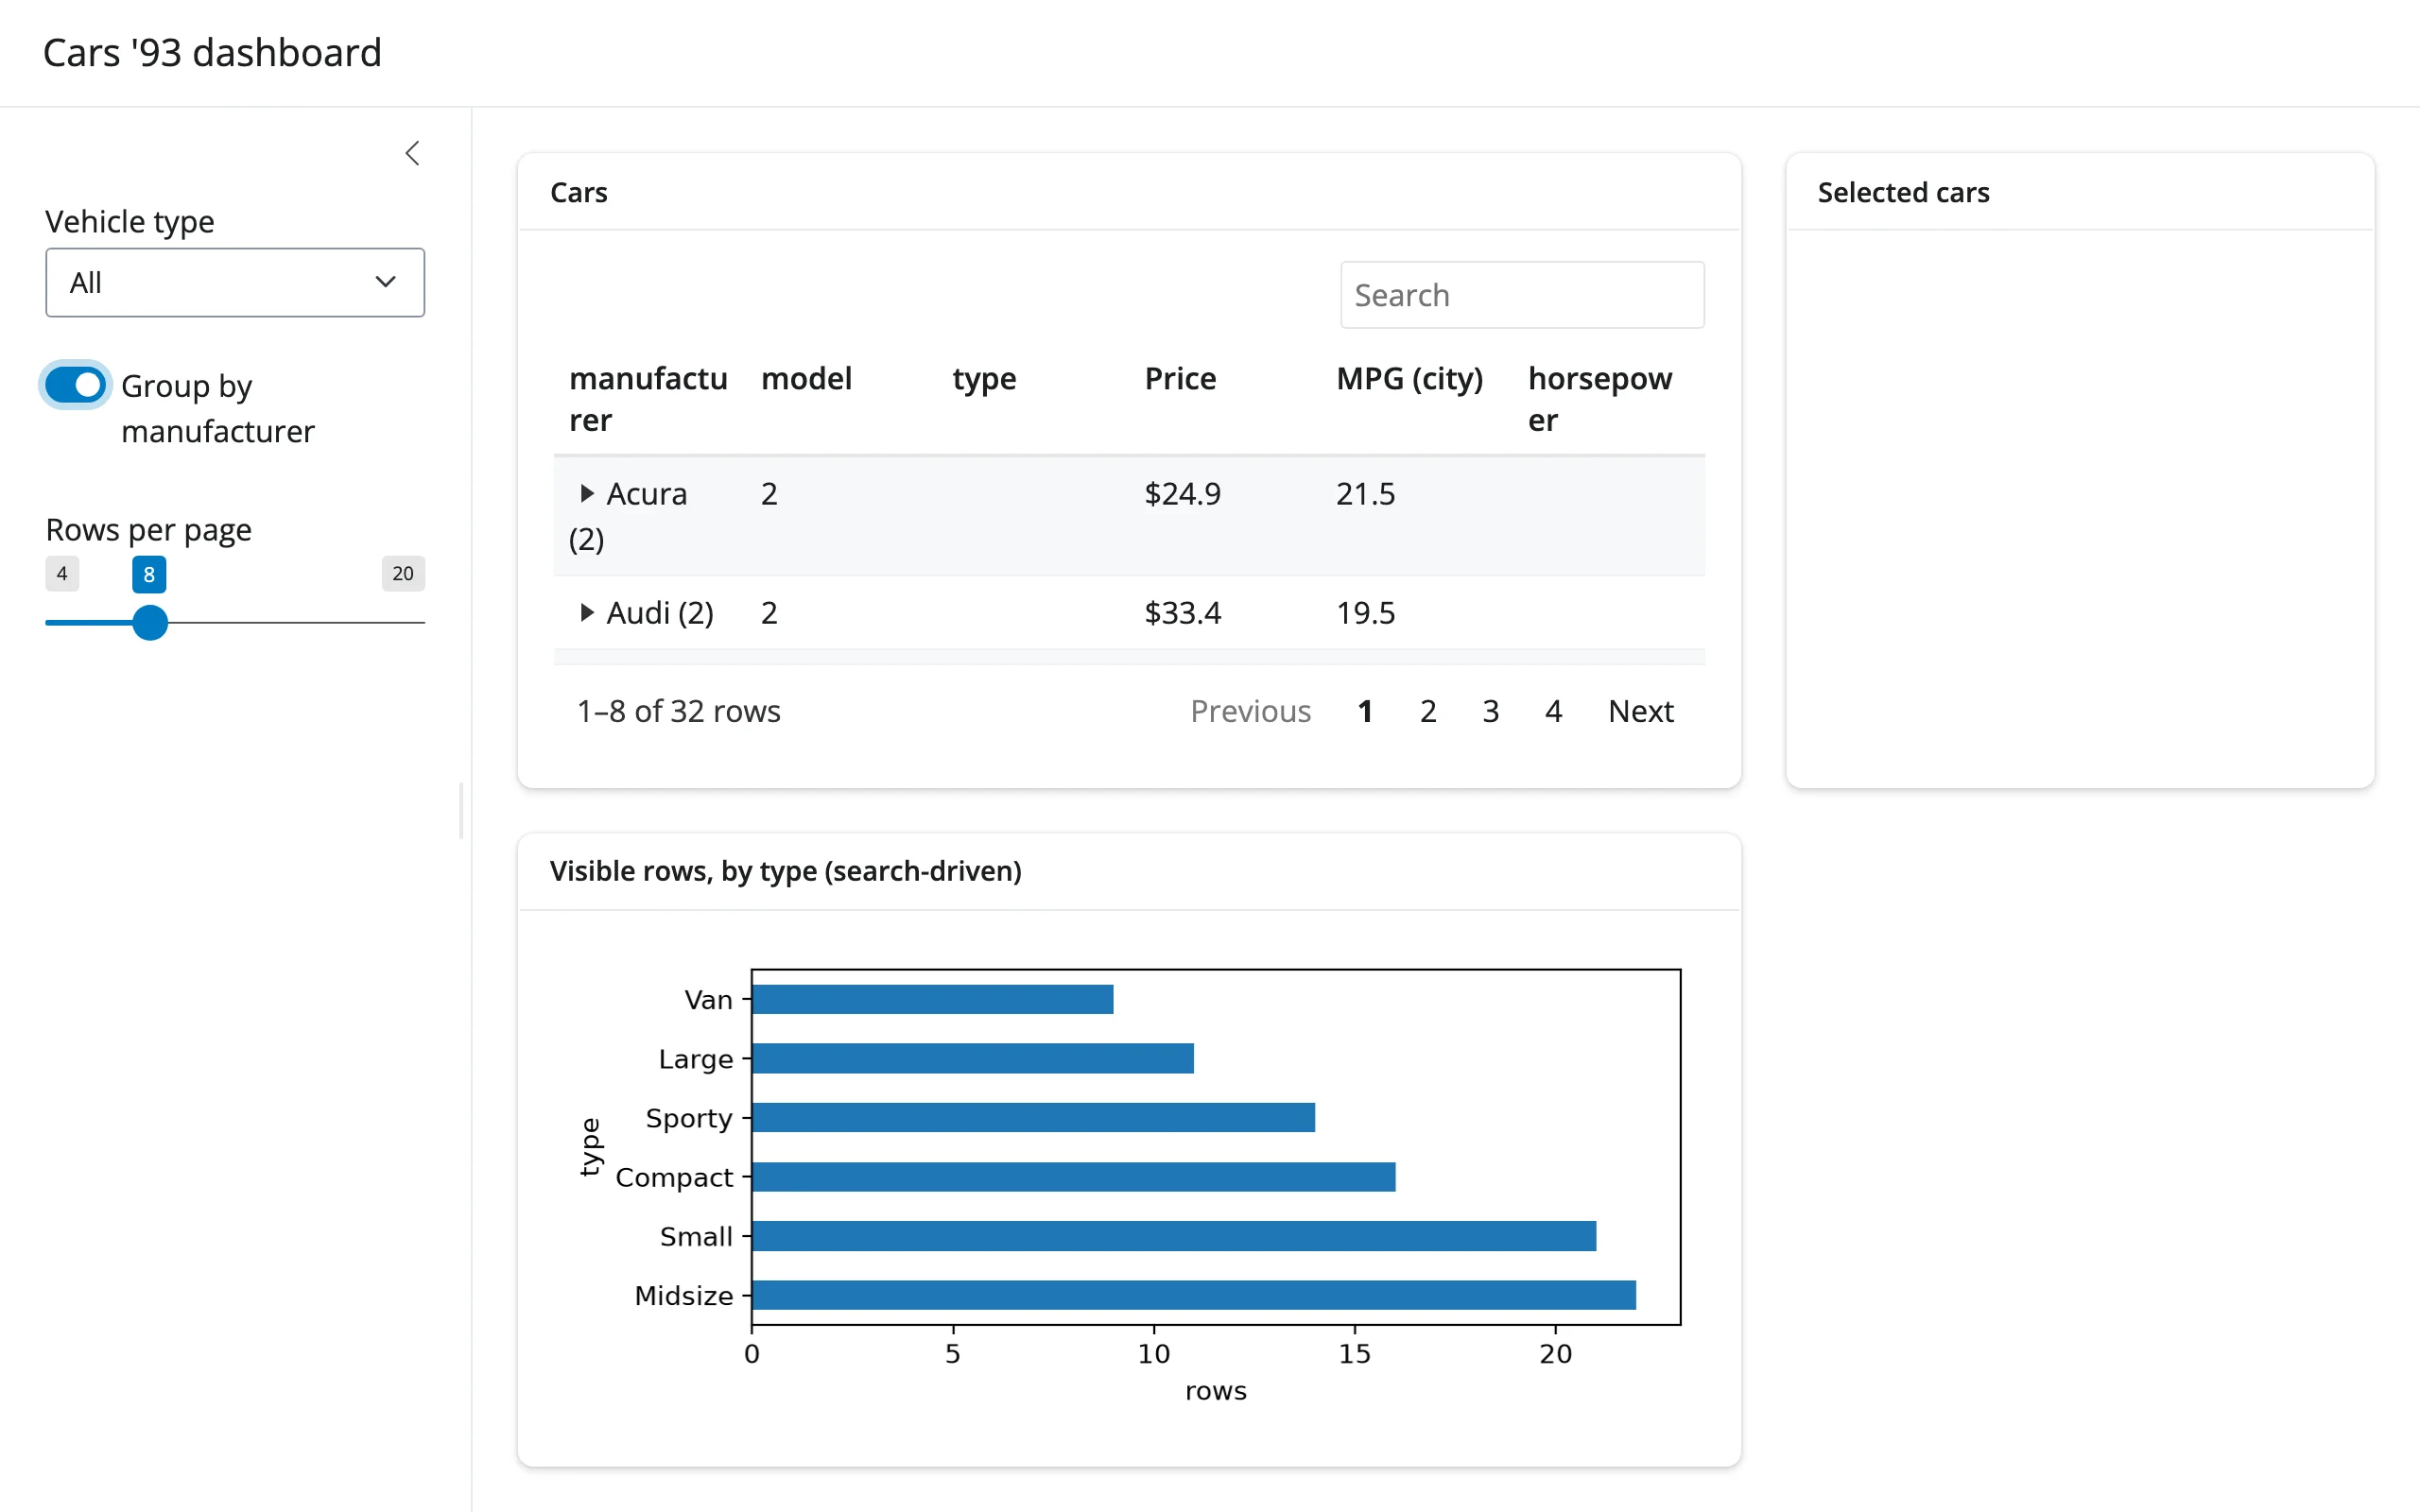
A fuller dashboard: a vehicle-type filter and a grouping toggle re-render the table; page size updates in place; row selection drives a comparison card; the search box drives a chart of what’s currently visible. Exercises selected_rows(), search(), an in-place prop update, grouping/aggregation (with the mean workaround above), a JS cell renderer, and theming together. gallery/showcase_cars_dashboard.py
Learn more
- reactable-py documentation
- R reactable documentation (the state API shinywidgets bridges from; most R reactable recipes for formatting, themes, and custom renderers translate directly)
- Related guides in this roster: itables (zero-config DataTables.net tables), ipydatagrid (canvas grid, cell-block selection, in-cell bars/heatmaps, editing), perspective (aggregation-first exploration of very large tables)