pydeck
pydeck is the Python binding for deck.gl, the WebGL layer catalog behind many striking data maps (hexagon bins, arcs, heatmaps, 3D columns). For years, pydeck.Deck was a Jupyter widget you could render live, and shinywidgets shipped @render_pydeck to bring that into Shiny.
That stopped working with pydeck 0.9 (2024): pydeck dropped its Jupyter widget entirely. Deck.show() now returns static HTML instead of a widget, and Deck.update() raises. No ipywidgets bridge – shinywidgets included – can render a live pydeck.Deck on pydeck >= 0.9, so render_pydeck is deprecated and raises an explanatory error instead of a blank map.
The good news: pydeck’s actual value – the declarative pydeck.Layer API over deck.gl’s layer catalog – still works great in Shiny. This guide is a migration guide, not a feature tour: it shows the error you’ll hit, then the two supported ways to bring your existing pdk.Layer objects into a reactive Shiny app (a maplibre map, or lonboard for very large data), plus a static fallback for one-off maps. For the full feature set of either destination renderer, see their own guides; this page only covers the pydeck-specific migration path.
Why it’s deprecated, and what you’ll see
pydeck’s has_jupyter_extra() / DeckGLWidget machinery still exists in pydeck >= 0.9, but nothing ever populates it – it’s a leftover from the ipywidgets-7 era. Calling @render_pydeck and returning a pydeck.Deck raises a TypeError up front, rather than rendering a blank or broken map.
examples/01_deprecation_error.py is what porting a notebook cell straight into Shiny looks like – and what happens when you run it:
import pydeck as pdk
from shiny.express import ui
from shinywidgets import render_pydeck

ui.page_opts(fillable=True)

BIKE_RACKS = "https://raw.githubusercontent.com/visgl/deck.gl-data/master/website/sf-bike-parking.json"


with ui.card(full_screen=True):

    @render_pydeck
    def bike_racks():
        layer = pdk.Layer(
            "ScatterplotLayer",
            BIKE_RACKS,
            get_position="COORDINATES",
            get_radius="SPACES",
            get_fill_color=[255, 140, 0],
            pickable=True,
            radius_scale=6,
        )
        view_state = pdk.ViewState(
            latitude=37.7749, longitude=-122.4194, zoom=11
        )
        return pdk.Deck(layers=[layer], initial_view_state=view_state)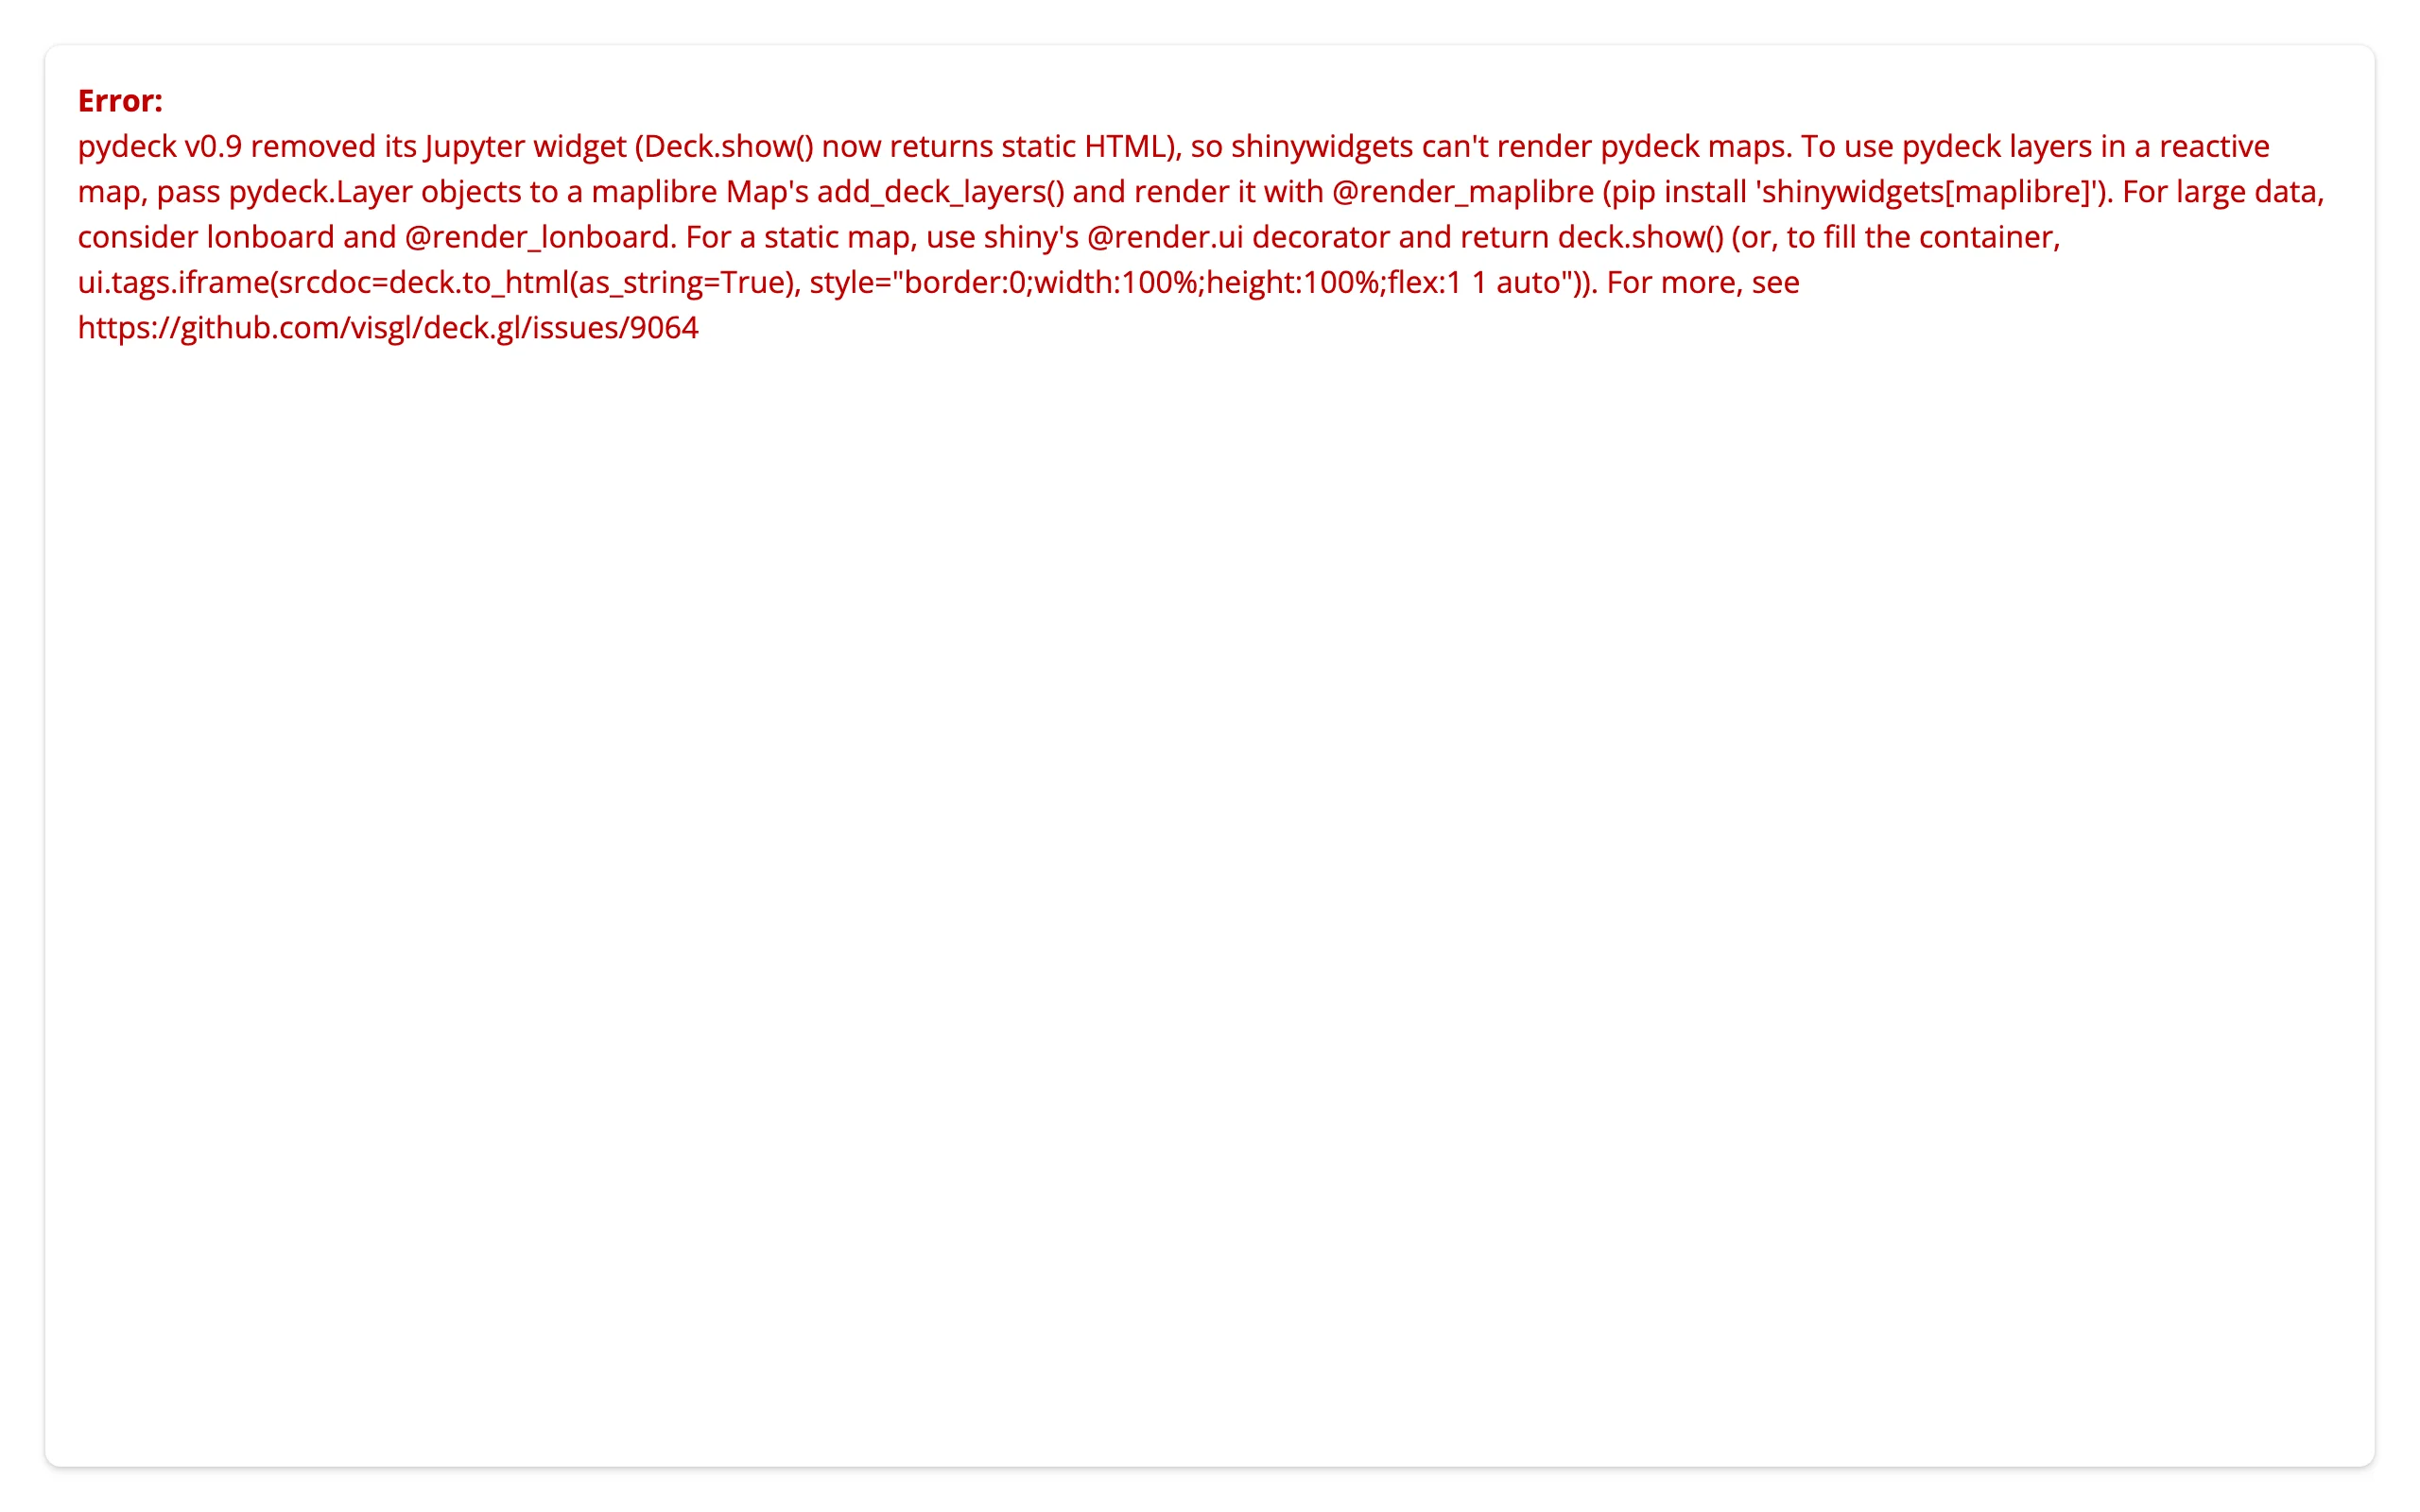
The card shows the error inline because Shiny’s dev-mode default is sanitize_errors=False – the app shows the real exception, not just a generic message. The full text (also always in the server log):
pydeck v0.9 removed its Jupyter widget (
Deck.show()now returns static HTML), so shinywidgets can’t render pydeck maps. To use pydeck layers in a reactive map, passpydeck.Layerobjects to a maplibreMap’sadd_deck_layers()and render it with@render_maplibre(pip install 'shinywidgets[maplibre]'). For large data, consider lonboard and@render_lonboard. For a static map, use shiny’s@render.uidecorator and returndeck.show()(…). For more, see https://github.com/visgl/deck.gl/issues/9064
One thing to know if you instrument your own app: render_pydeck(...) also issues a FutureWarning at decoration time – when the @render_pydeck line itself runs, not when the output renders. Verified in a real shiny run: it prints to the server log by default, pointing at the exact @render_pydeck line (stacklevel=2), with no flags needed:
app.py:12: FutureWarning: render_pydeck is deprecated: pydeck v0.9 removed its Jupyter widget, so it
can't render maps. Pass pydeck.Layer objects to a maplibre Map's add_deck_layers() and use
@render_maplibre instead (see help(shinywidgets.render_pydeck) for other alternatives).
  @render_pydeck
It’s a FutureWarning, not a DeprecationWarning, specifically so this shows up: Python’s default warning filters hide DeprecationWarning outside the __main__ module, and a Shiny app’s module is never __main__. The TypeError above still fires when the output actually renders a pydeck.Deck; the warning is the earlier, decoration-time signal, and current main makes sure you’ll actually see both.
Migration path A: maplibre (recommended default)
pydeck.Layer objects pass straight to a maplibre Map’s add_deck_layers() / set_deck_layers() – no layer rewriting needed, because maplibre’s Python package embeds the same deck.gl layer catalog under the hood. This is the supported replacement for render_pydeck, and it’s strictly more capable: you get an in-place restyle that keeps the camera, and .read() access to the map’s viewport and clicks, neither of which pydeck’s own widget ever had.
pip install 'shinywidgets[maplibre]' pydeckBefore / after
The same ScatterplotLayer over pydeck’s own “San Francisco bike parking” tutorial dataset (2,520 bike racks, radius sized by SPACES), moved from a classic pydeck Deck to a maplibre Map:
| Before: classic pydeck (no longer renders) | After: maplibre + pdk.Layer |
|---|---|
pdk.Deck(layers=[layer], initial_view_state=pdk.ViewState(latitude=37.7749, longitude=-122.4194, zoom=12)) |
Map(MapOptions(center=(-122.4194, 37.7749), zoom=12)) then m.add_deck_layers([layer]) |
deck.update() after changing a layer property |
map.widget.set_deck_layers([layer]) from a @reactive.effect |
| no events back to Python | map.read("view_state"), map.read("clicked") |
The example renders the overlay empty, then fills and restyles it from an effect so the slider’s radius change restyles in place – the 2,520-row dataset isn’t resent on every drag, only the layer’s style properties are, and the camera never moves on its own (examples/02_migrate_restyle.py):
import pydeck as pdk
import requests
from maplibre import Map, MapOptions
from maplibre.basemaps import Carto
from shiny import reactive
from shiny.express import input, ui
from shinywidgets import render_maplibre

BIKE_RACKS = requests.get(
    "https://raw.githubusercontent.com/visgl/deck.gl-data/master/website/sf-bike-parking.json"
).json()
TOOLTIP = {"bike-racks": "{{ADDRESS}}: {{SPACES}} spaces"}

ui.page_opts(fillable=True)
ui.input_slider("radius_scale", "Radius scale", 1, 20, 6)

with ui.card(full_screen=True):

    @render_maplibre
    def bike_racks():
        m = Map(MapOptions(style=Carto.POSITRON, center=(-122.4194, 37.7749), zoom=12))
        # An empty overlay: the effect below fills it, so the data crosses the
        # wire once (calls made before the map renders are queued), not twice.
        m.add_deck_layers([], tooltip=TOOLTIP)
        return m


@reactive.effect
def _restyle():
    # set_deck_layers() restyles in place: the camera stays put, and (unlike a
    # pydeck Deck.update(), which raises on pydeck >= 0.9) this actually works.
    bike_racks.widget.set_deck_layers([scatter_layer()], tooltip=TOOLTIP)


def scatter_layer() -> pdk.Layer:
    return pdk.Layer(
        "ScatterplotLayer",
        BIKE_RACKS,
        id="bike-racks",
        get_position="COORDINATES",
        get_radius="SPACES",
        get_fill_color=[255, 140, 0],
        pickable=True,
        opacity=0.8,
        stroked=True,
        filled=True,
        radius_scale=input.radius_scale(),
        radius_min_pixels=1,
        radius_max_pixels=100,
        line_width_min_pixels=1,
    )
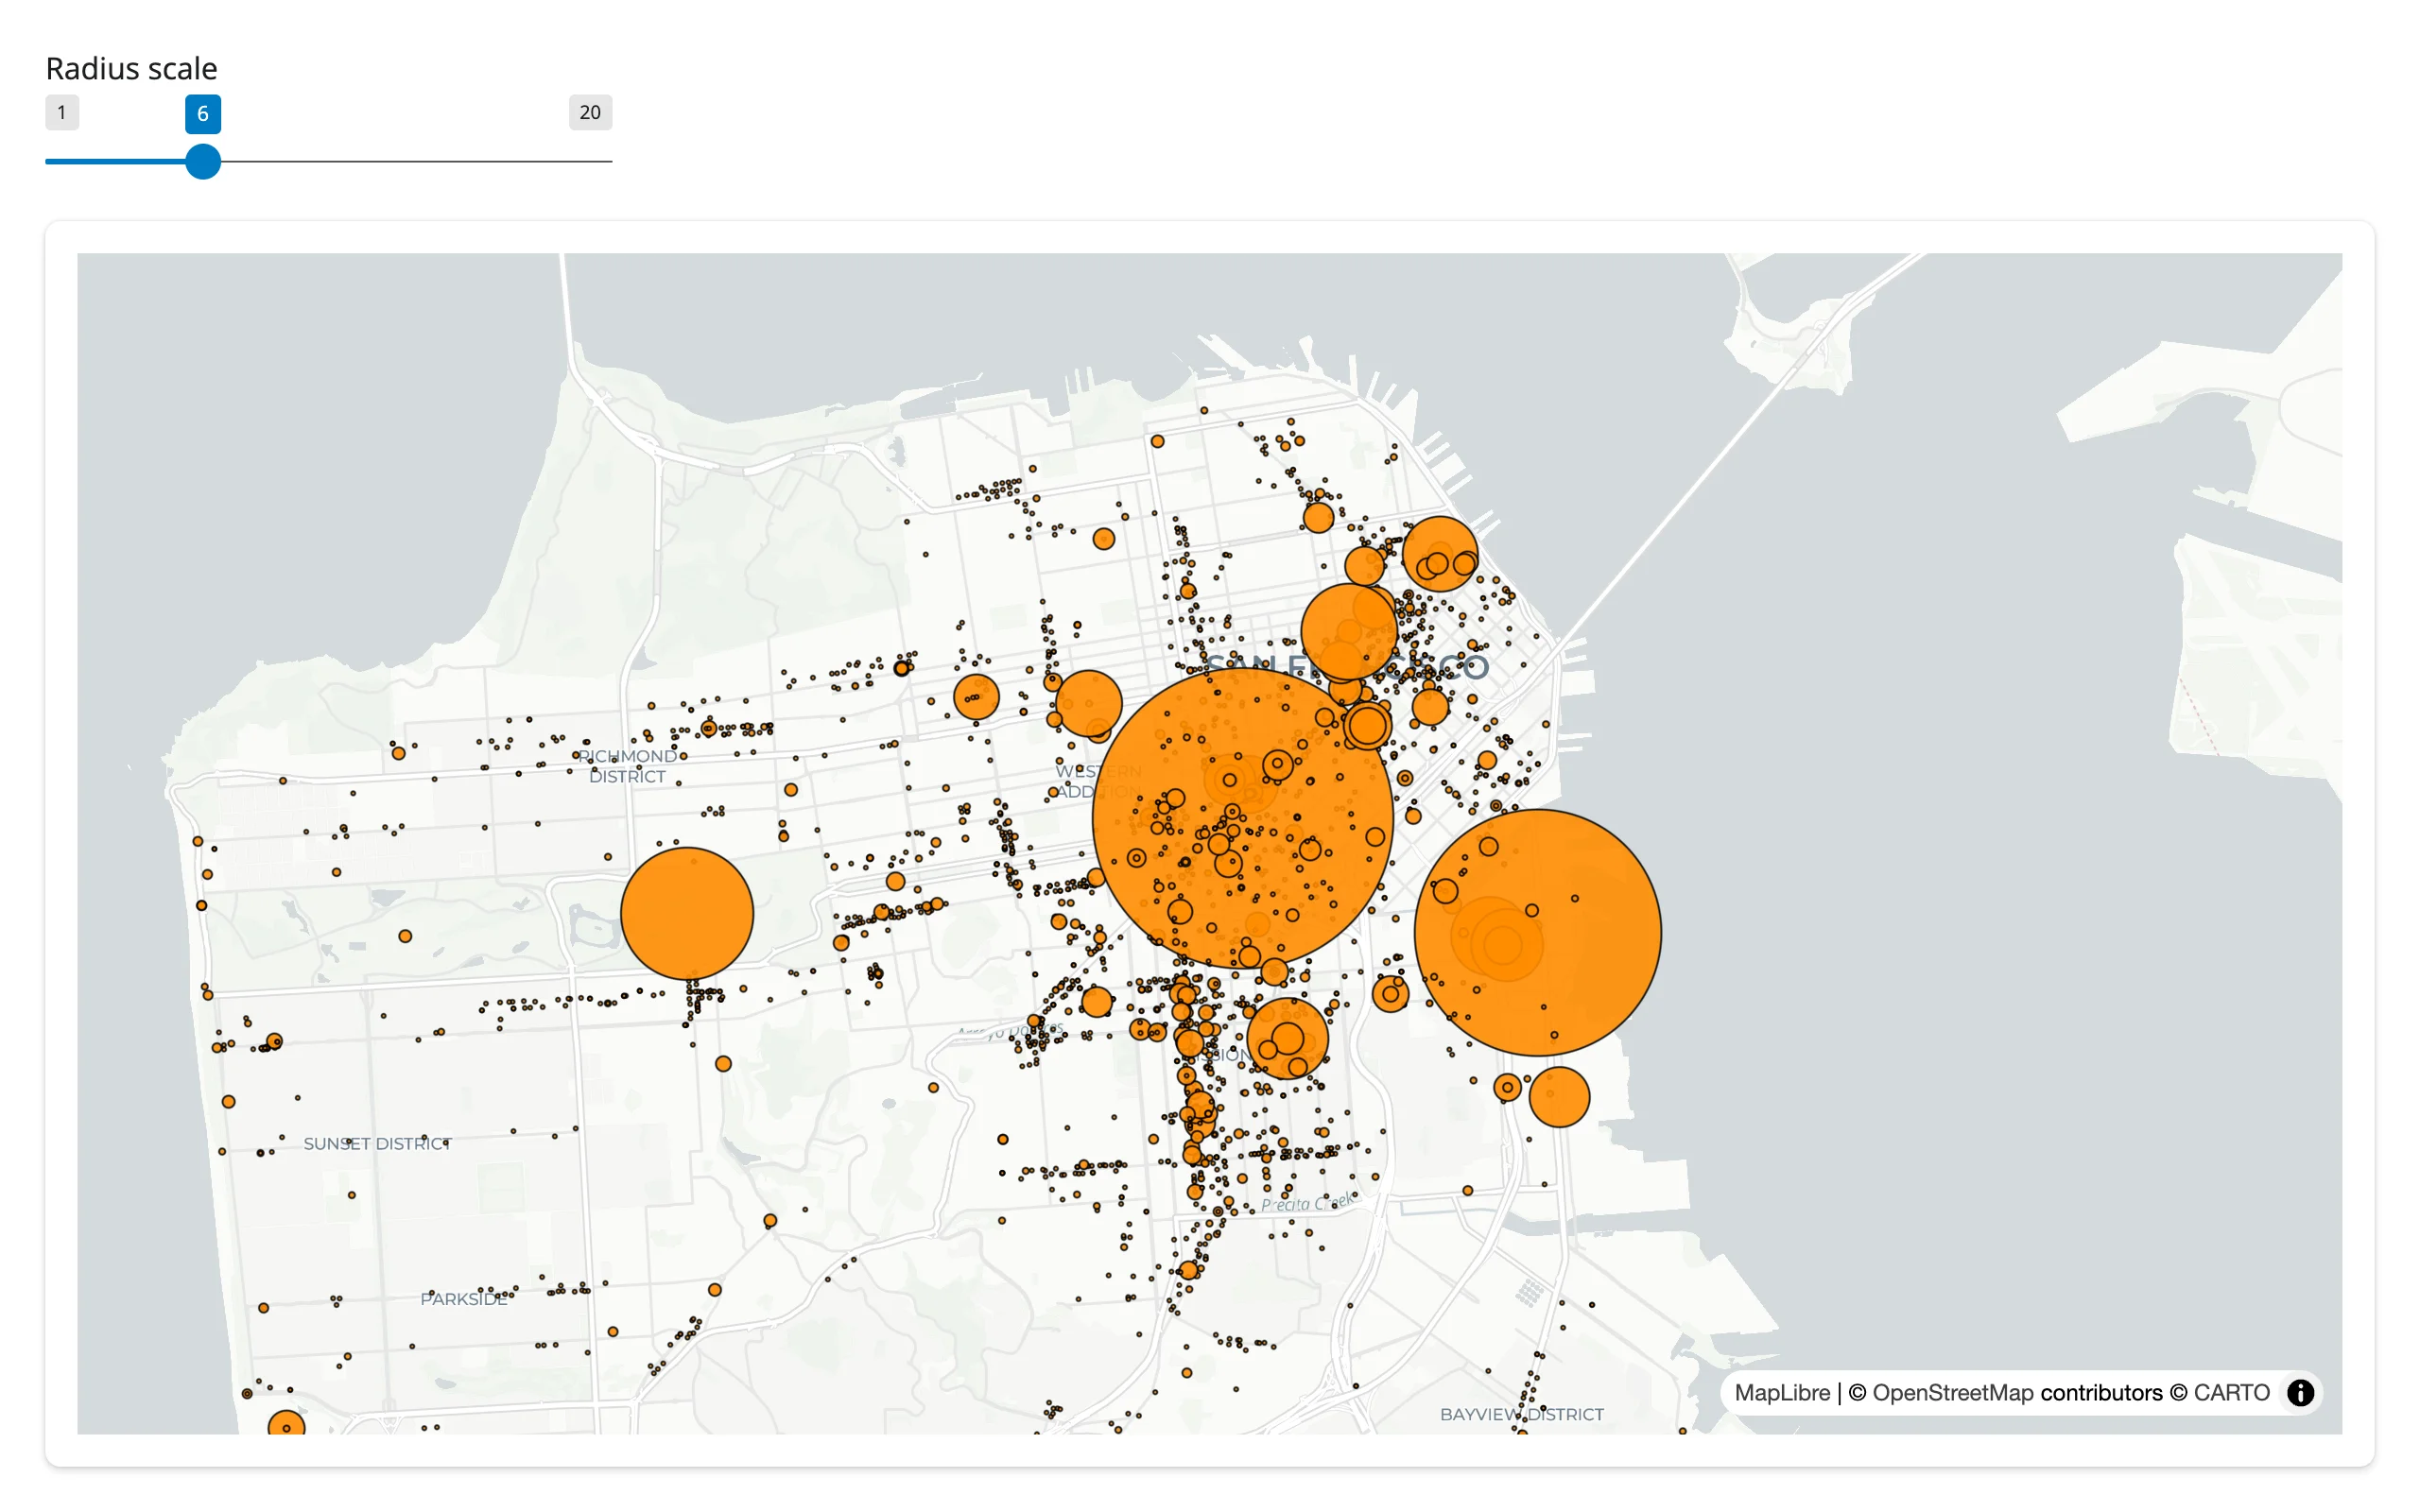
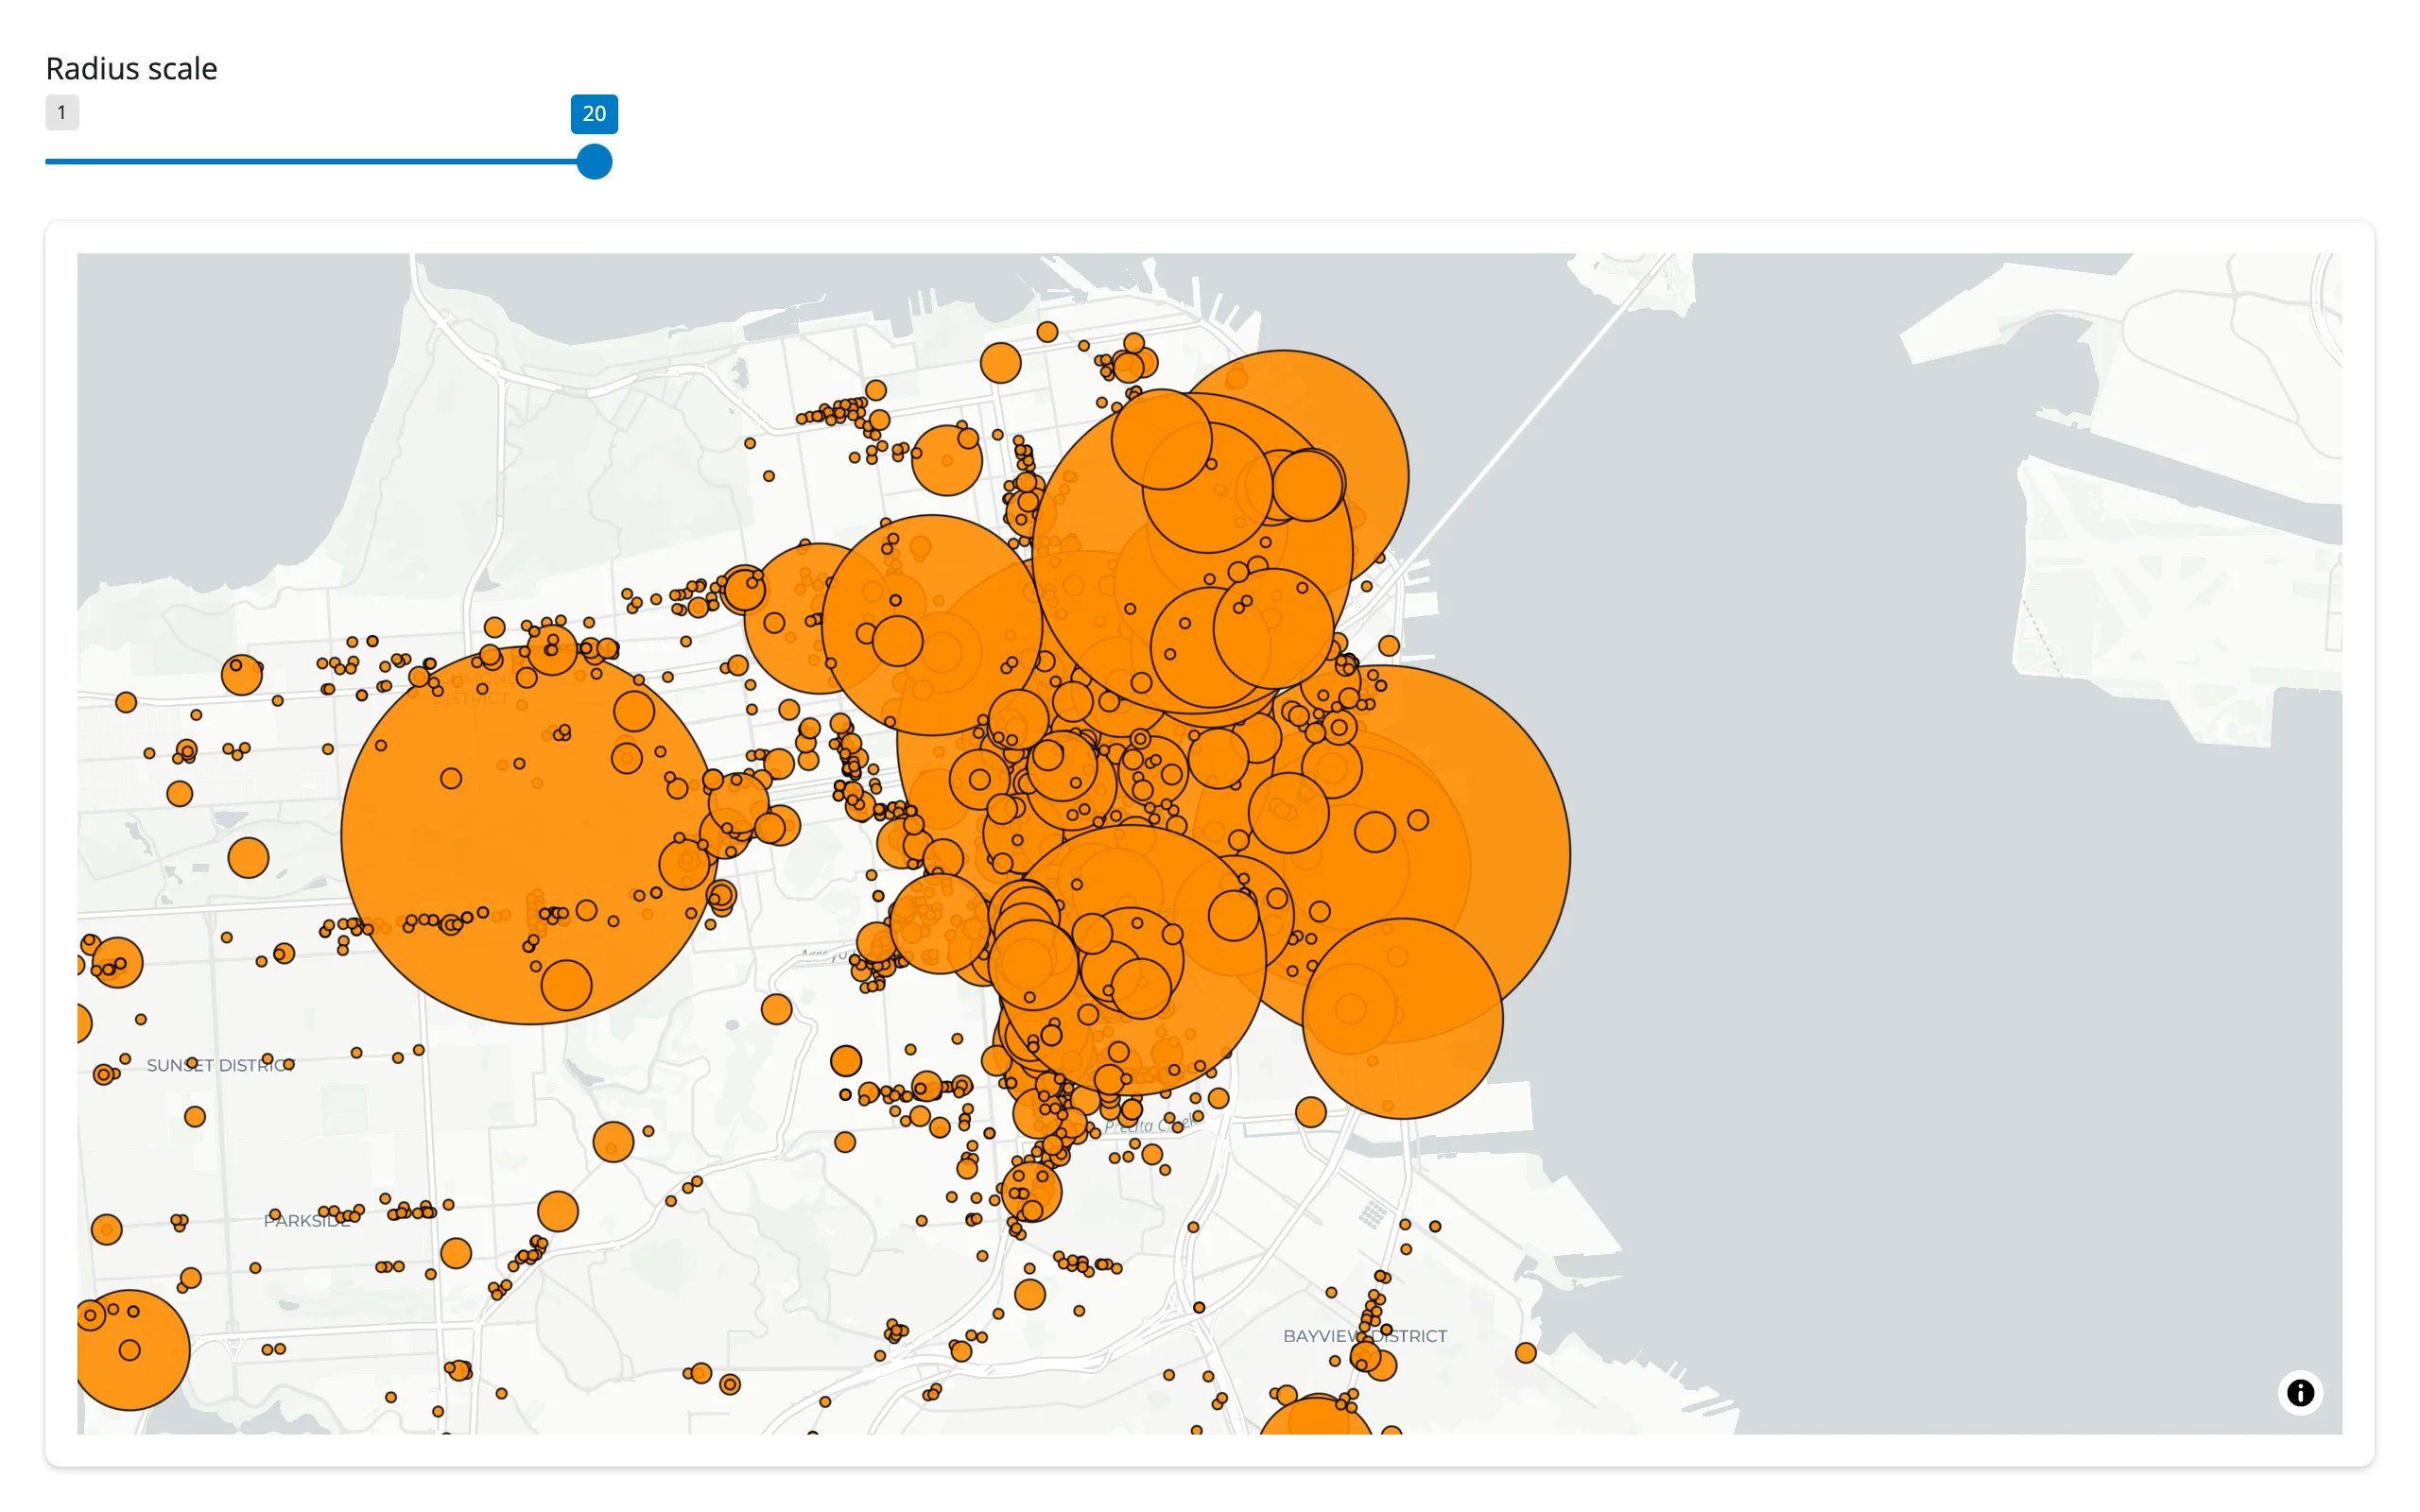
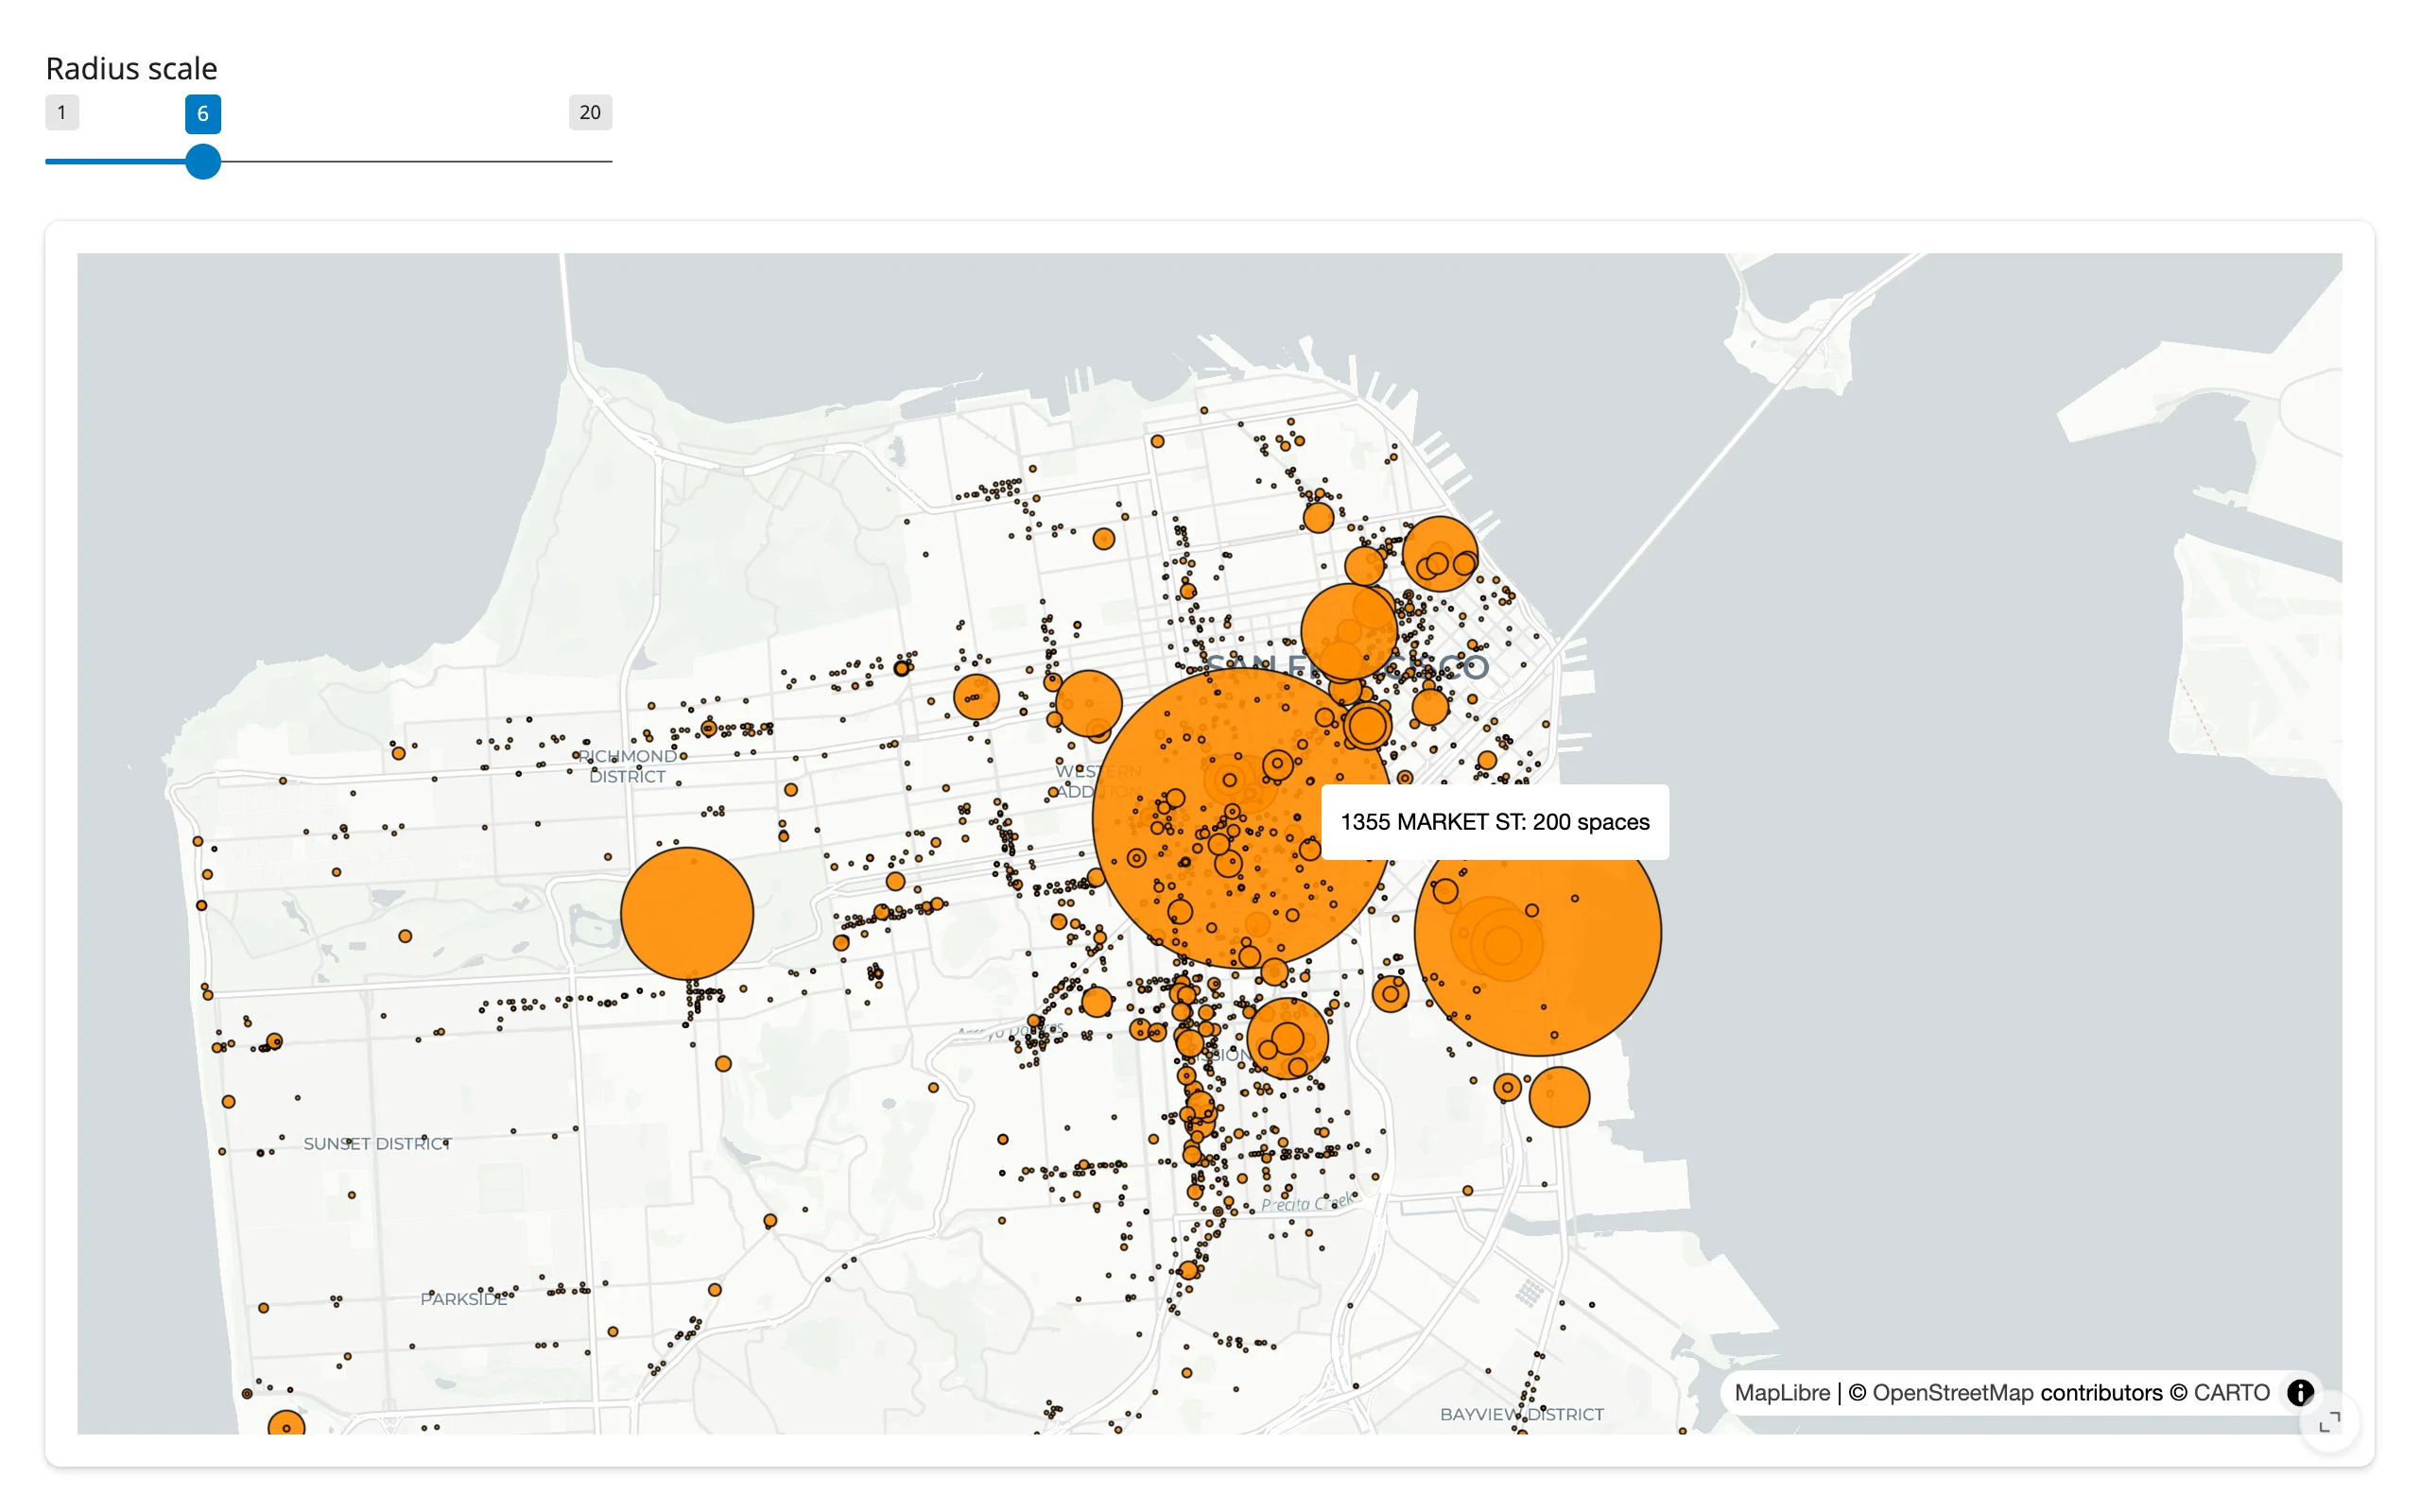
The map was panned slightly off-center before either screenshot; dragging the radius slider from 6 to 20 grows every circle without moving the camera at all:
| Radius scale 6 | Radius scale 20 (same camera) |
|---|---|
|
 |
Reading view_state and clicked
pydeck’s widget had no equivalent of this: pydeck only gave you Python callbacks (on_click/on_hover/on_view_state_change) wired through ipywidgets 8’s incompatible tooltip trait, and that stopped working after 0.8. On a maplibre map, .read() turns the same information into values you read like input.x() – maplibre has no accessor for either trait, so this is a documented shortcut for reactive_read(map.widget, ...), not a behavior change – see the maplibre accessor reference for the full trait list. The two most useful ones for a migrated pydeck app:
view_state["bounds"]– the visible viewport, for an “N features in view” counter.clicked– the clicked point’s{lng, lat}(not the picked deck.gl object – see Gotchas). Find the nearest row in Python to get a detail panel.
examples/03_view_state_clicked.py links both to a single text panel:
import numpy as np
import pydeck as pdk
import requests
from maplibre import Map, MapOptions
from maplibre.basemaps import Carto
from shiny.express import render, ui
from shinywidgets import render_maplibre

BIKE_RACKS = requests.get(
    "https://raw.githubusercontent.com/visgl/deck.gl-data/master/website/sf-bike-parking.json"
).json()
LNG = np.array([r["COORDINATES"][0] for r in BIKE_RACKS])
LAT = np.array([r["COORDINATES"][1] for r in BIKE_RACKS])

ui.page_opts(fillable=True)

with ui.layout_columns(col_widths=[8, 4]):
    with ui.card(full_screen=True):

        @render_maplibre
        def bike_racks():
            m = Map(MapOptions(style=Carto.POSITRON, center=(-122.4194, 37.7749), zoom=12))
            m.add_deck_layers(
                [
                    pdk.Layer(
                        "ScatterplotLayer",
                        BIKE_RACKS,
                        id="bike-racks",
                        get_position="COORDINATES",
                        get_radius="SPACES",
                        get_fill_color=[255, 140, 0],
                        pickable=True,
                        radius_scale=6,
                        radius_min_pixels=1,
                    )
                ]
            )
            return m

    with ui.card():
        ui.card_header("In view / clicked")

        @render.ui
        def summary():
            vs = bike_racks.read("view_state")
            if vs:
                sw, ne = vs["bounds"]["_sw"], vs["bounds"]["_ne"]
                mask = (LNG >= sw["lng"]) & (LNG <= ne["lng"]) & (LAT >= sw["lat"]) & (LAT <= ne["lat"])
                in_view = f"{int(mask.sum())} of {len(BIKE_RACKS)} racks in view"
            else:
                in_view = f"{len(BIKE_RACKS)} racks (unzoomed)"

            # `clicked` is the map click's lng/lat, not the picked deck.gl
            # object -- find the nearest rack in Python, same workaround the
            # maplibre guide uses for its own `clicked` trait.
            ll = bike_racks.read("clicked")
            if not ll:
                detail = "Click a dot on the map."
            else:
                i = int(np.argmin((LNG - ll["lng"]) ** 2 + (LAT - ll["lat"]) ** 2))
                r = BIKE_RACKS[i]
                detail = f"Nearest rack: {r['ADDRESS']} ({r['SPACES']} spaces)"

            return ui.TagList(ui.tags.p(in_view), ui.tags.p(detail))
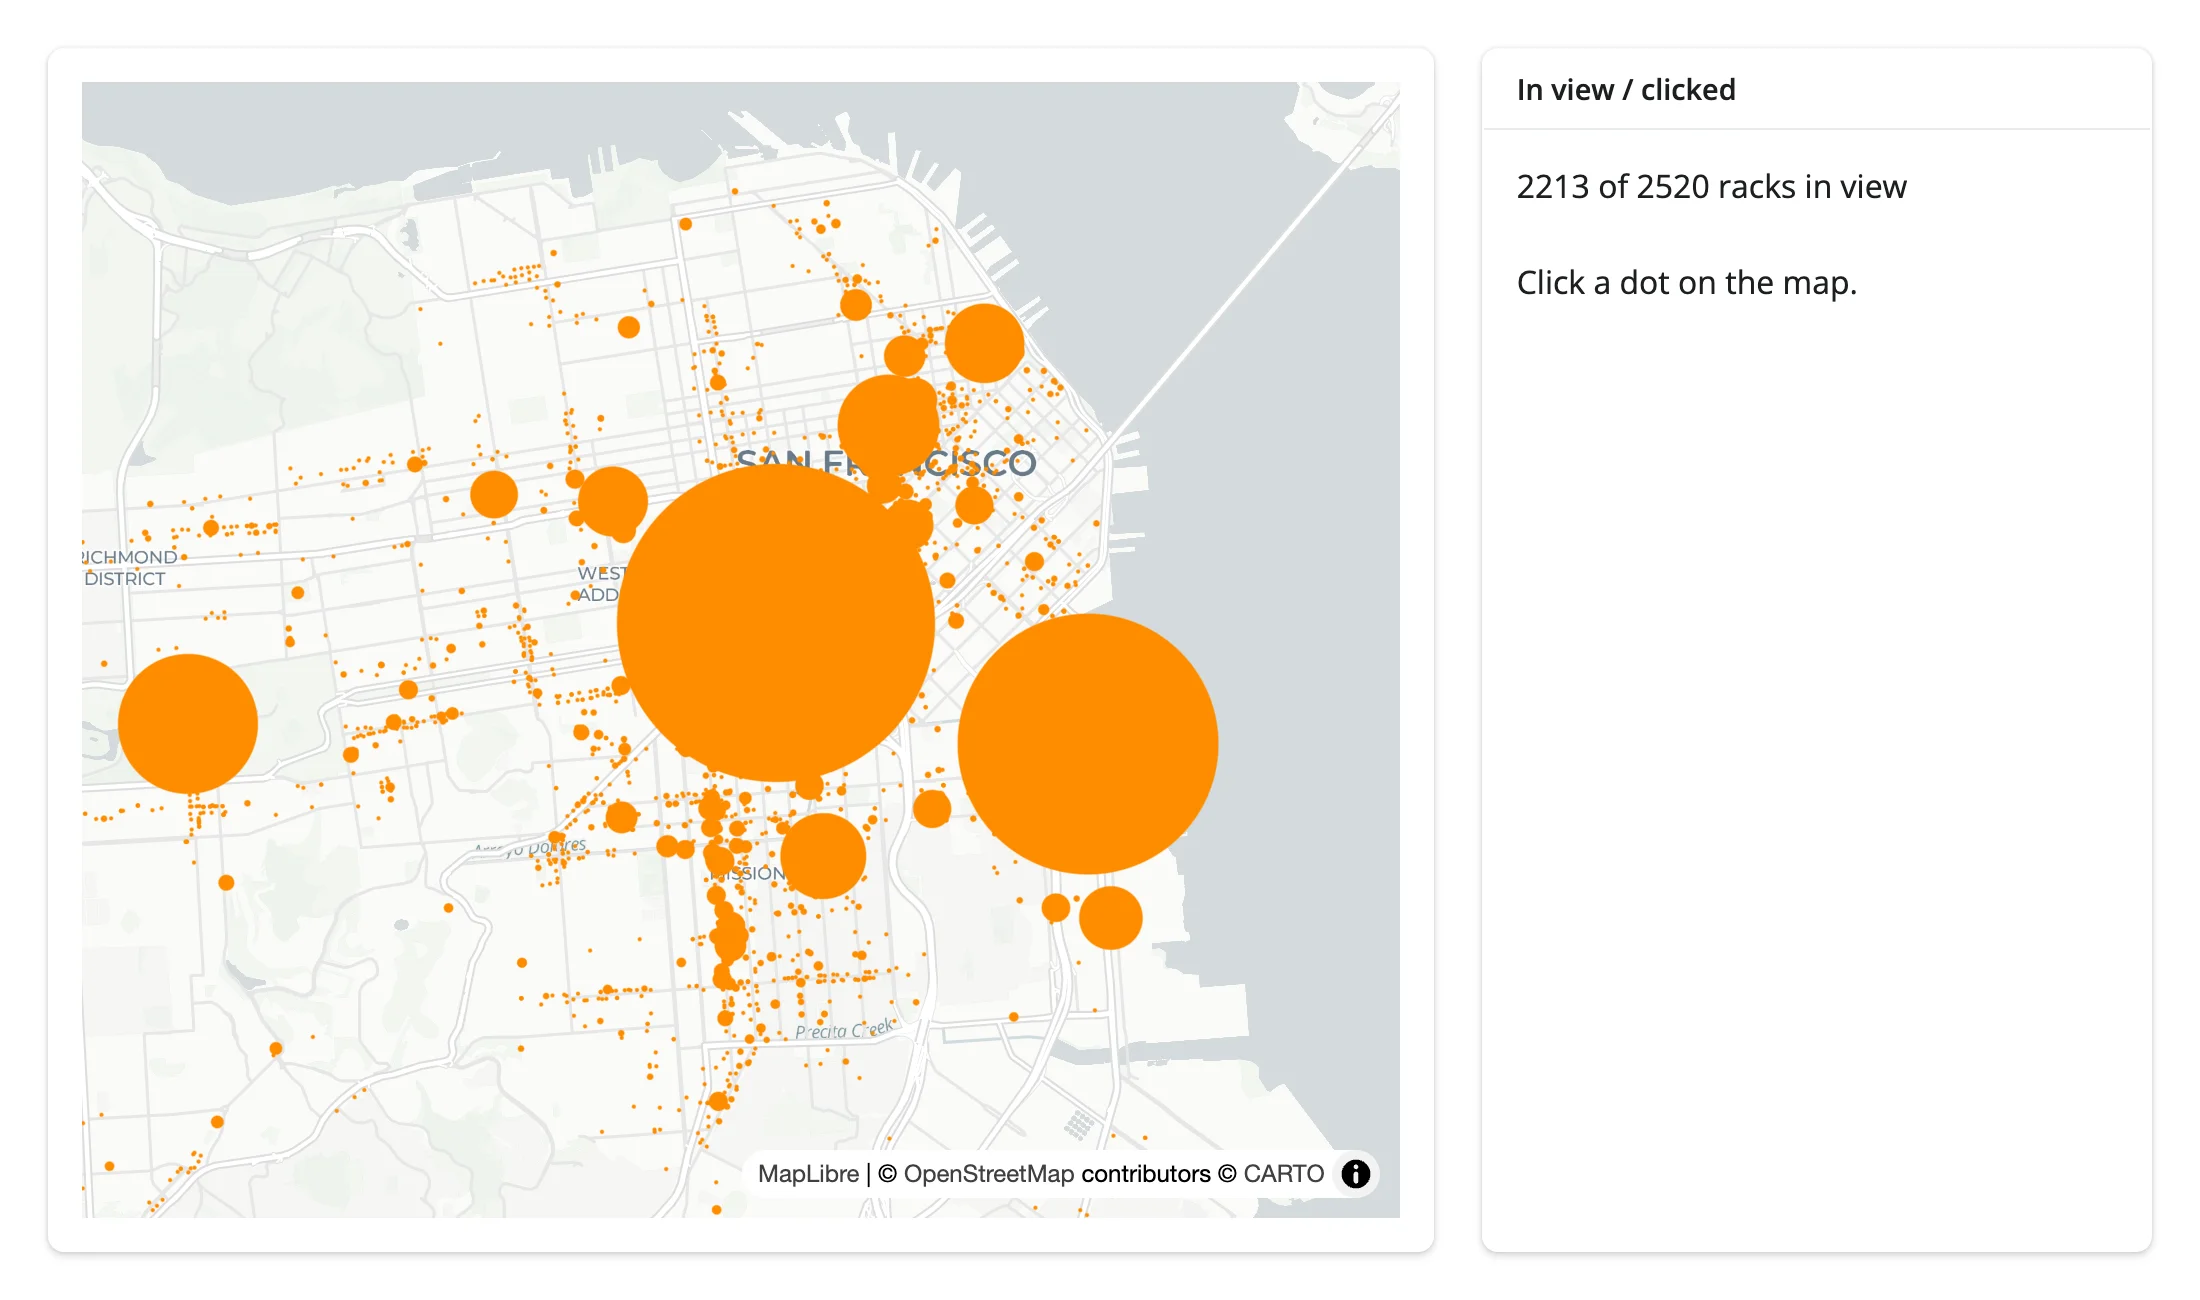
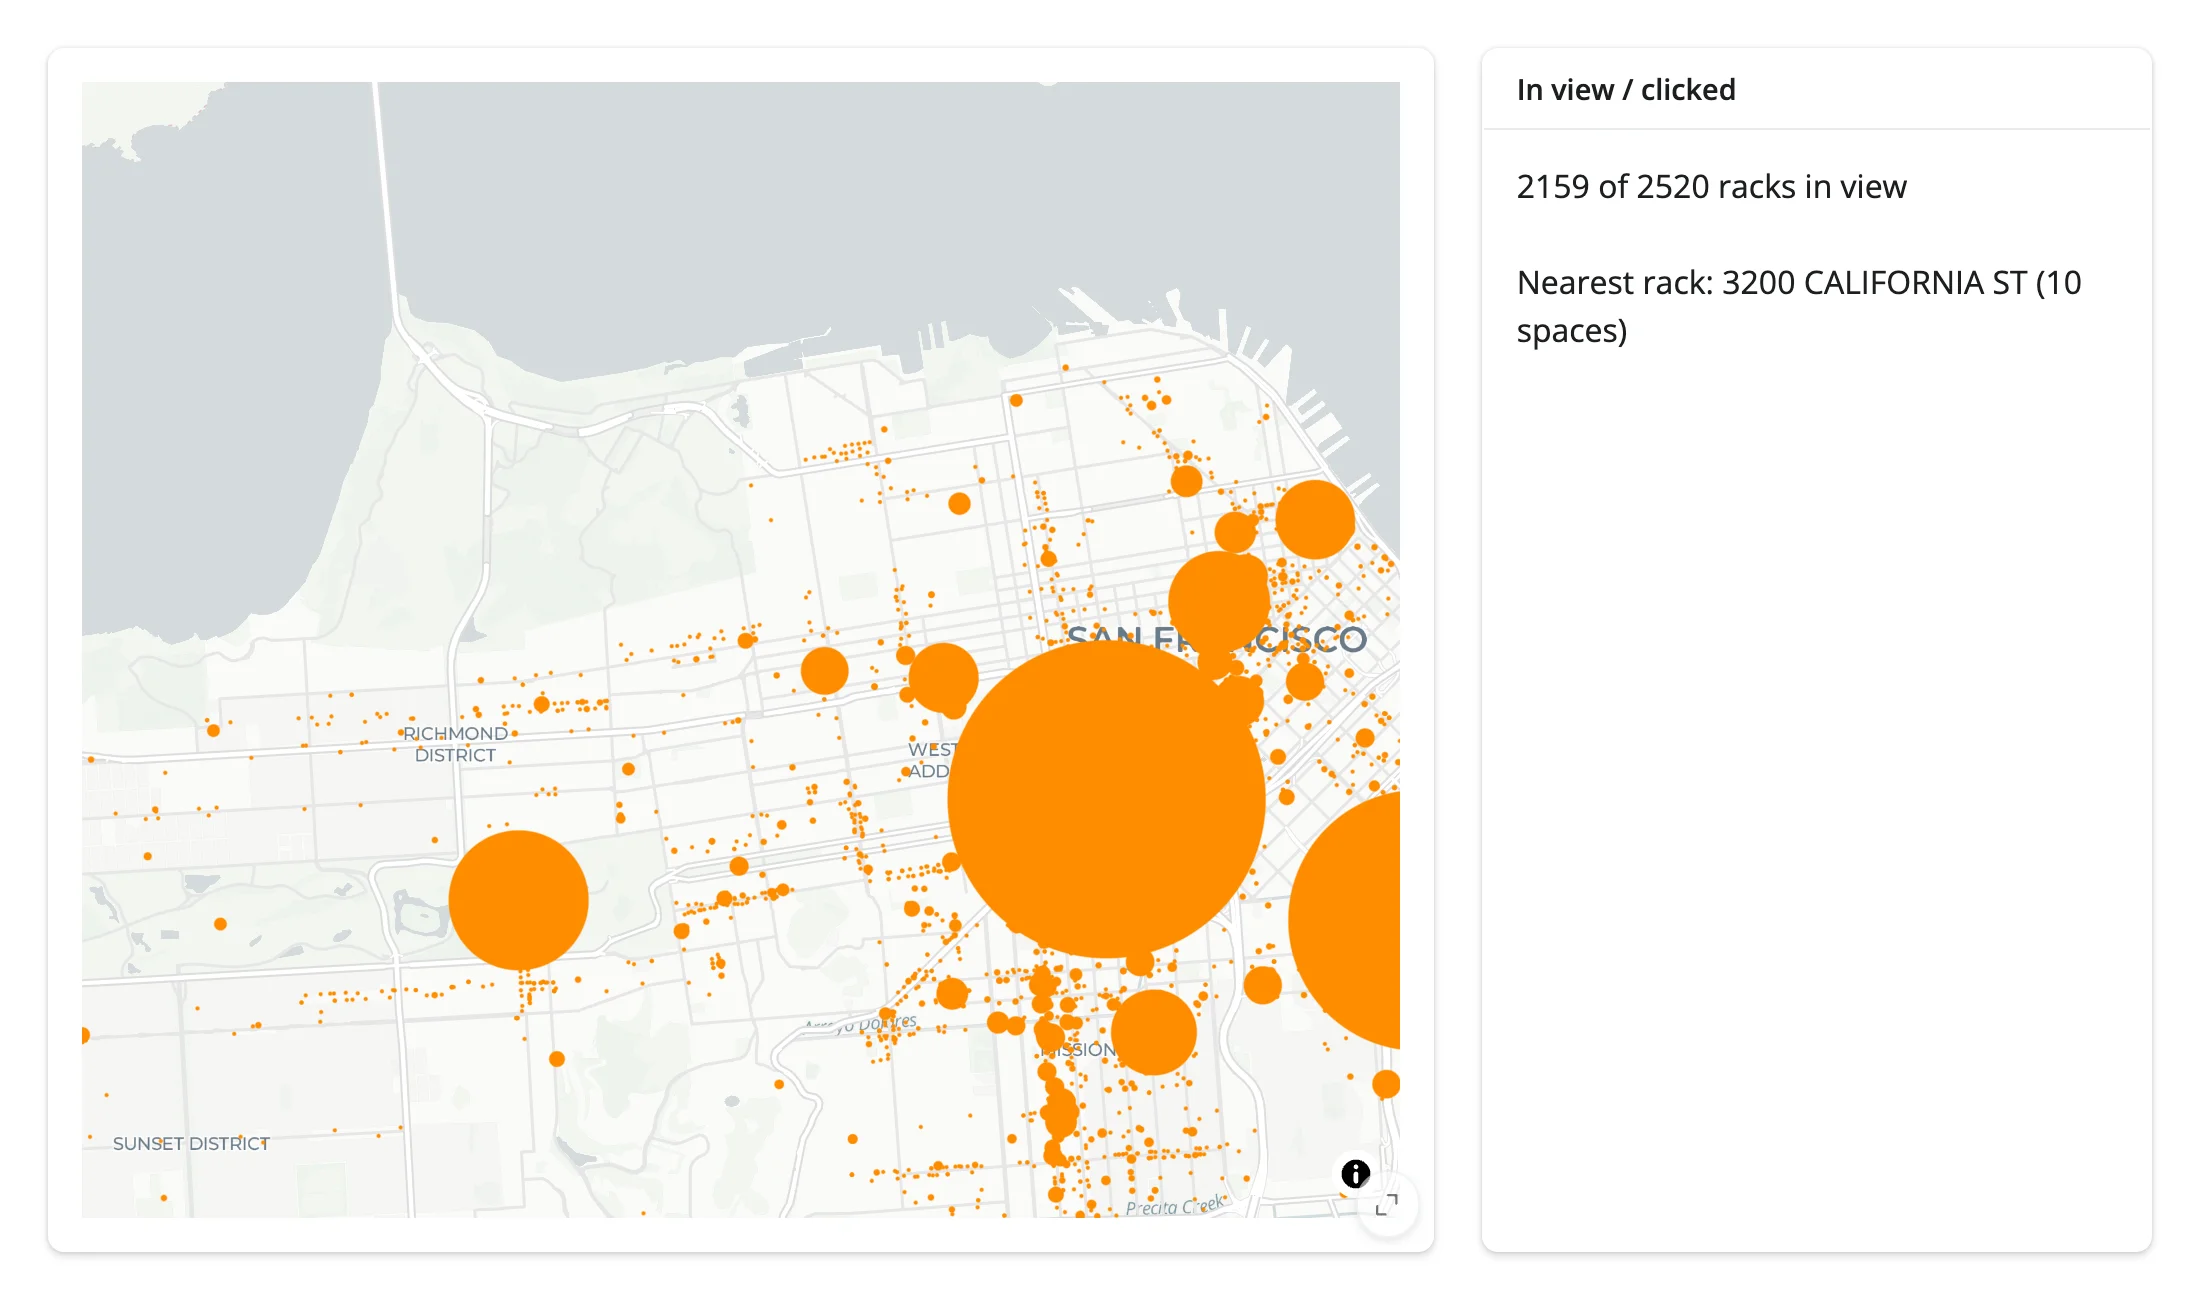
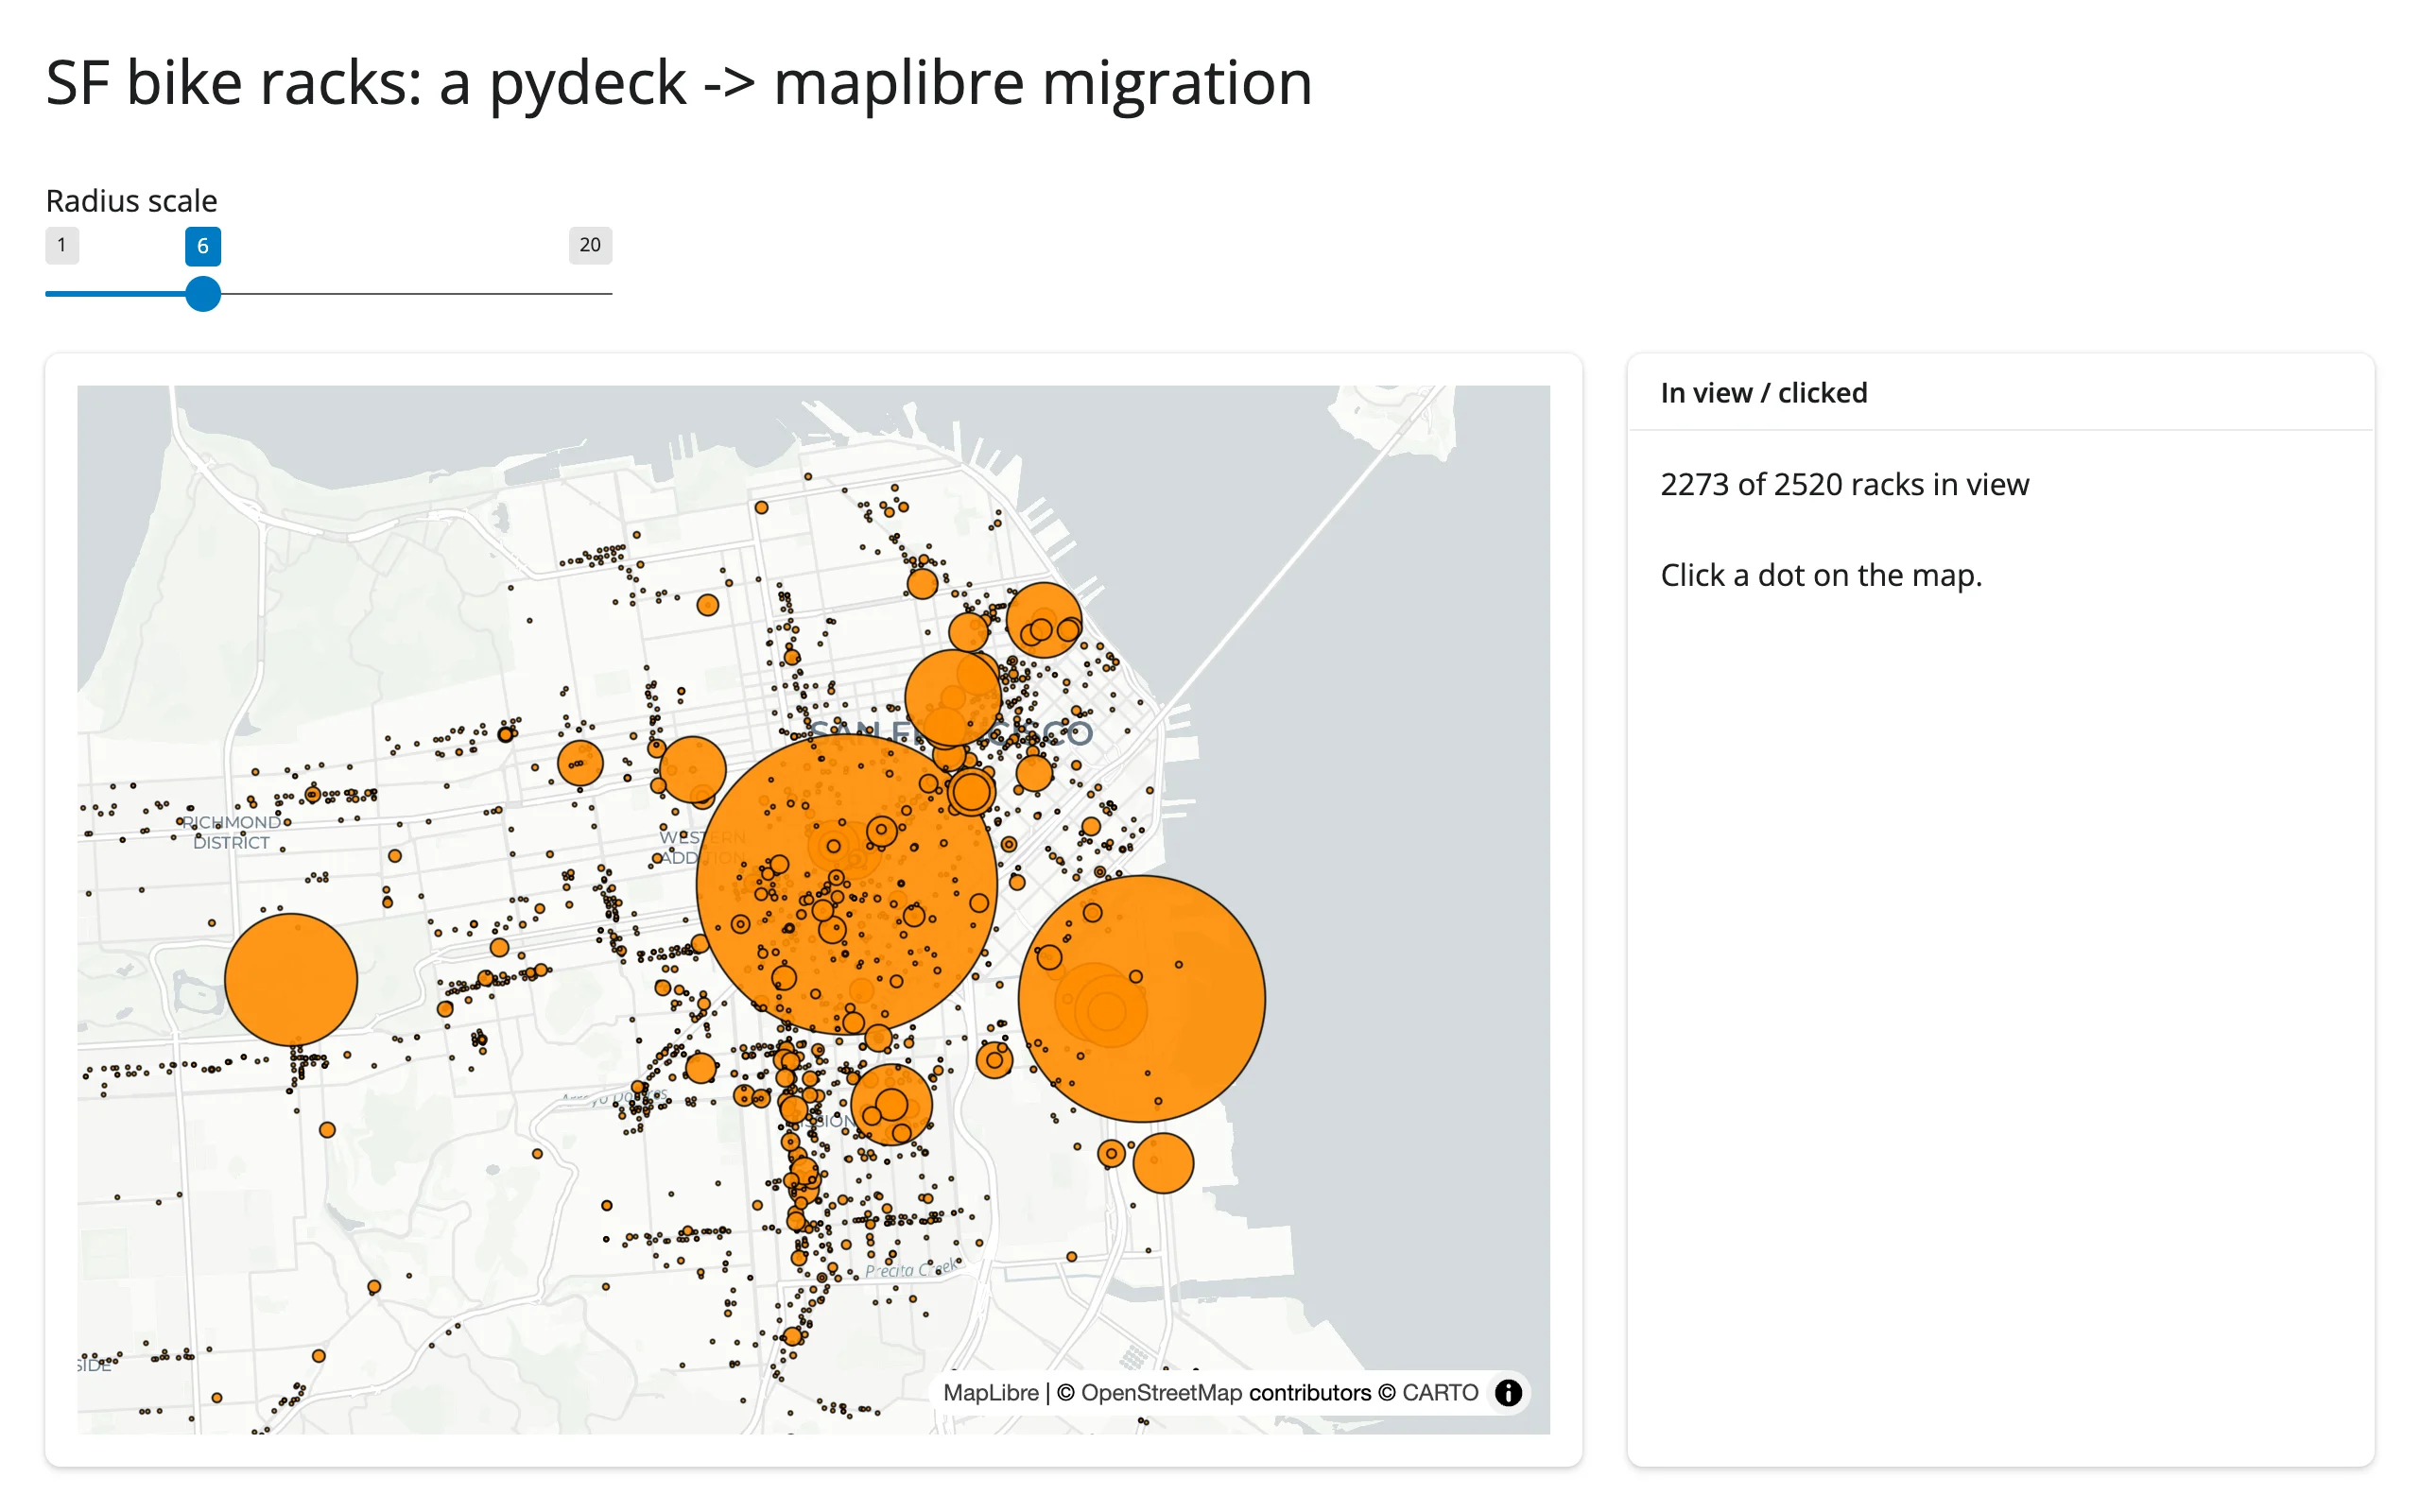
Zooming into downtown drops the in-view count from 2,351 to 1,942; clicking a dot then shows the nearest rack’s address:
| Before (unzoomed, unclicked) | After zooming + clicking |
|---|---|
 |
 |
Deck.gl tooltips
add_deck_layers() / set_deck_layers() take the same tooltip= dict pydeck’s own widget accepted – a mustache template keyed by layer id, rendered entirely in the browser on hover (no Python round trip). It’s already in the restyle example above (TOOLTIP = {"bike-racks": "{{ADDRESS}}: {{SPACES}} spaces"}); hovering a rack shows its address and capacity:
What doesn’t carry over
- Multiple viewports (
pdk.Deck(views=[...])). pydeck’sOrbitView/OrthographicView/multipleMapViewsupport has no maplibre equivalent –add_deck_layers()takes onlylayersandtooltip, and renders into the one MapLibre map. If your pydeck app usedviews=for a side-by-side or non-geospatial (orbit/orthographic) view, there’s no drop-in replacement here. initial_view_state->MapOptions, and the field names don’t match. pydeck’sViewStatetakes separatelatitude=/longitude=keywords (order doesn’t matter, they’re named); maplibre’sMapOptionstakes a single positional-ordercenter=(lng, lat)tuple – longitude first. Swap the order, not just the names, or your map centers on the wrong hemisphere.map_style/map_provider->MapOptions(style=...). pydeck defaults tomap_provider="carto"(token-free) and only needs a key for Mapbox/Google styles or satellite imagery. maplibre’s token-free defaults aremaplibre.basemaps.CartoandOpenFreeMap(see the maplibre basemap section) – same idea, different names, and no satellite-imagery equivalent without your own vector/raster source.- GPU-side aggregation layers (Hexagon, Grid, Heatmap, CPU) still work identically – they’re the same deck.gl layers, just hosted on a maplibre map instead of pydeck’s own canvas. See the maplibre guide’s own deck.gl section and its 140,000-point UK-accidents showcase (below) for a Hexagon example at scale.
Migration path B: lonboard (large data)
If your pydeck map’s bottleneck was data volume rather than deck.gl’s layer catalog, convert to lonboard instead of maplibre. lonboard sends your geometry once as binary Arrow/GeoArrow data and restyles with no data re-transfer at all, whereas every set_deck_layers() call on a maplibre map re-sends the full layer JSON (fine up to a few hundred thousand rows; see the maplibre guide’s gallery showcase for a 140k-point example of that trade-off). lonboard also has real reactive accessors (view_state(), clicked(), selected(), selected_bounds()), not just a reactive_read() tier, and a built-in box-select – useful once an app needs more than click/pan.
The trade-off: lonboard has no GPU-side aggregation layers (no Hexagon/Grid/Heatmap binning) – aggregate in Python first (e.g. with H3) if you were relying on one of those.
pip install lonboard geopandas pyarrowConverting the same ScatterplotLayer means building a GeoDataFrame (lonboard’s ScatterplotLayer.from_geopandas() wants real point geometry, not a get_position= column name) and passing per-row styling as plain arrays instead of pydeck’s string accessors:
import geopandas as gpd
import pandas as pd
import requests
from lonboard import Map, ScatterplotLayer
from shiny.express import ui
from shinywidgets import render_lonboard

BIKE_RACKS = requests.get(
    "https://raw.githubusercontent.com/visgl/deck.gl-data/master/website/sf-bike-parking.json"
).json()
df = pd.DataFrame(BIKE_RACKS)
LNG = df["COORDINATES"].str[0]
LAT = df["COORDINATES"].str[1]
RACKS = gpd.GeoDataFrame(df, geometry=gpd.points_from_xy(LNG, LAT), crs="EPSG:4326")

ui.page_opts(fillable=True)

with ui.card(full_screen=True):

    @render_lonboard
    def bike_racks():
        return Map(
            ScatterplotLayer.from_geopandas(
                RACKS,
                get_radius=RACKS["SPACES"],
                radius_scale=6,
                radius_min_pixels=1,
                get_fill_color=[255, 140, 0],
                pickable=True,
            )
        )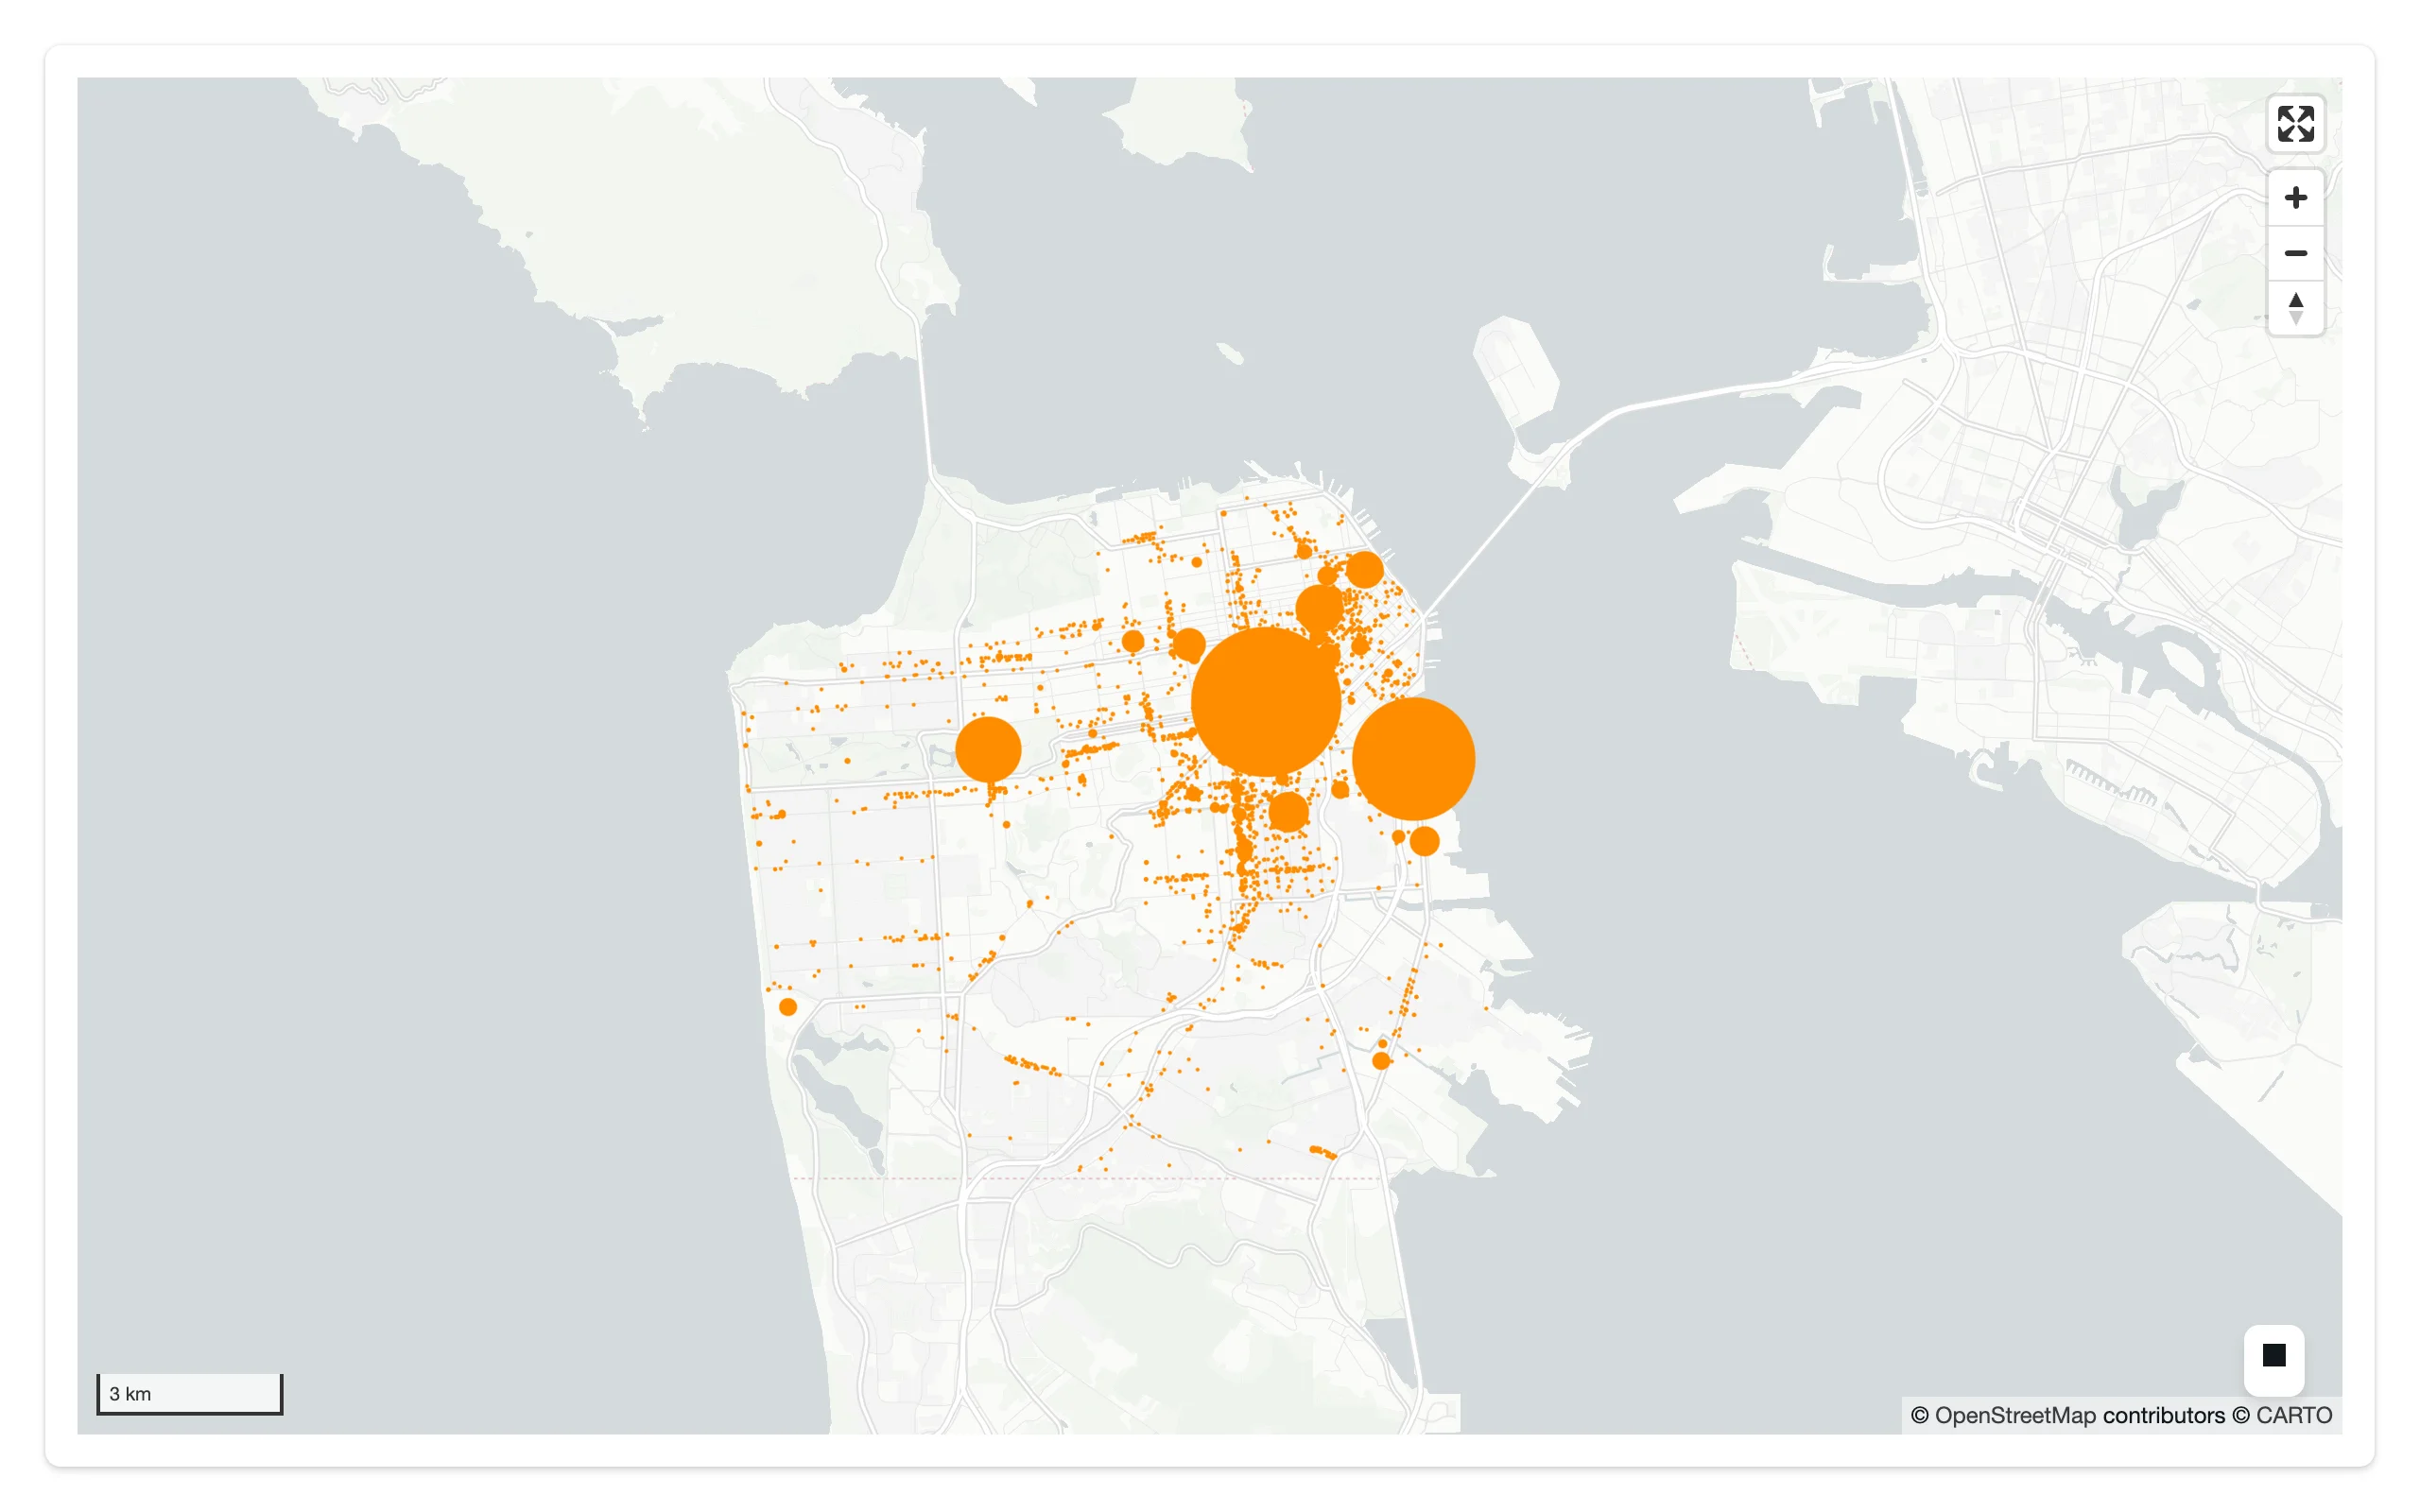
get_position="COORDINATES" (a pydeck string accessor into each row) became the GeoDataFrame’s geometry column; get_radius="SPACES" became a plain Series passed by value. Map(...) auto-fits the view to the data, same as pydeck’s initial_view_state would have needed you to compute by hand.
Migration path C: static map (@render.ui + to_html)
If you don’t need reactivity at all – a one-off map that never updates after it’s drawn – you can keep using pydeck’s own HTML export, wrapped in an iframe:
import pydeck as pdk
import requests
from shiny.express import render, ui

BIKE_RACKS = requests.get(
    "https://raw.githubusercontent.com/visgl/deck.gl-data/master/website/sf-bike-parking.json"
).json()

ui.page_opts(fillable=True)

with ui.card(full_screen=True):

    @render.ui
    def bike_racks():
        layer = pdk.Layer(
            "ScatterplotLayer",
            BIKE_RACKS,
            get_position="COORDINATES",
            get_radius="SPACES",
            get_fill_color=[255, 140, 0],
            radius_scale=6,
            radius_min_pixels=1,
        )
        view_state = pdk.ViewState(latitude=37.7749, longitude=-122.4194, zoom=12)
        deck = pdk.Deck(layers=[layer], initial_view_state=view_state)
        # deck.to_html() with no filename returns None -- only as_string=True
        # gives you the HTML to embed. There's no reactivity here: every input
        # change re-renders this whole function and re-sends the full page.
        return ui.tags.iframe(
            srcdoc=deck.to_html(as_string=True),
            style="border:0;width:100%;height:100%;flex:1 1 auto",
        )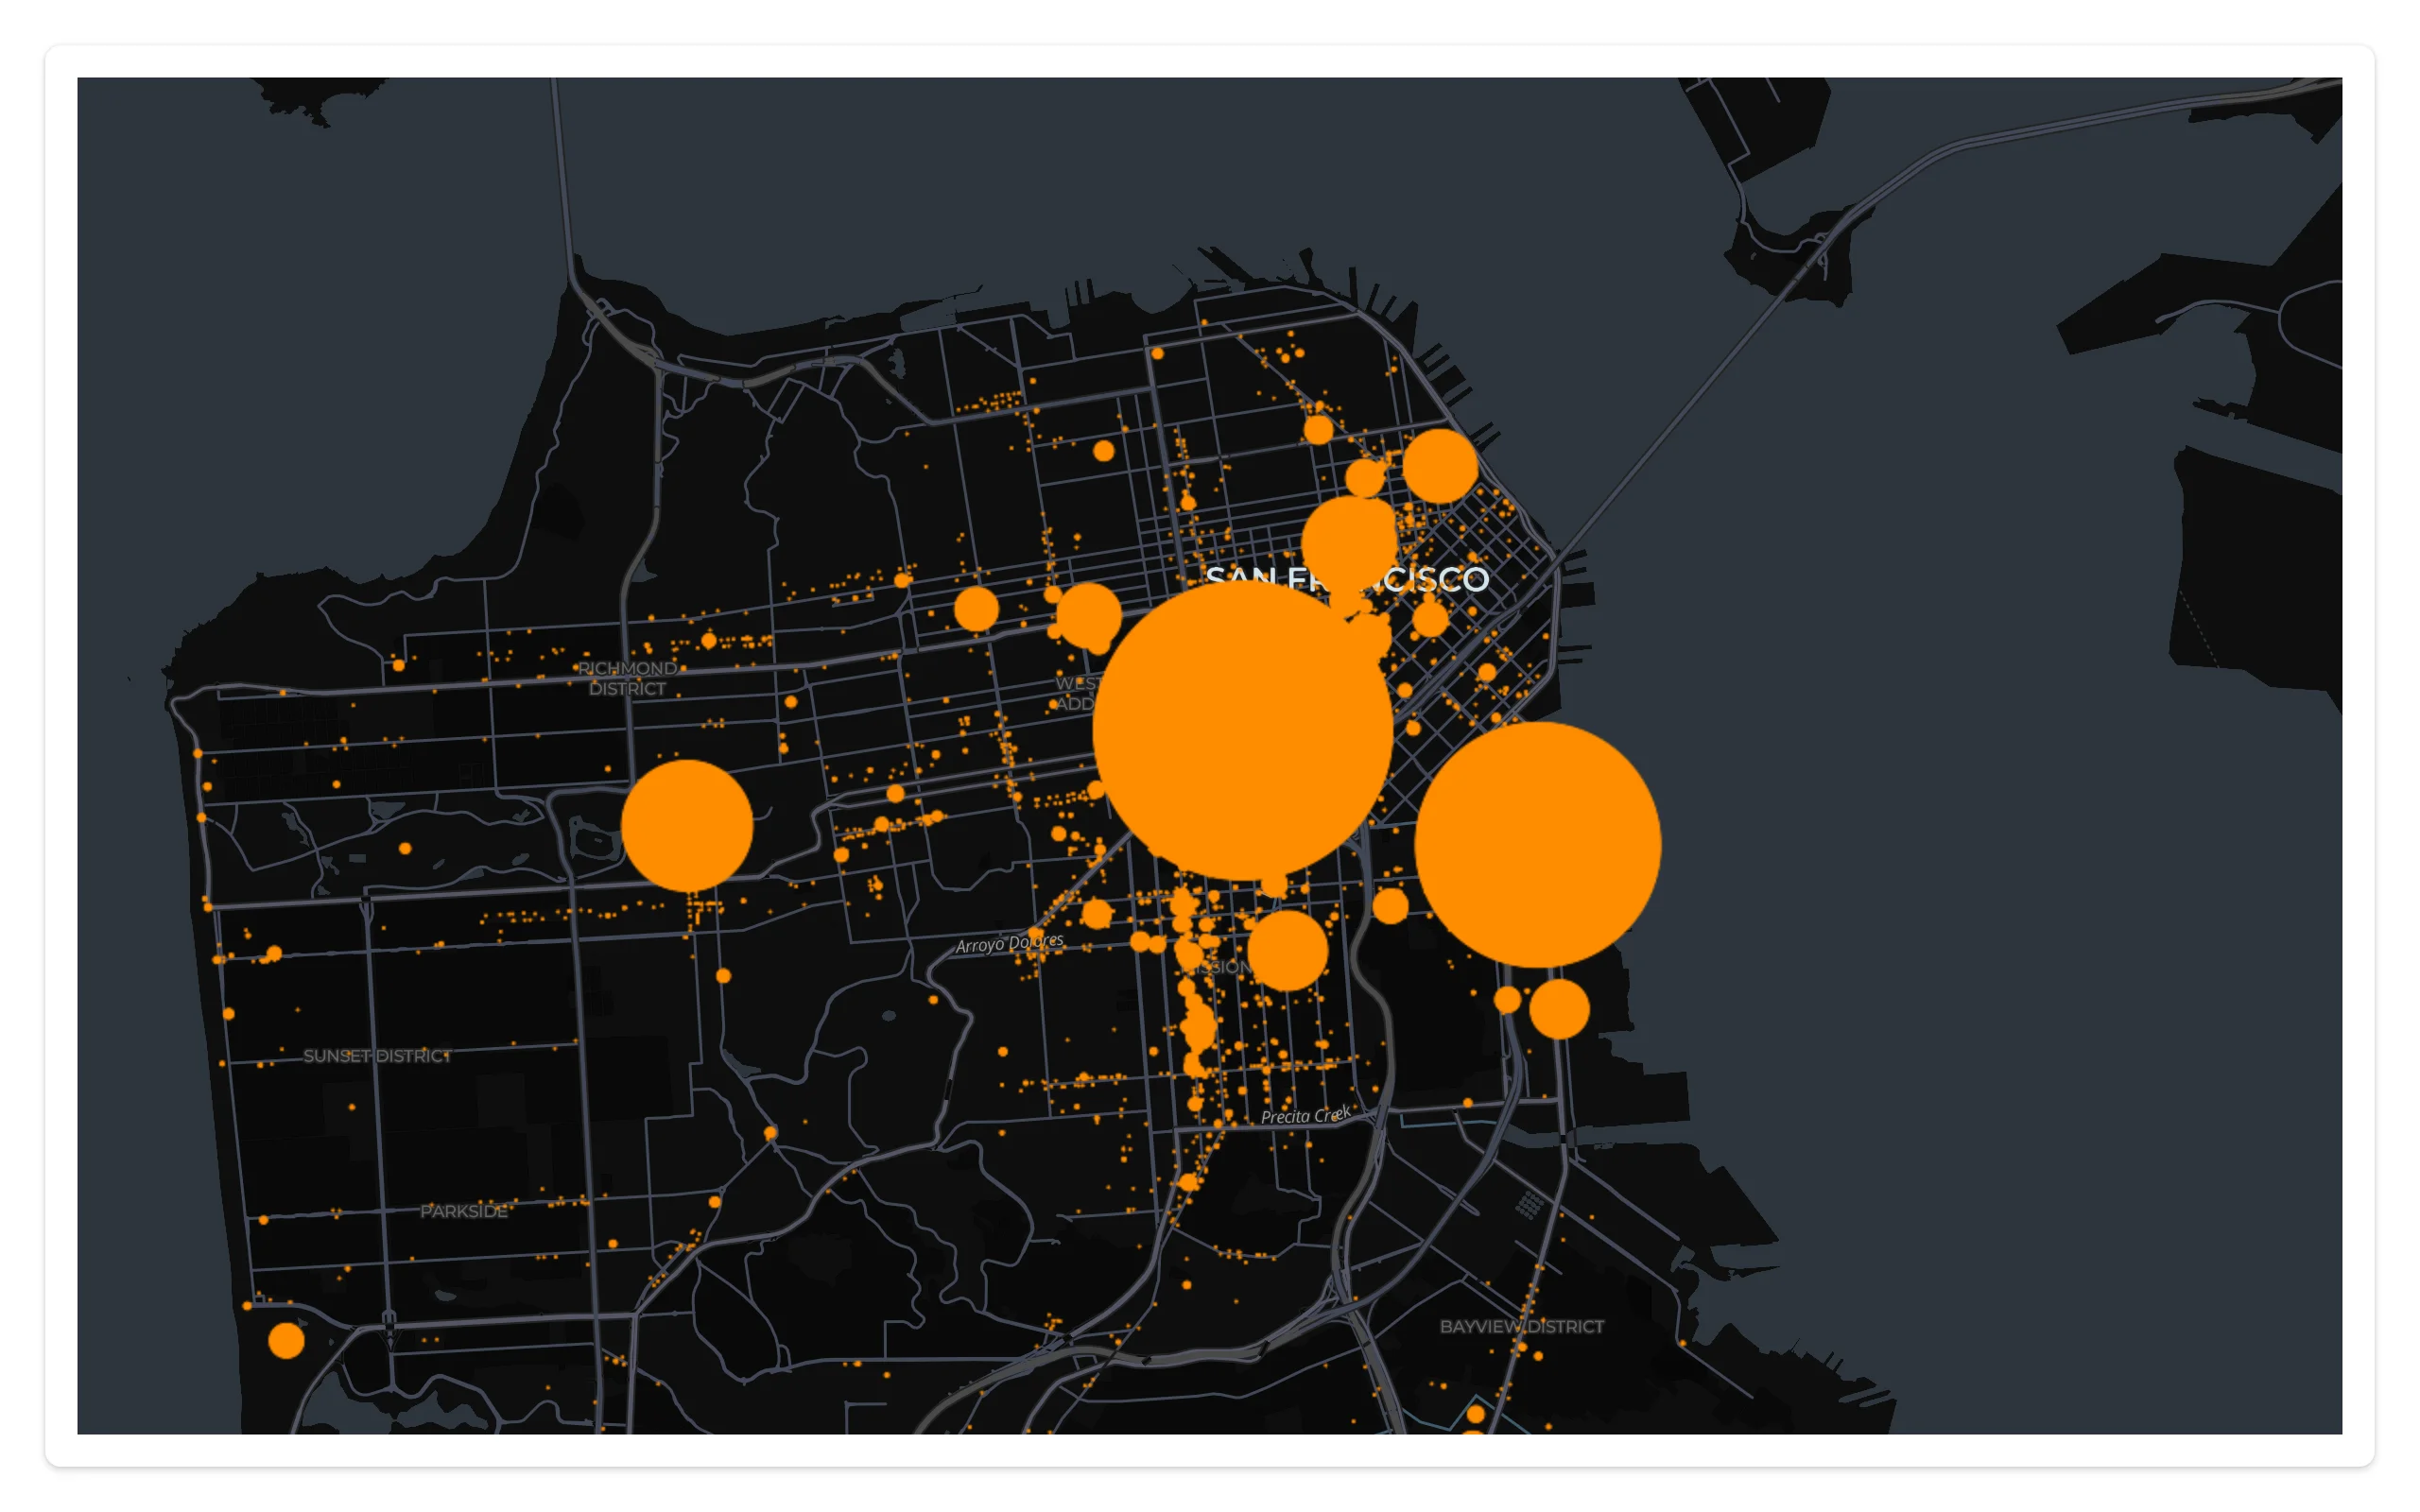
Limits, verified on this 2,520-row dataset: the embedded page is 0.48 MB and gets re-sent on every reactive invalidation of the render function, even ones that don’t touch the map – there’s no restyle-in-place here, no camera preservation, and no events back to Python. At pydeck’s own 140,000-point UK-accidents scale that was 15.6 MB resent per change (see the old evaluation report); use this path only for maps that render once and never react to anything.
Mapping table: pydeck -> maplibre / lonboard
| pydeck concept | maplibre equivalent | lonboard equivalent |
|---|---|---|
pdk.Deck(layers=[...]) |
Map(...) + m.add_deck_layers(layers) |
lonboard.Map(layers) (native lonboard layers, not pdk.Layer) |
pdk.Layer("ScatterplotLayer"/"HexagonLayer"/..., data, get_*=...) |
passed through unchanged to add_deck_layers() |
re-expressed as a native lonboard layer (ScatterplotLayer.from_geopandas(), etc.) + Arrow/GeoArrow data |
pdk.ViewState(latitude=, longitude=, zoom=, pitch=, bearing=) |
MapOptions(center=(lng, lat), zoom=, pitch=, bearing=) – note the lng-first tuple |
Map(view_state=...), auto-fit by default |
deck.update() |
map.widget.set_deck_layers([...]) from a @reactive.effect |
set a layer trait directly (e.g. map.widget.layers[0].get_fill_color = ...) from a @reactive.effect |
on_click / on_hover / on_view_state_change callbacks |
map.read("clicked" / "view_state") (no accessor; a documented shortcut for reactive_read(map.widget, ...)) |
map.clicked(), map.view_state(), map.selected(), map.selected_bounds() accessors |
tooltip={"html": ...} |
add_deck_layers(layers, tooltip={...}) (same mustache-template dict) |
no built-in tooltip; build one from clicked()/hover state yourself |
map_style / map_provider |
MapOptions(style=...), maplibre.basemaps.Carto / OpenFreeMap |
Map(basemap=...) |
views=[...] (multiple/orbit/orthographic viewports) |
not supported (one MapLibre map per output) | not supported |
deck.show() / deck.to_html() |
n/a (use @render_maplibre instead) |
n/a (use @render_lonboard instead) |
Gotchas and limitations
- The
TypeErroronly fires on render, not at decoration time.@render_pydeckitself succeeds (it just emits theFutureWarningdescribed above, which current main makes sure actually shows up in the server log); the error only appears once Shiny actually tries to render the output. A module-levelpdk.Deck()built outside any render function does not raise. clickedis a location, not a picked feature, on both migration targets. Neither maplibre’sclickedtrait nor pydeck’s oldon_clickcallback (which did give you the picked object) are equivalent here – maplibre only reports where you clicked. Find the nearest row in Python, as bothexamples/03_view_state_clicked.pyand the maplibre guide’s click-to-detail pattern do. lonboard’sselected()accessor, by contrast, does give you the picked row index directly – one more reason to prefer it if per-feature picking matters more than deck.gl’s aggregation layers.deck.to_html()with no filename returnsNone, not a string. Easy to copy from pydeck’s own docs and get a blank output; you needas_string=True.- Every
set_deck_layers()call re-sends the layer’s data as JSON. Fine at the 2,520-row scale in this guide’s examples; keep an eye on payload size as your pydeck migration’s row count grows, or switch to lonboard. - This renderer has no shinywidgets extra. Unlike every other
render_*decorator,pip install 'shinywidgets[pydeck]'doesn’t exist – there’s nothing left to install for a renderer that only raises. Installpydeck(for theLayerAPI) plusshinywidgets[maplibre]orlonboardfor wherever you’re rendering it.
Gallery candidates
template_bike_racks.py
A small, adaptable starting point (about 75 lines) that is the complete migration in one file: the restyle-in-place slider, the deck.gl tooltip, and the view_state/clicked summary panel from this guide, combined.
| Before | After zooming + clicking |
|---|---|
 |
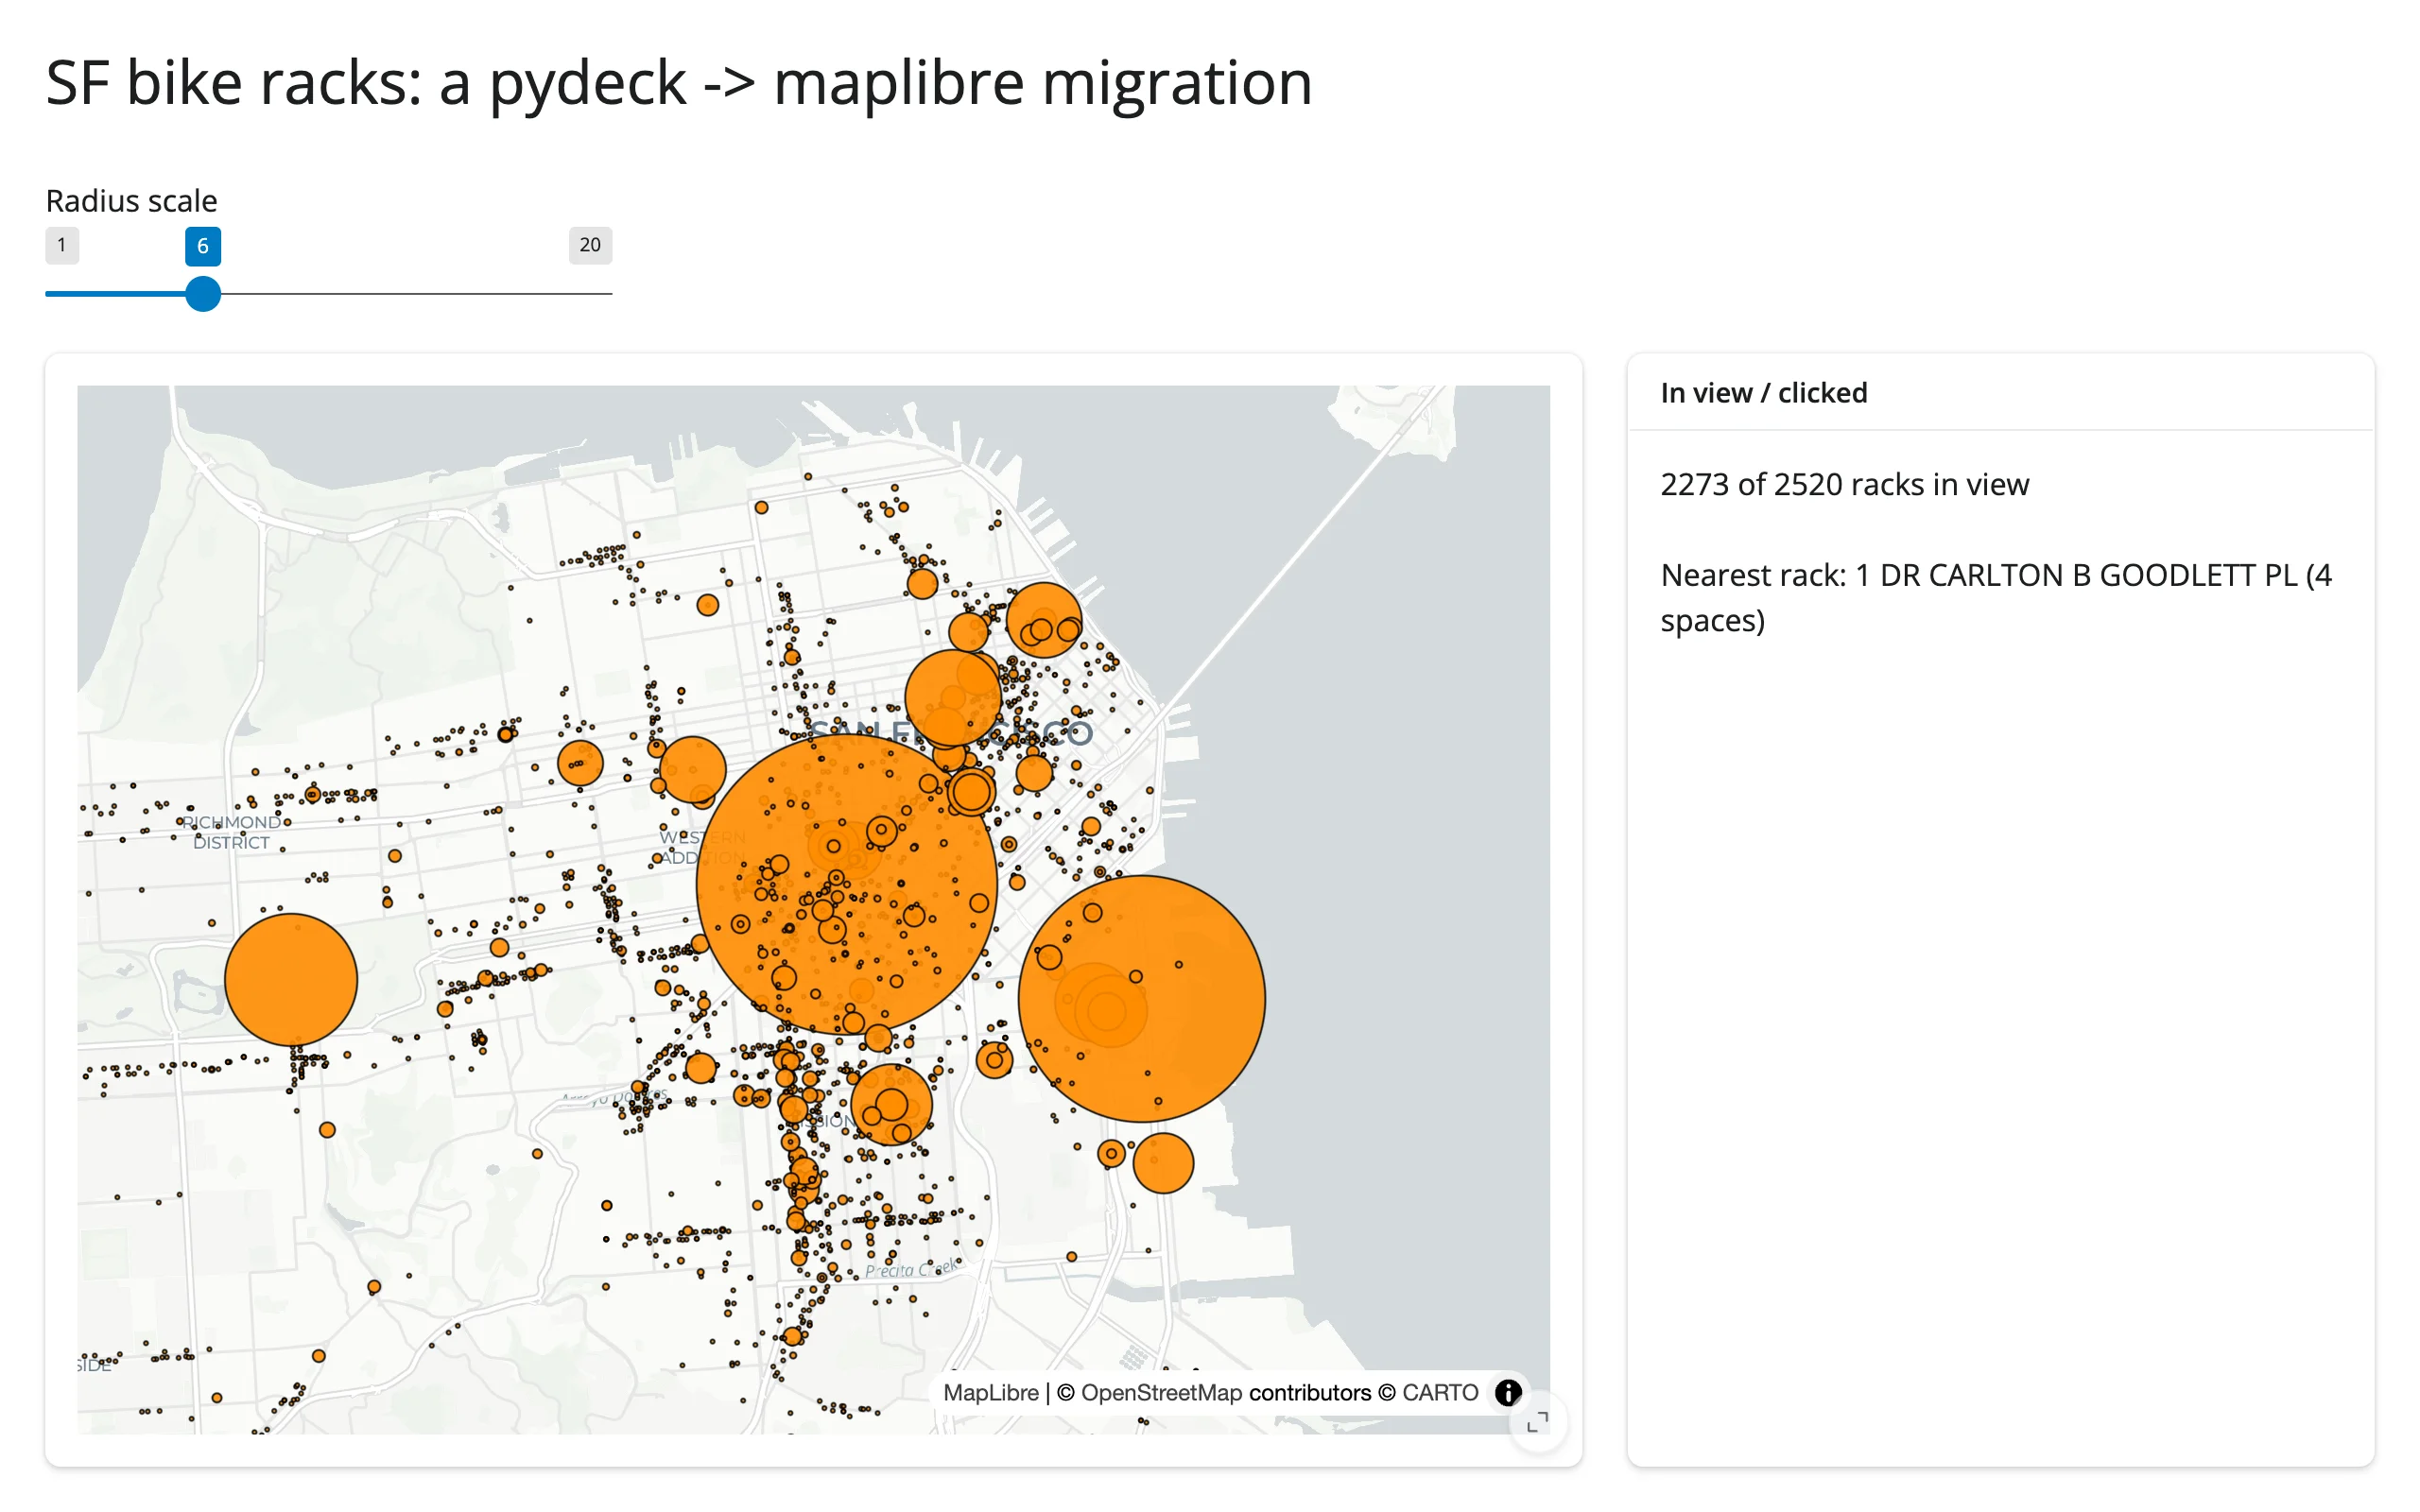 |
For a larger, more involved deck.gl showcase (140,000 points, click-to-probe, pan-to-count, GPU-side Hexagon aggregation), see the maplibre guide’s own gallery showcase – it’s built from the same examples/pydeck/app.py this deprecation replaced.
Learn more
- pydeck / deck.gl Python bindings documentation (the
pydeck.Layercatalog and its per-layer keyword arguments are still the right reference once your layers live on a maplibre or lonboard map) - deck.gl/visgl#9064 – the open upstream issue tracking a possible revival of pydeck’s Jupyter/anywidget bindings
- Related guides in this roster: maplibre (the primary migration target, full feature tour and accessor reference), lonboard (large-scale data, native accessors)