ipycytoscape
ipycytoscape is a Jupyter widget built by QuantStack that wraps Cytoscape.js, the network-visualization library behind a lot of bioinformatics and graph tooling. Its appeal is the combination: networkx does the graph analysis in Python (communities, shortest paths, centrality), and Cytoscape.js draws the result as a draggable, zoomable network with a CSS-like stylesheet language for mapping data onto size, color, and shape.
@render_ipycytoscape accepts a networkx.Graph (Graph, DiGraph, or MultiGraph, coerced automatically) or an ipycytoscape.CytoscapeWidget you’ve already built, and handles the layout work shinywidgets does for every widget: filling its card or output, tracking container resizes, and sizing correctly whether you pass a fixed height or let it fill. Four accessors turn graph interaction into reactive values, so reading them is like reading input.my_slider(): clicked_node()/clicked_edge() report single clicks, and selected_nodes()/ selected_edges() report the current selection, including shift-drag box-select and multi-select.
Reach for ipycytoscape when you want an interactive, explorable network for small-to-medium graphs (up to roughly a thousand nodes) with a rich styling and layout vocabulary. For graphs in the tens of thousands of nodes or more, where ipycytoscape’s one-ipywidget-per-element design becomes the bottleneck, see ipysigma, which renders with WebGL instead. For geographic networks, see ipyleaflet or lonboard with line layers.
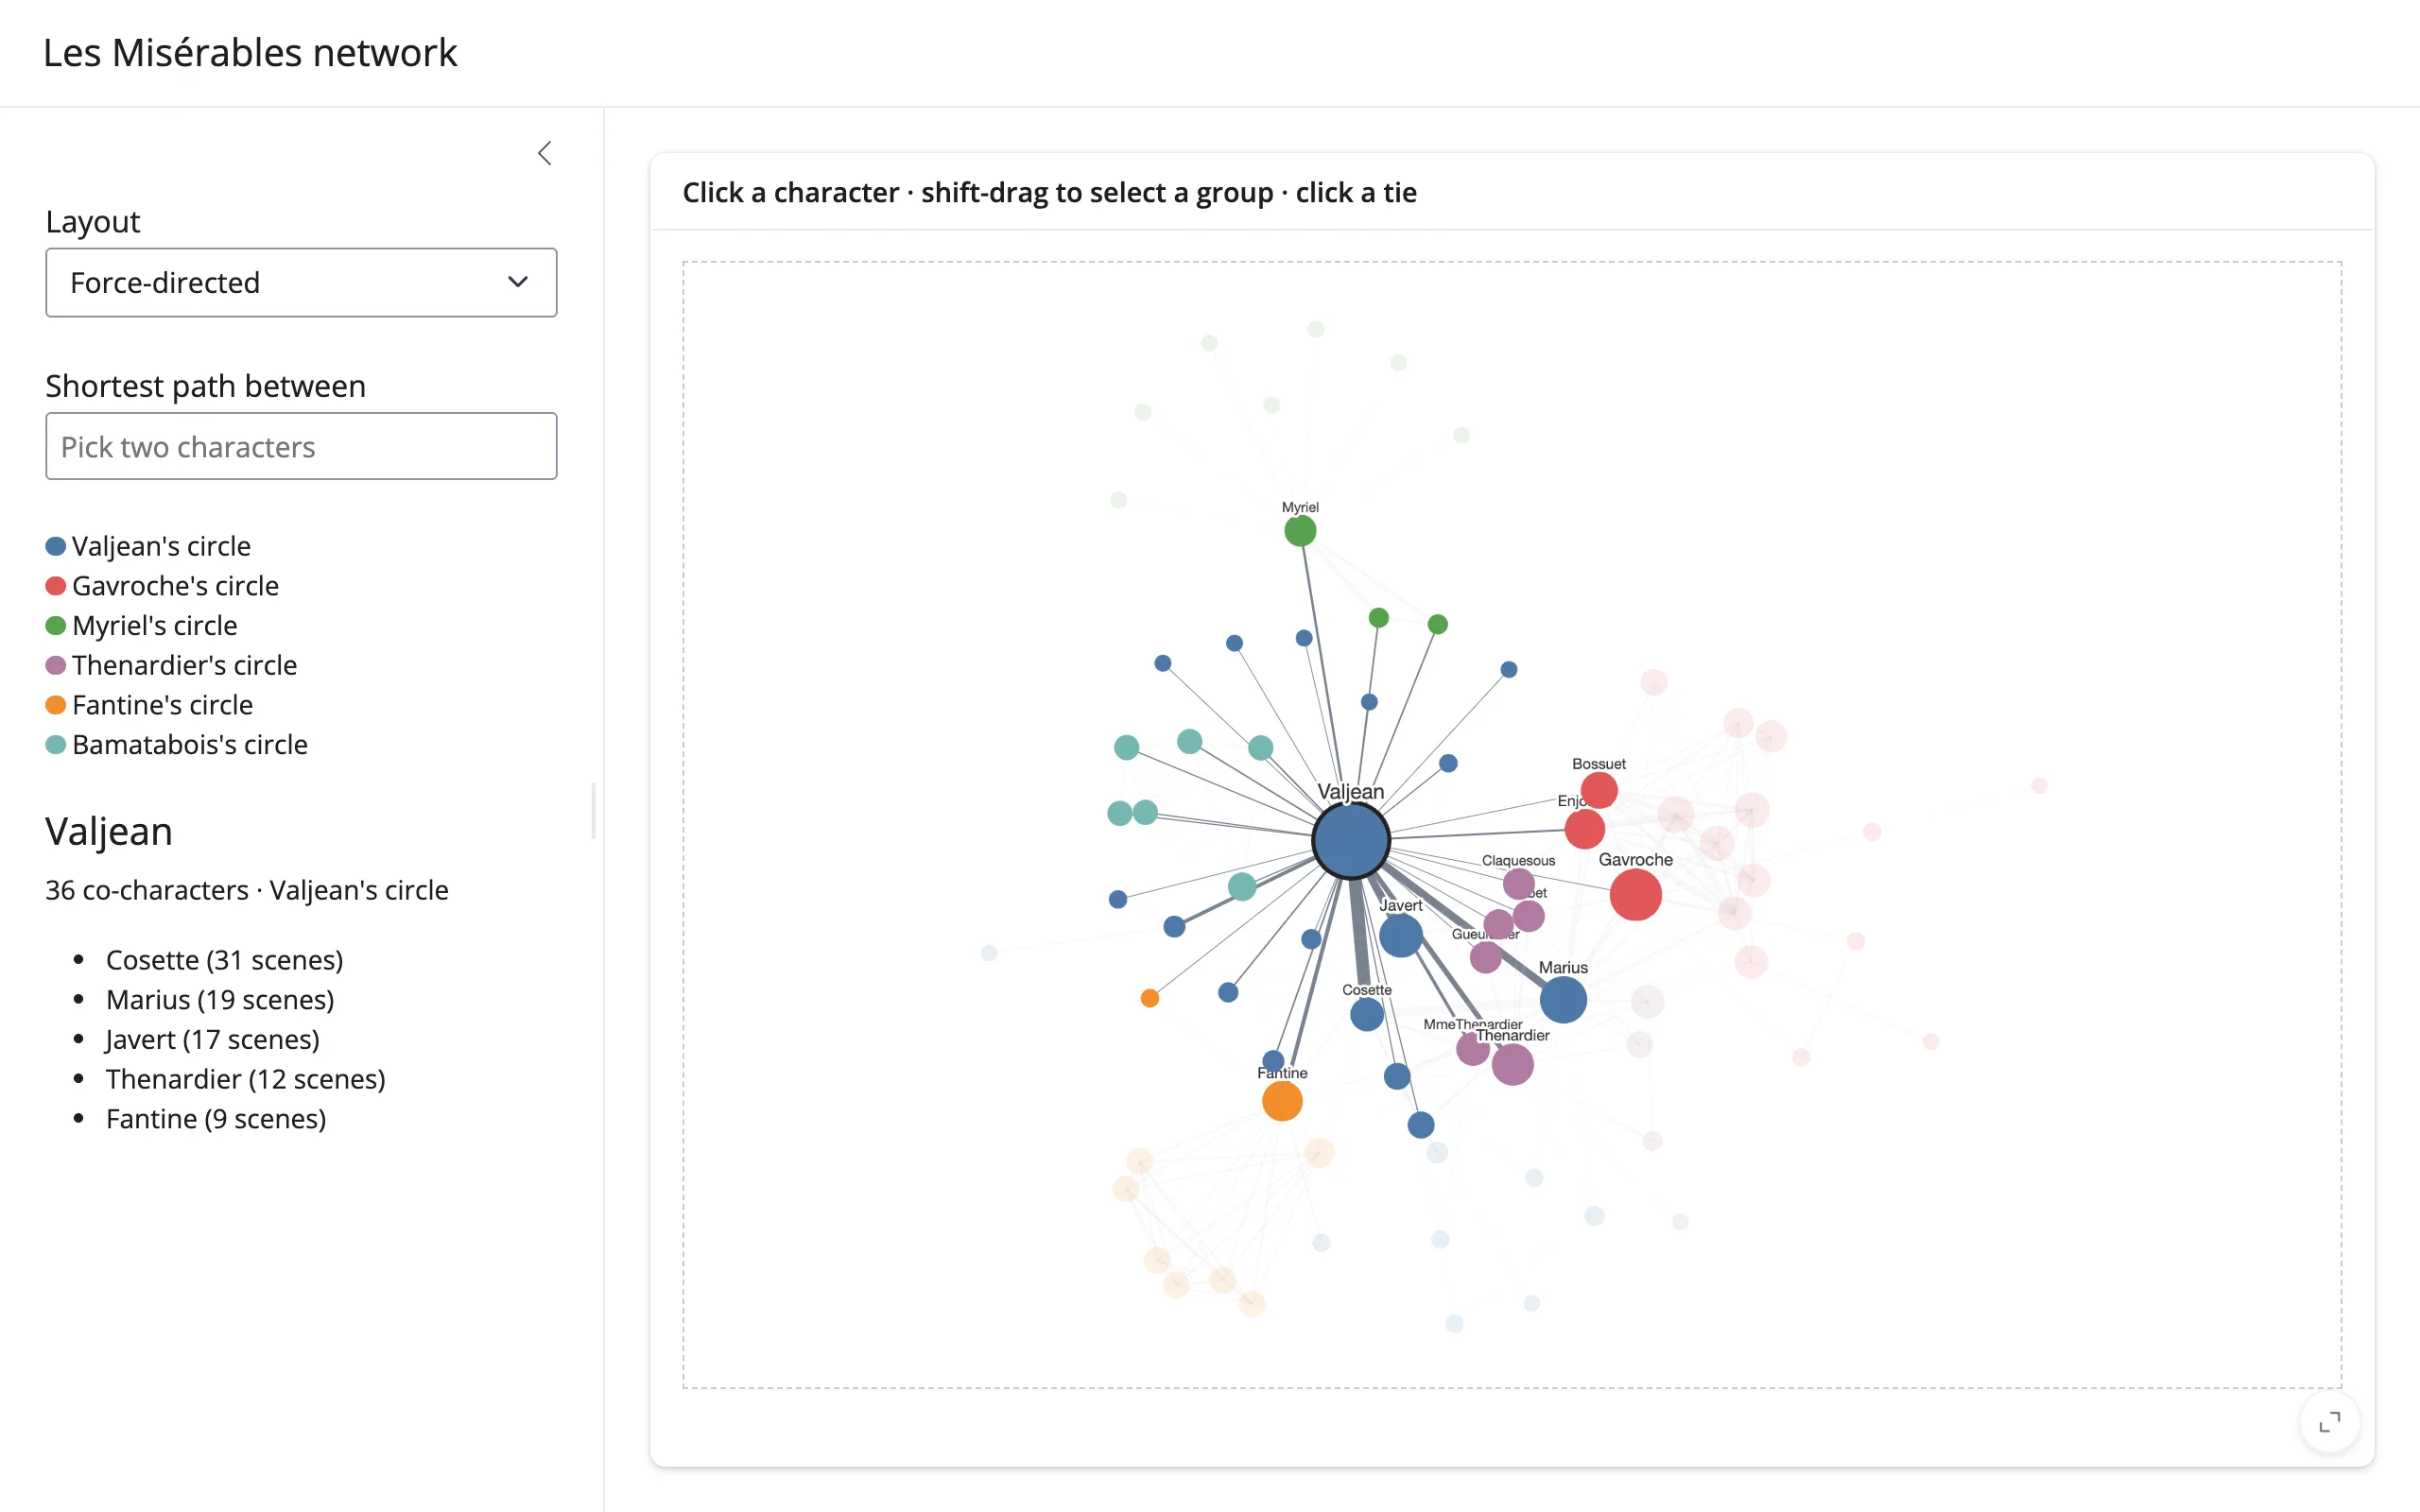
One honest caveat up front: ipycytoscape is lightly maintained upstream (last PyPI release April 2022; see “Gotchas and limitations” below). It is still the most capable interactive-network widget in the Jupyter ecosystem, and everything in this guide is verified against the pinned 1.3.3 release.
Installation
pip install 'shinywidgets[ipycytoscape]'This installs ipycytoscape itself. Building graphs from networkx also needs pip install networkx (not a hard dependency of the extra, since the renderer also accepts a CytoscapeWidget you build yourself from other sources, e.g. Cytoscape JSON or a py2neo graph).
Quick start
import networkx as nx
from shiny.express import ui
from shinywidgets import render_ipycytoscape

ui.page_opts(title="Zachary's karate club", fillable=True)

with ui.card(full_screen=True):

    @render_ipycytoscape
    def network():
        return nx.karate_club_graph()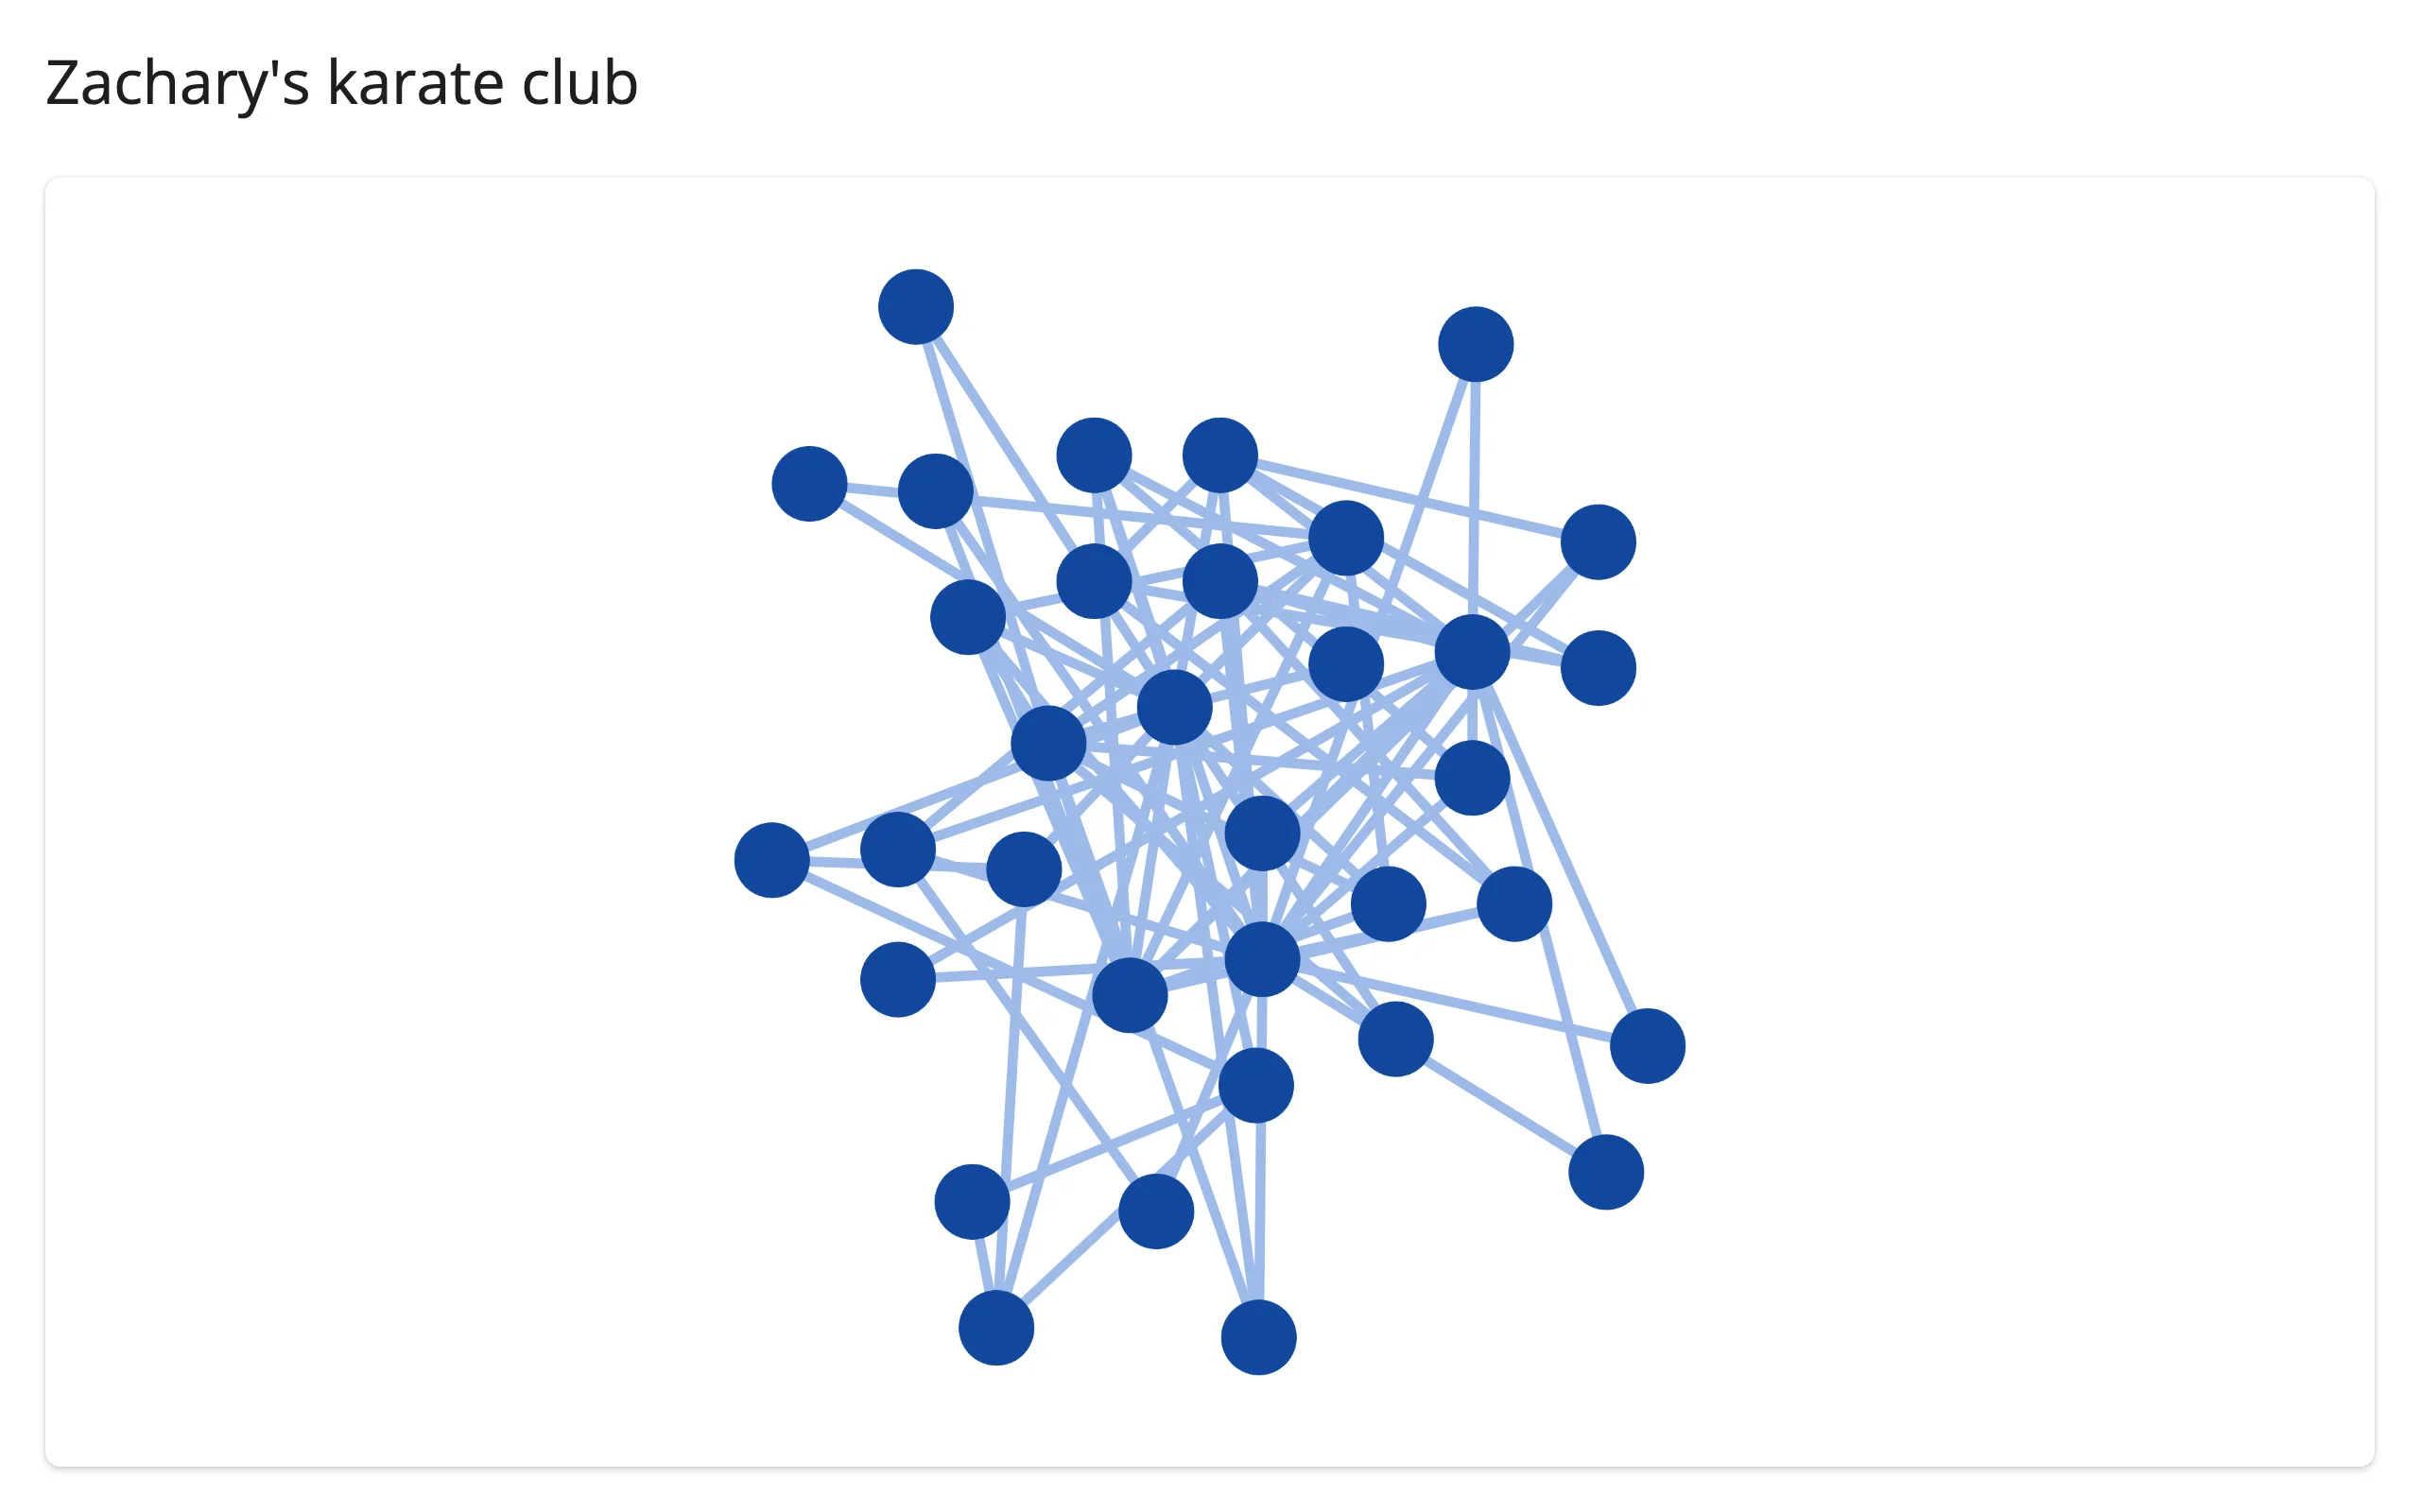
Returning a plain networkx graph is enough for a pannable, zoomable, draggable network: node ids become strings, node and edge attributes land in each element’s data, and DiGraph/MultiGraph get arrows and curved parallel edges automatically. The graph fills its card and tracks resizes, sidebar toggles, and full-screen mode.
What you can build
A stylesheet for your data
Cytoscape’s selector language maps data onto visual properties declaratively: mapData(attr, min, max, loVal, hiVal) scales a numeric attribute into a size or width range, and selectors like node[degree >= 10] or node.focus combine data conditions with manually-toggled classes.
import networkx as nx
from ipycytoscape import CytoscapeWidget
from shiny.express import ui
from shinywidgets import render_ipycytoscape

G = nx.les_miserables_graph()
for n in G.nodes:
    G.nodes[n]["degree"] = G.degree(n)

STYLE = [
    {
        "selector": "node",
        "style": {
            "background-color": "#447099",
            "width": "mapData(degree, 1, 36, 10, 46)",
            "height": "mapData(degree, 1, 36, 10, 46)",
        },
    },
    {
        "selector": "node[degree >= 15]",
        "style": {"label": "data(id)", "font-size": "10px", "color": "#212529"},
    },
    {
        "selector": "edge",
        "style": {
            "width": "mapData(weight, 1, 31, 0.5, 8)",
            "line-color": "#c9d6e8",
            "curve-style": "haystack",
        },
    },
]

ui.page_opts(title="Les Misérables: degree and co-appearance weight", fillable=True)

with ui.card(full_screen=True):

    @render_ipycytoscape
    def network():
        widget = CytoscapeWidget(G)
        widget.set_style(STYLE)
        widget.set_layout(name="cose", idealEdgeLength=80, nodeRepulsion=8000)
        return widget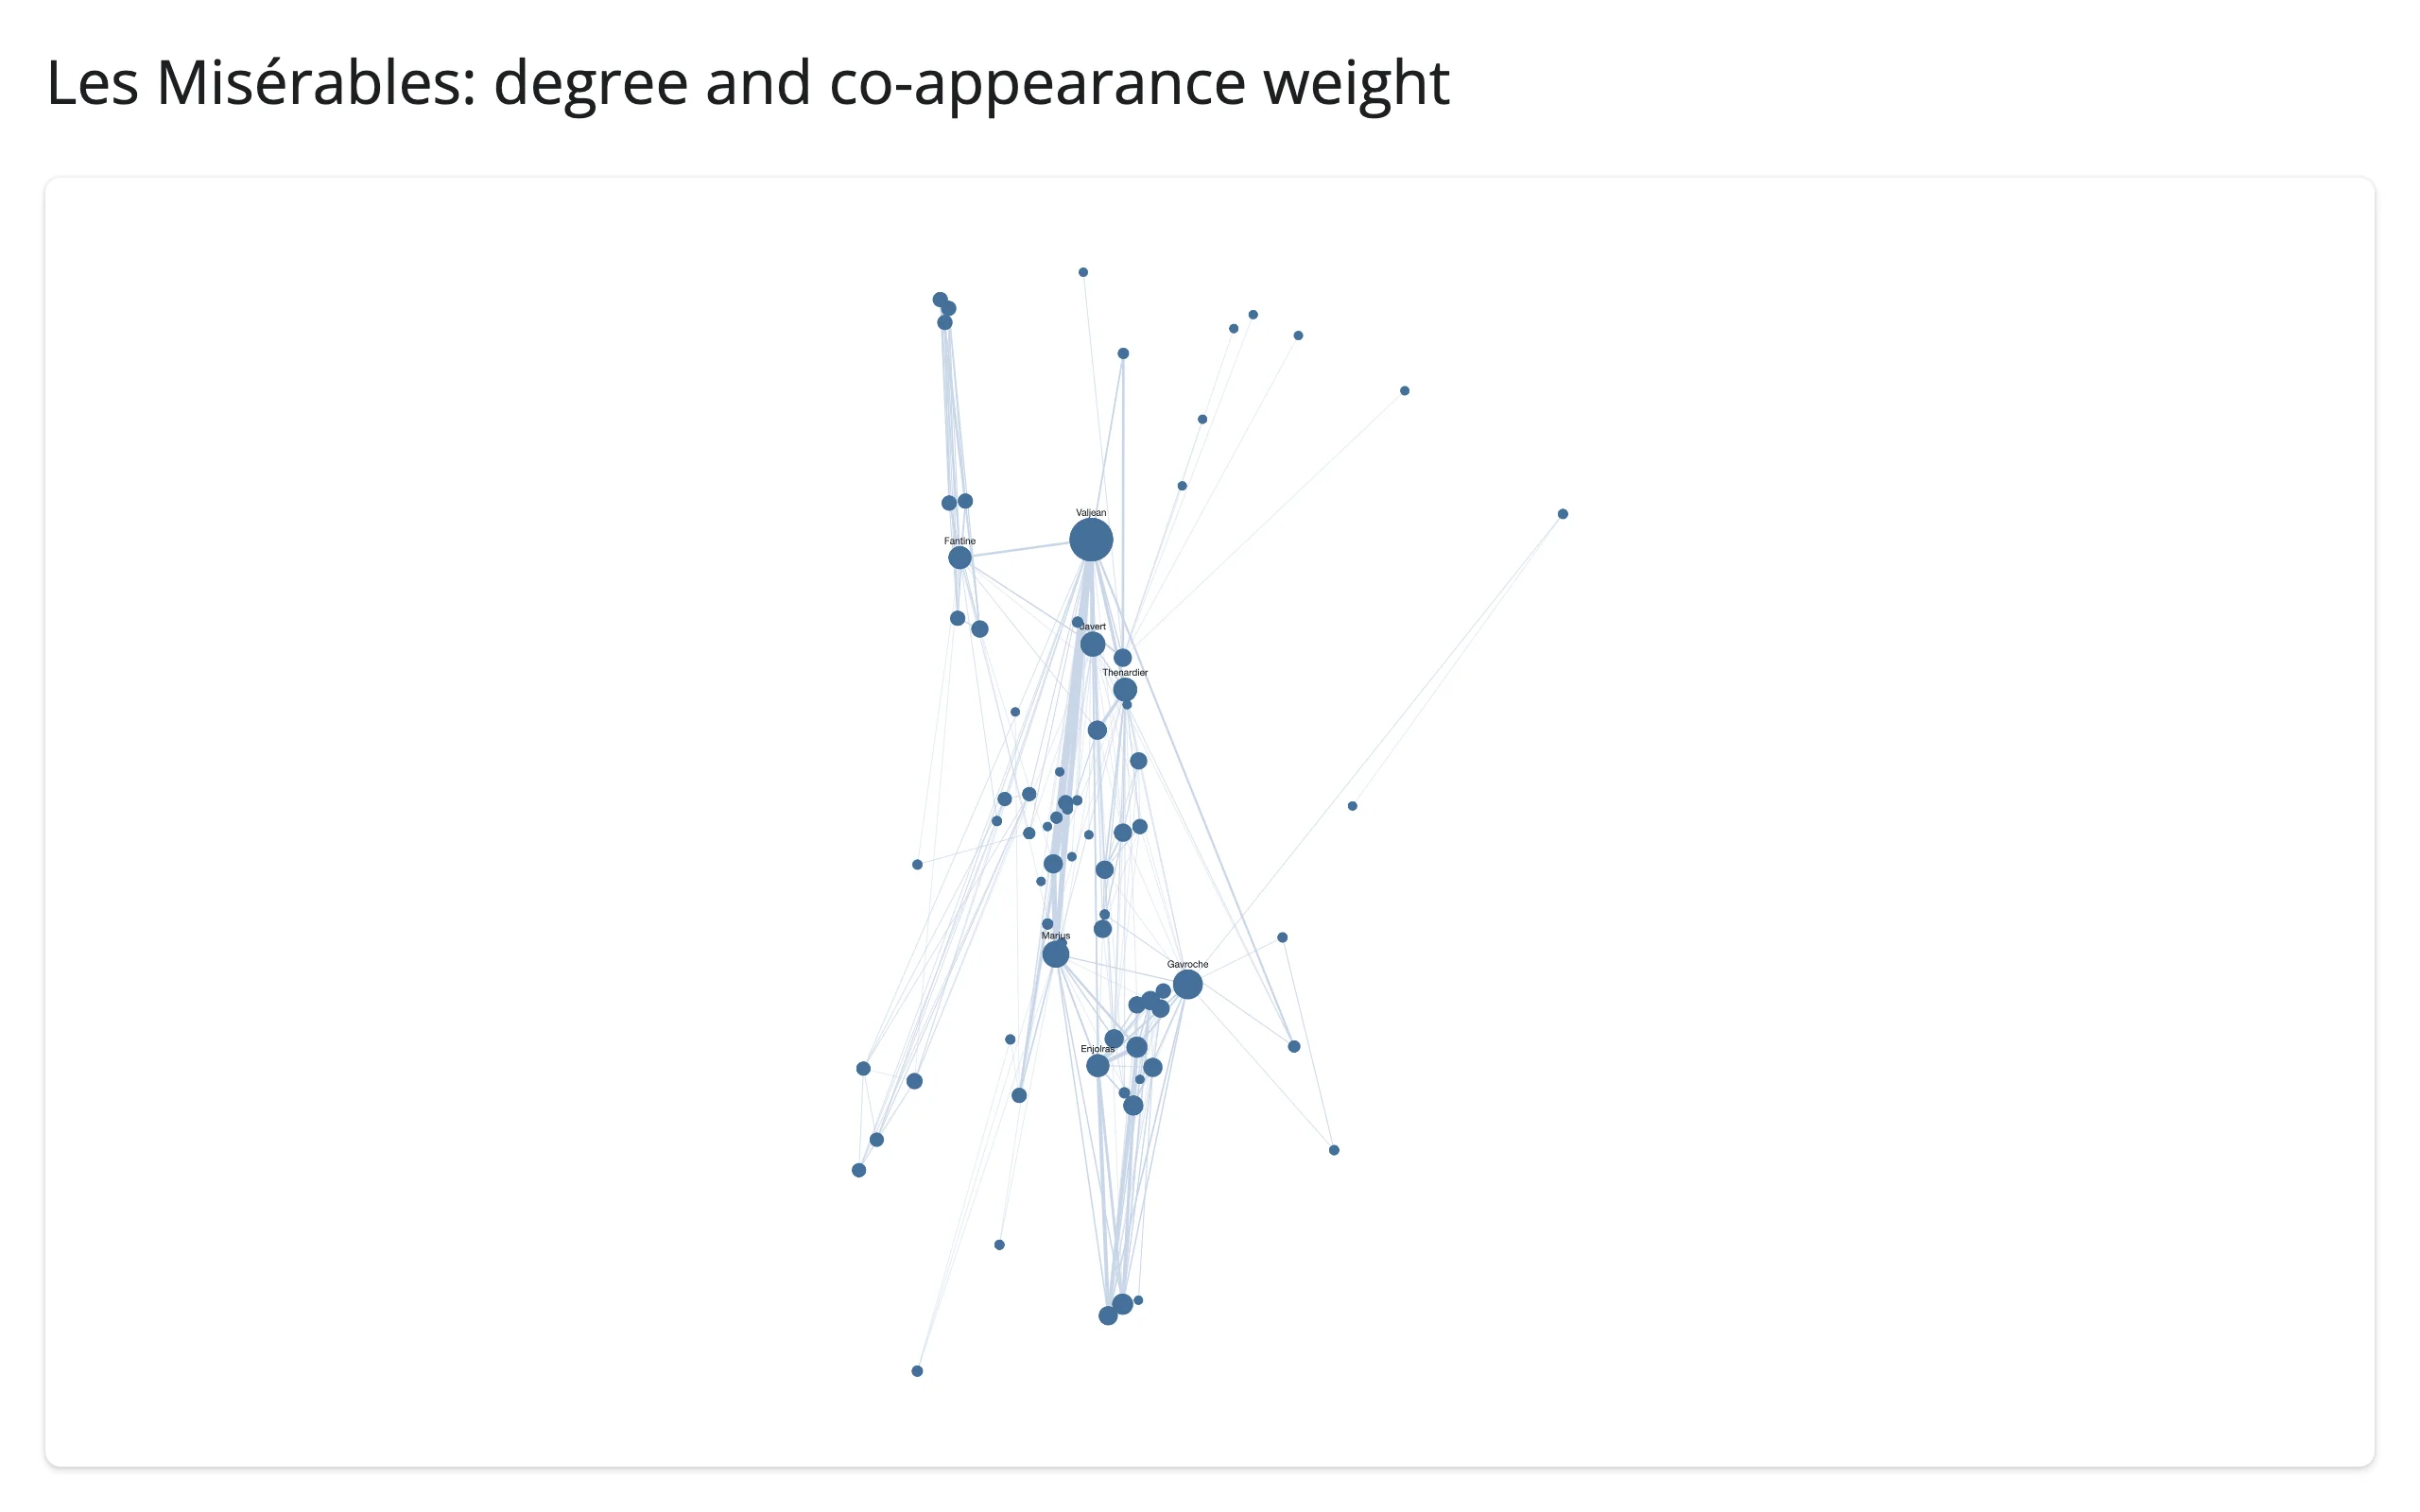
Node and edge attributes computed in Python (here, just G.degree(n), but community membership, centrality, or anything else networkx computes works the same way) flow straight into data(...) and mapData(...). Attributes named classes, position, locked, selected, or selectable are special: they set the element’s own trait instead of landing in data.
Build from a pandas edge list
nx.from_pandas_edgelist() turns a two-column (or weighted) data frame into a graph, which the renderer accepts exactly like any other networkx graph.
import networkx as nx
import pandas as pd
from ipycytoscape import CytoscapeWidget
from shiny.express import ui
from shinywidgets import render_ipycytoscape

edges = pd.DataFrame(
    {
        "source": [
            "shinywidgets",
            "shinywidgets",
            "shiny",
            "shiny",
            "shiny",
            "pandas",
            "ipywidgets",
            "ipywidgets",
        ],
        "target": [
            "shiny",
            "ipywidgets",
            "starlette",
            "uvicorn",
            "htmltools",
            "numpy",
            "traitlets",
            "ipython",
        ],
    }
)
G = nx.from_pandas_edgelist(edges, create_using=nx.DiGraph)

STYLE = [
    {"selector": "node", "style": {"label": "data(id)", "background-color": "#447099"}},
    {
        "selector": "edge",
        "style": {
            "curve-style": "bezier",
            "target-arrow-shape": "triangle",
            "target-arrow-color": "#9dbaea",
            "line-color": "#9dbaea",
        },
    },
]

ui.page_opts(title="A dependency graph from a pandas edge list", fillable=True)

with ui.card(full_screen=True):

    @render_ipycytoscape
    def network():
        widget = CytoscapeWidget(G)
        widget.set_style(STYLE)
        widget.set_layout(name="breadthfirst", directed=True, padding=20)
        return widget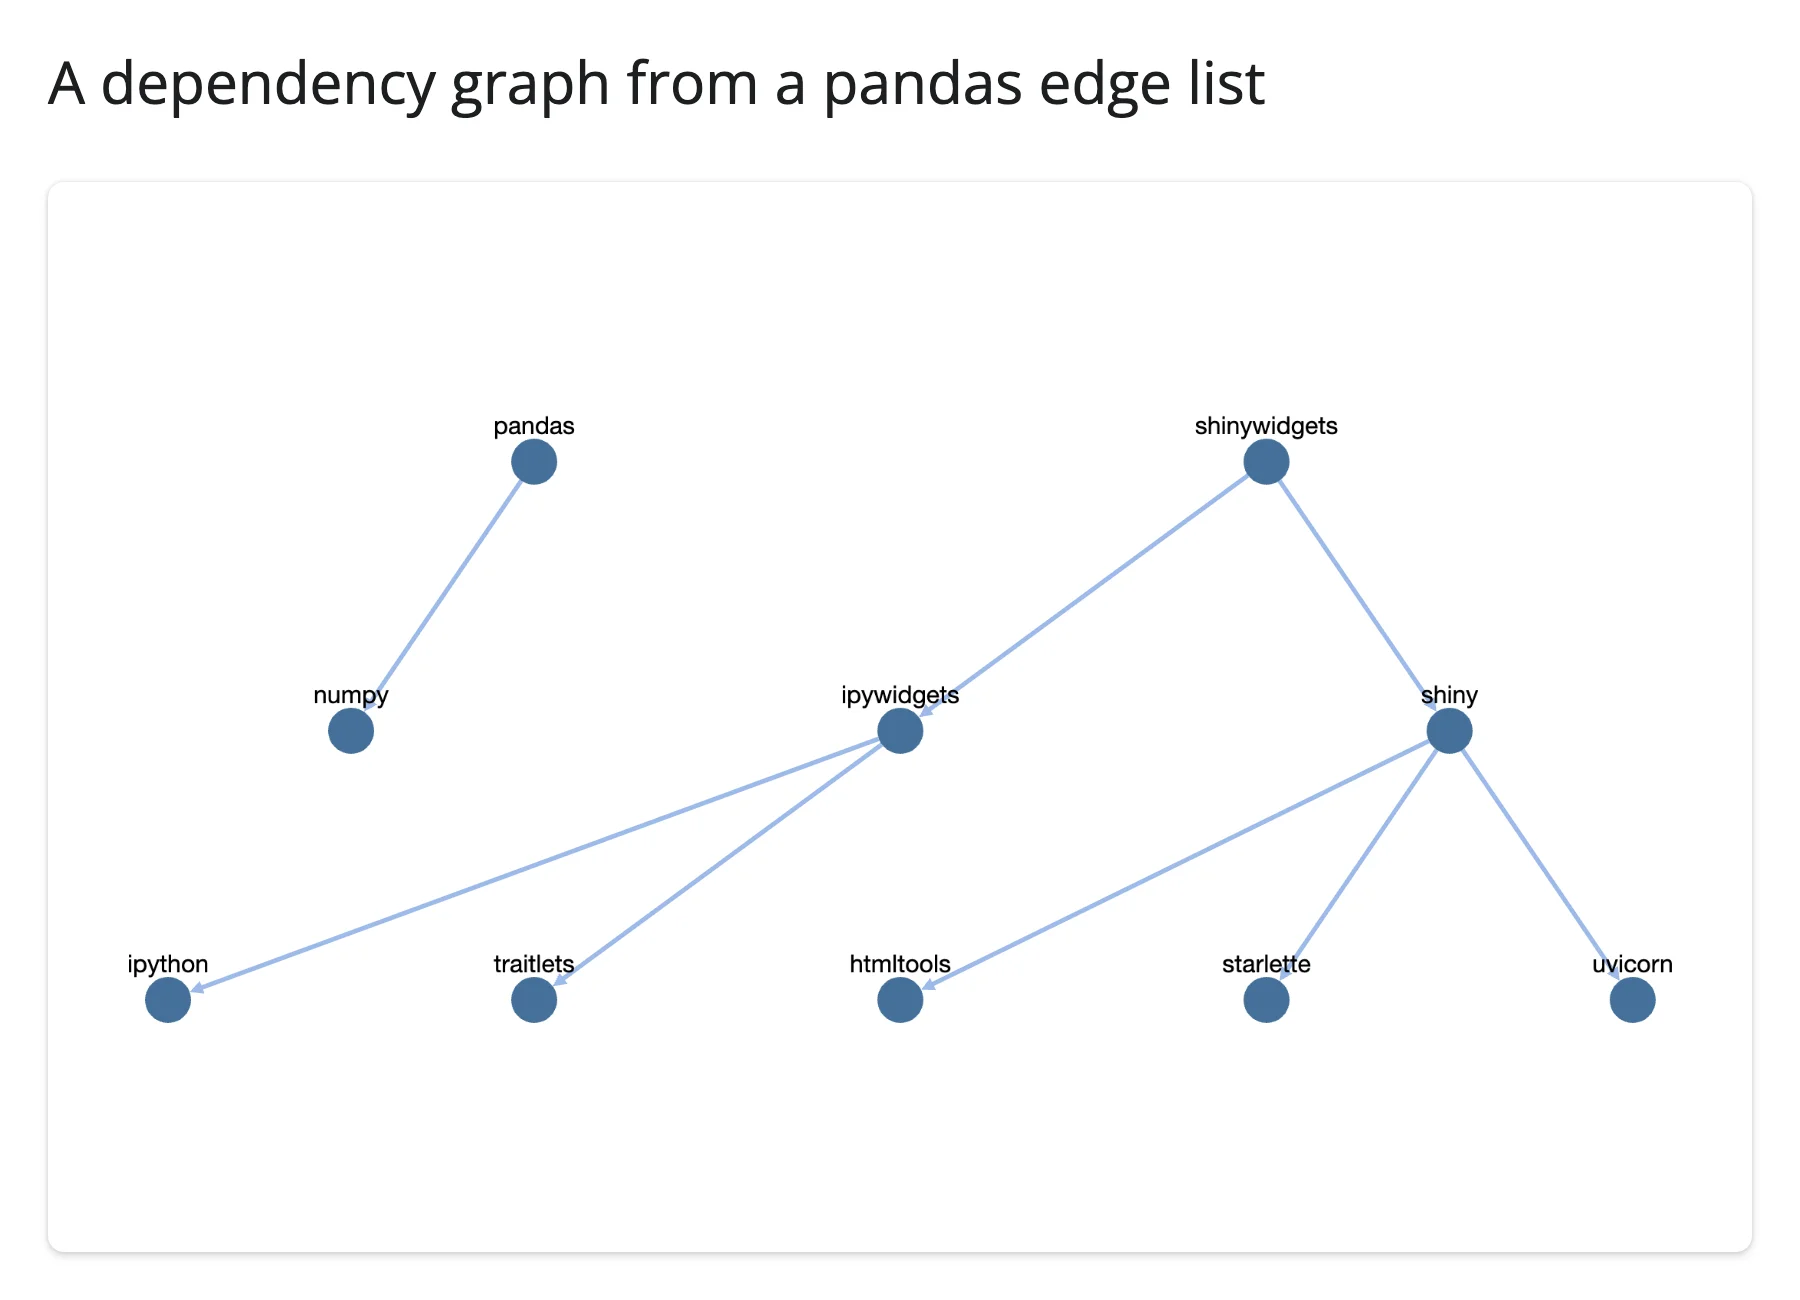
ipycytoscape also accepts Cytoscape JSON (a dict or path) and pandas data frames directly via CytoscapeWidget(json_or_df) or widget.graph.add_graph_from_json(...)/add_graph_from_df(...); the renderer itself only auto-coerces networkx graphs, so wrap other formats yourself before returning them.
A layout for every shape
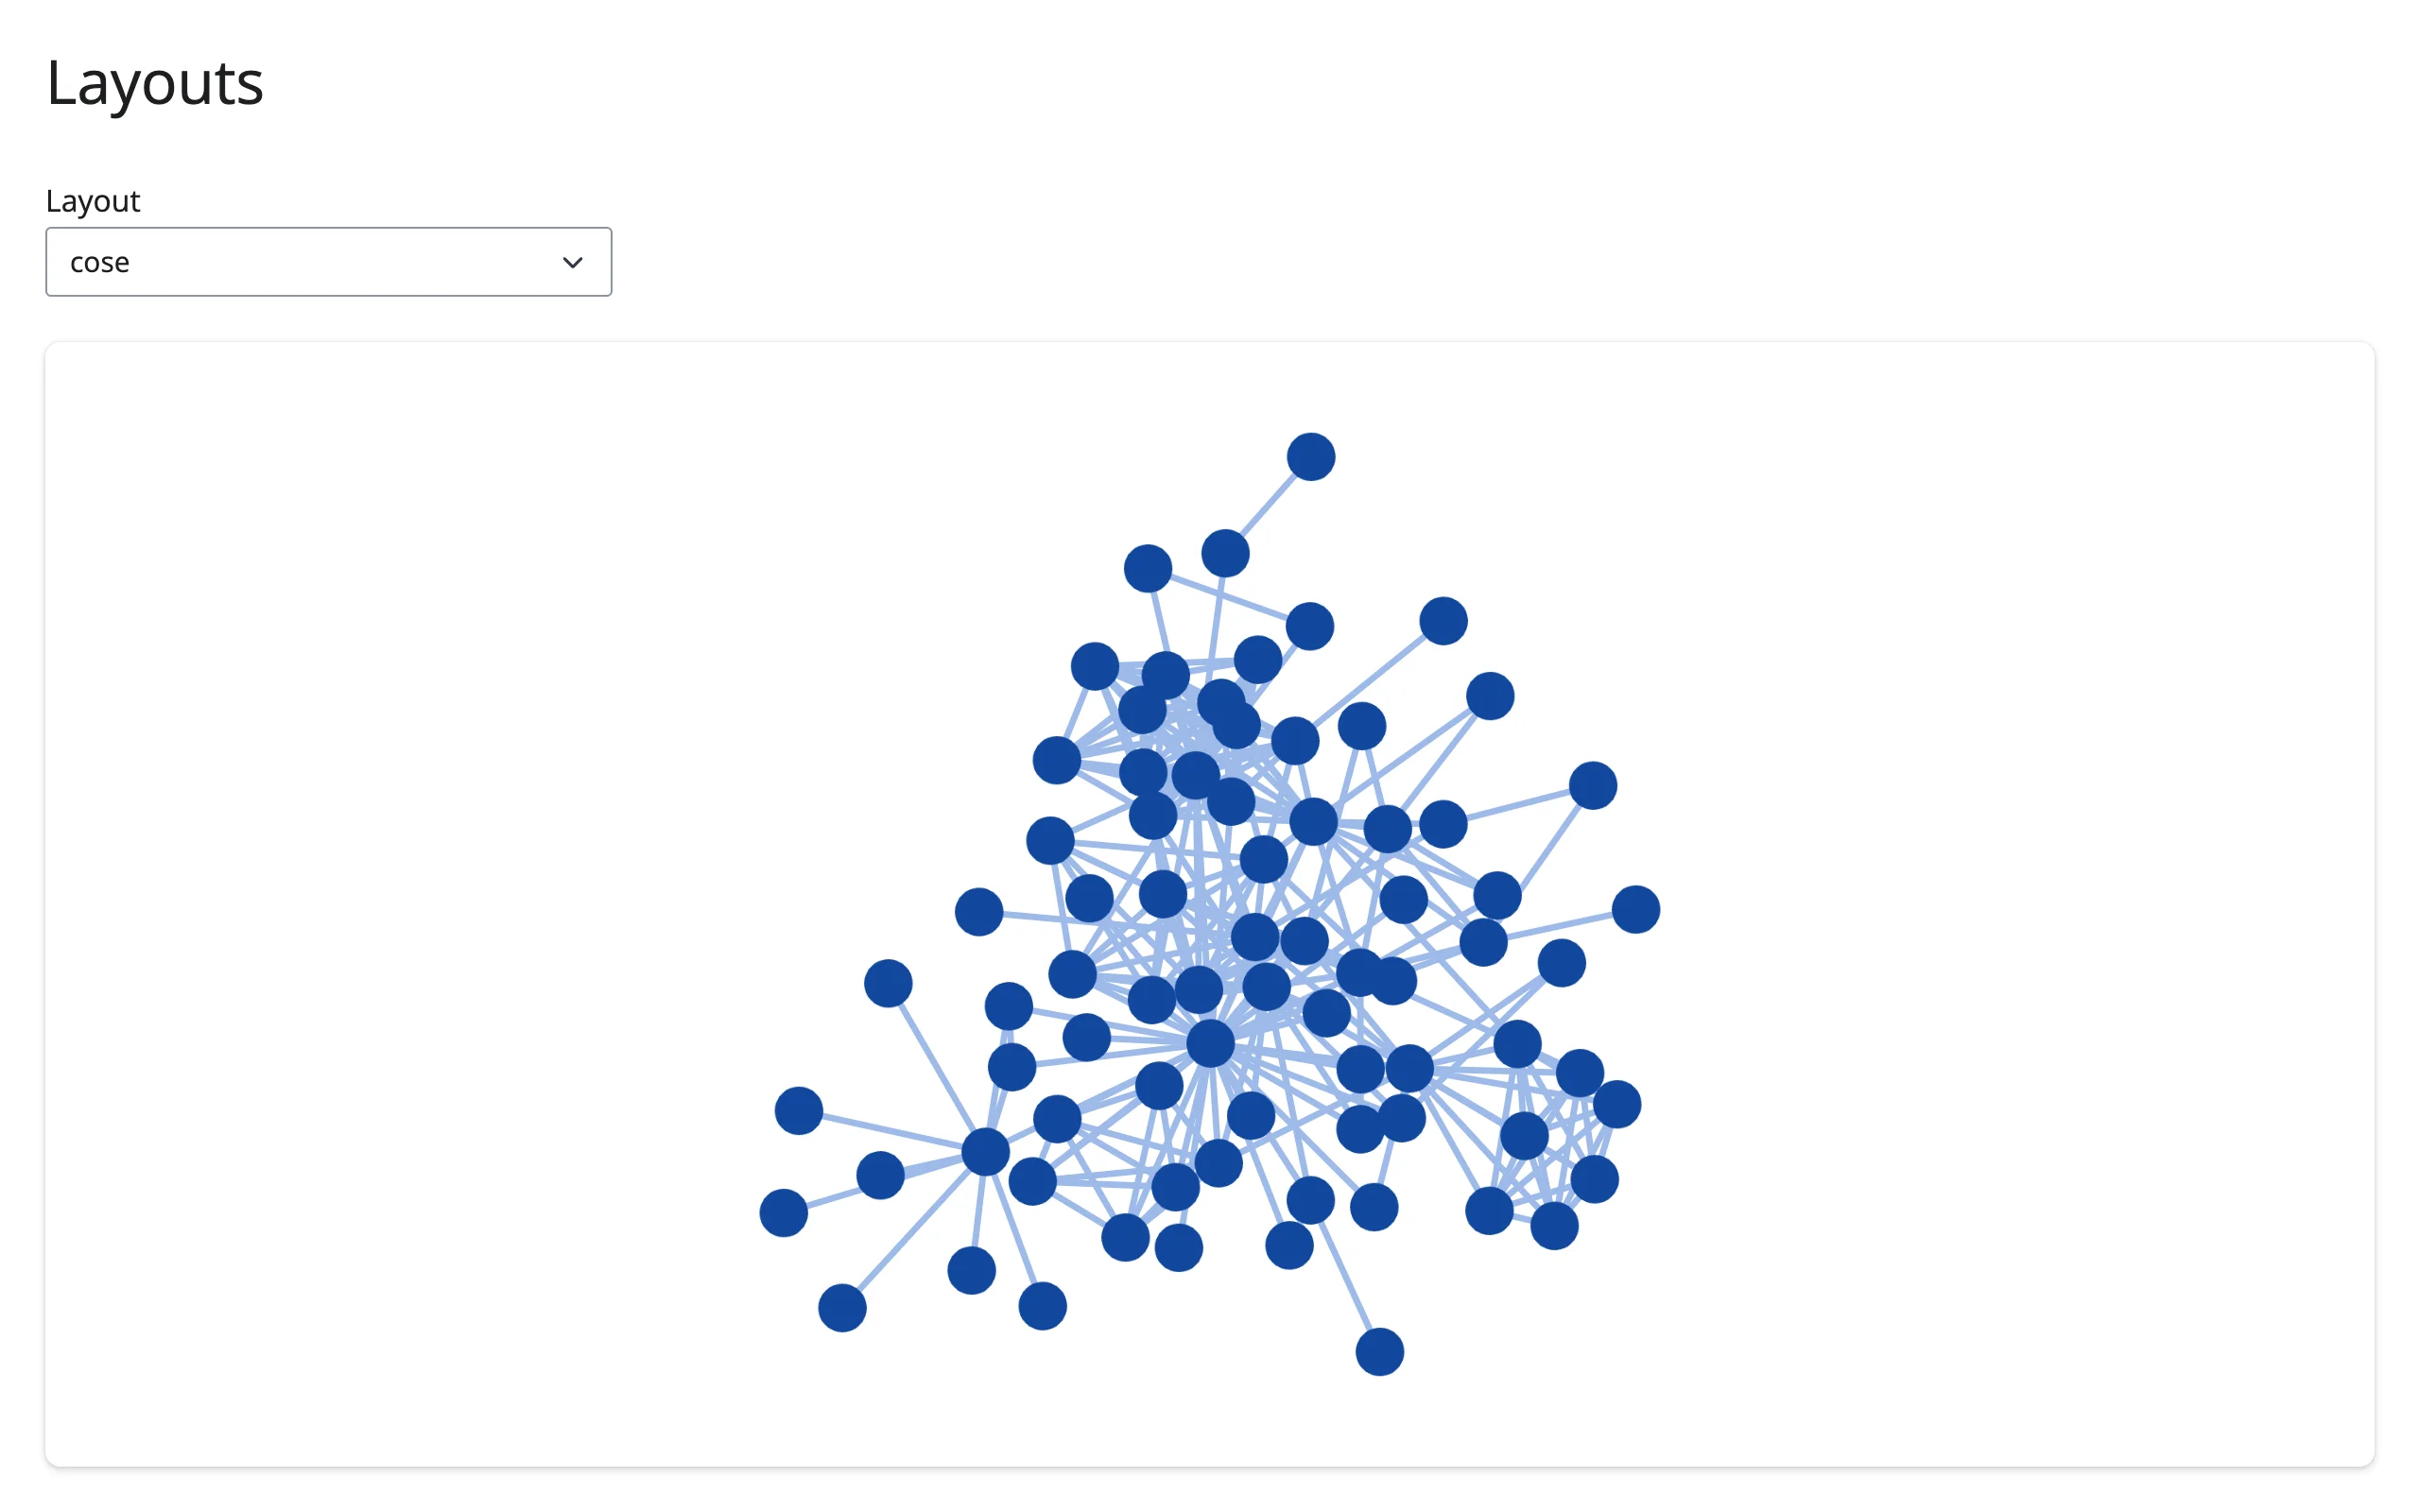
Cytoscape ships force-directed (cose), radial (concentric, circle), and hierarchical (breadthfirst) layouts in its core, and ipycytoscape bundles the cola, dagre, and klay extensions on top. Switch layouts in place with widget.set_layout(name=...).
import networkx as nx
from ipycytoscape import CytoscapeWidget
from shiny import reactive
from shiny.express import input, ui
from shinywidgets import render_ipycytoscape

G = nx.les_miserables_graph()
LAYOUTS = ["cose", "concentric", "breadthfirst", "dagre"]

ui.page_opts(title="Layouts", fillable=True)
ui.input_select("layout", "Layout", LAYOUTS)

with ui.card(full_screen=True):

    @render_ipycytoscape
    def network():
        widget = CytoscapeWidget(G)
        with reactive.isolate():
            widget.set_layout(name=input.layout())
        return widget

    @reactive.effect
    def _():
        # Re-run the chosen layout in place; the graph is never re-rendered
        network.widget.set_layout(name=input.layout())
cose (force-directed) |
dagre (hierarchical) |
|---|---|
 |
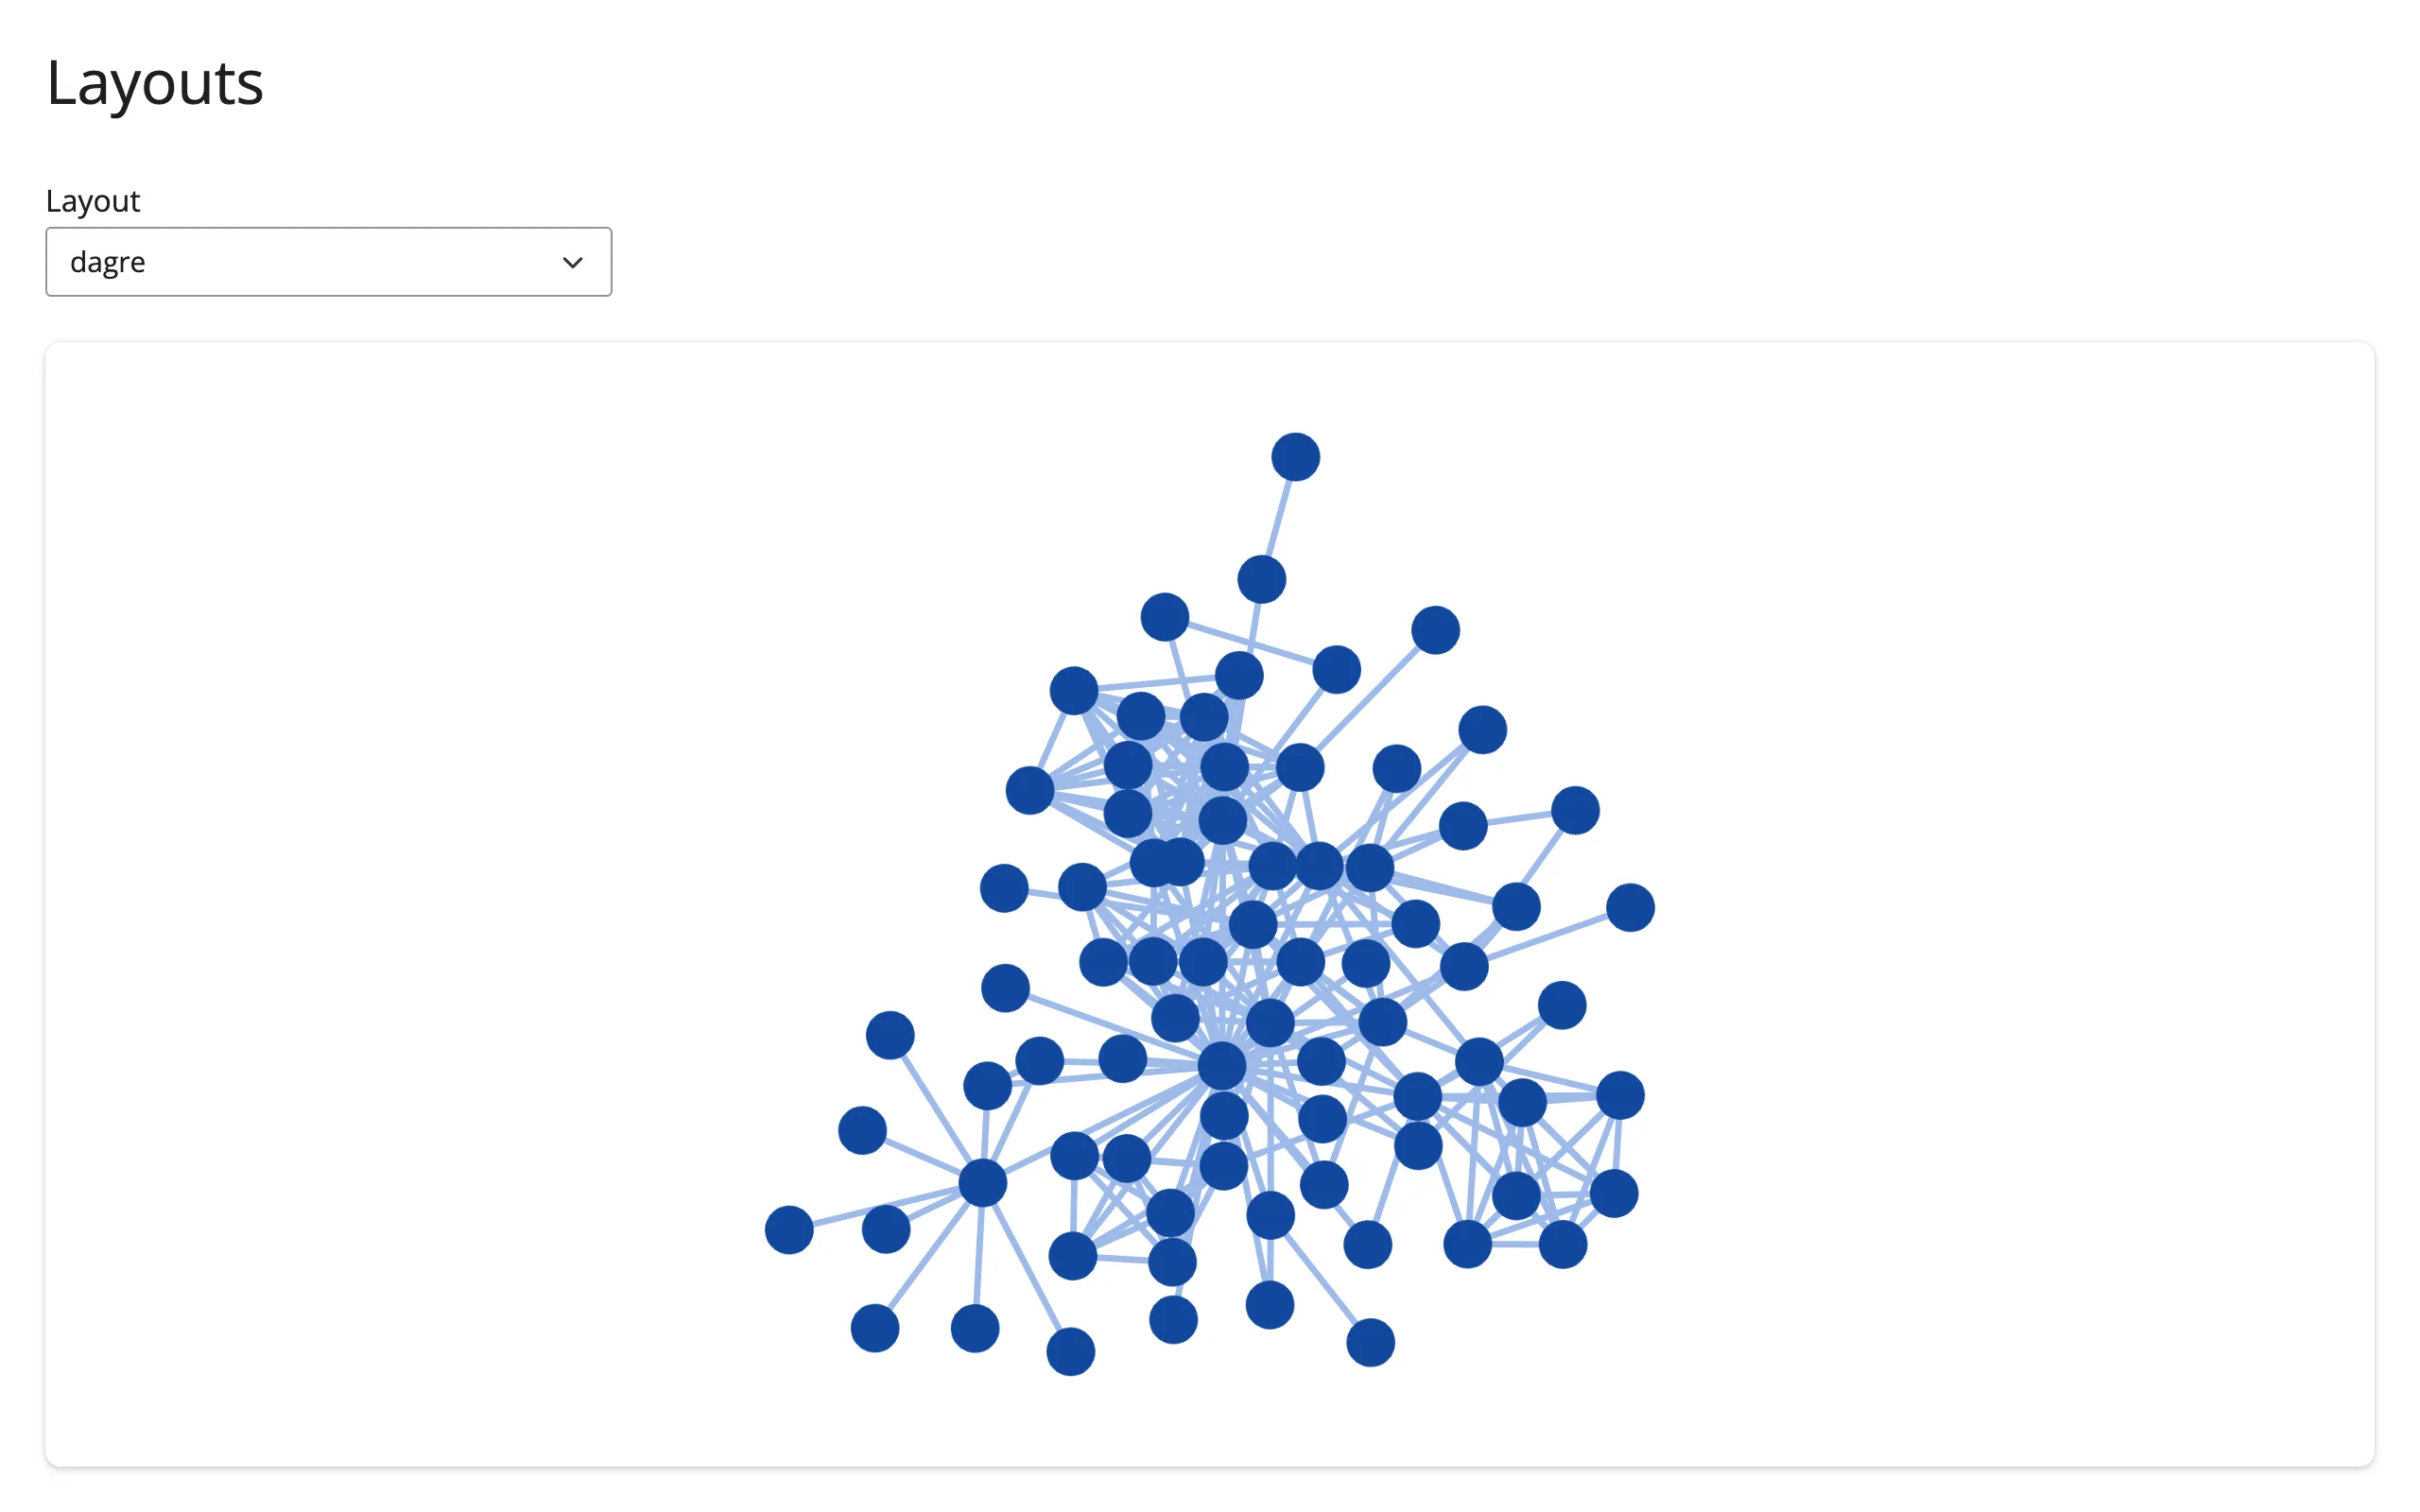 |
set_layout() merges its keyword arguments onto the existing layout dict rather than replacing it, so switching name keeps any spacing options you’ve already set. Every layout change re-fits the viewport to the new arrangement and re-runs on the whole graph (there’s no incremental layout), which is fine for the graph sizes this widget is meant for.
Tooltips
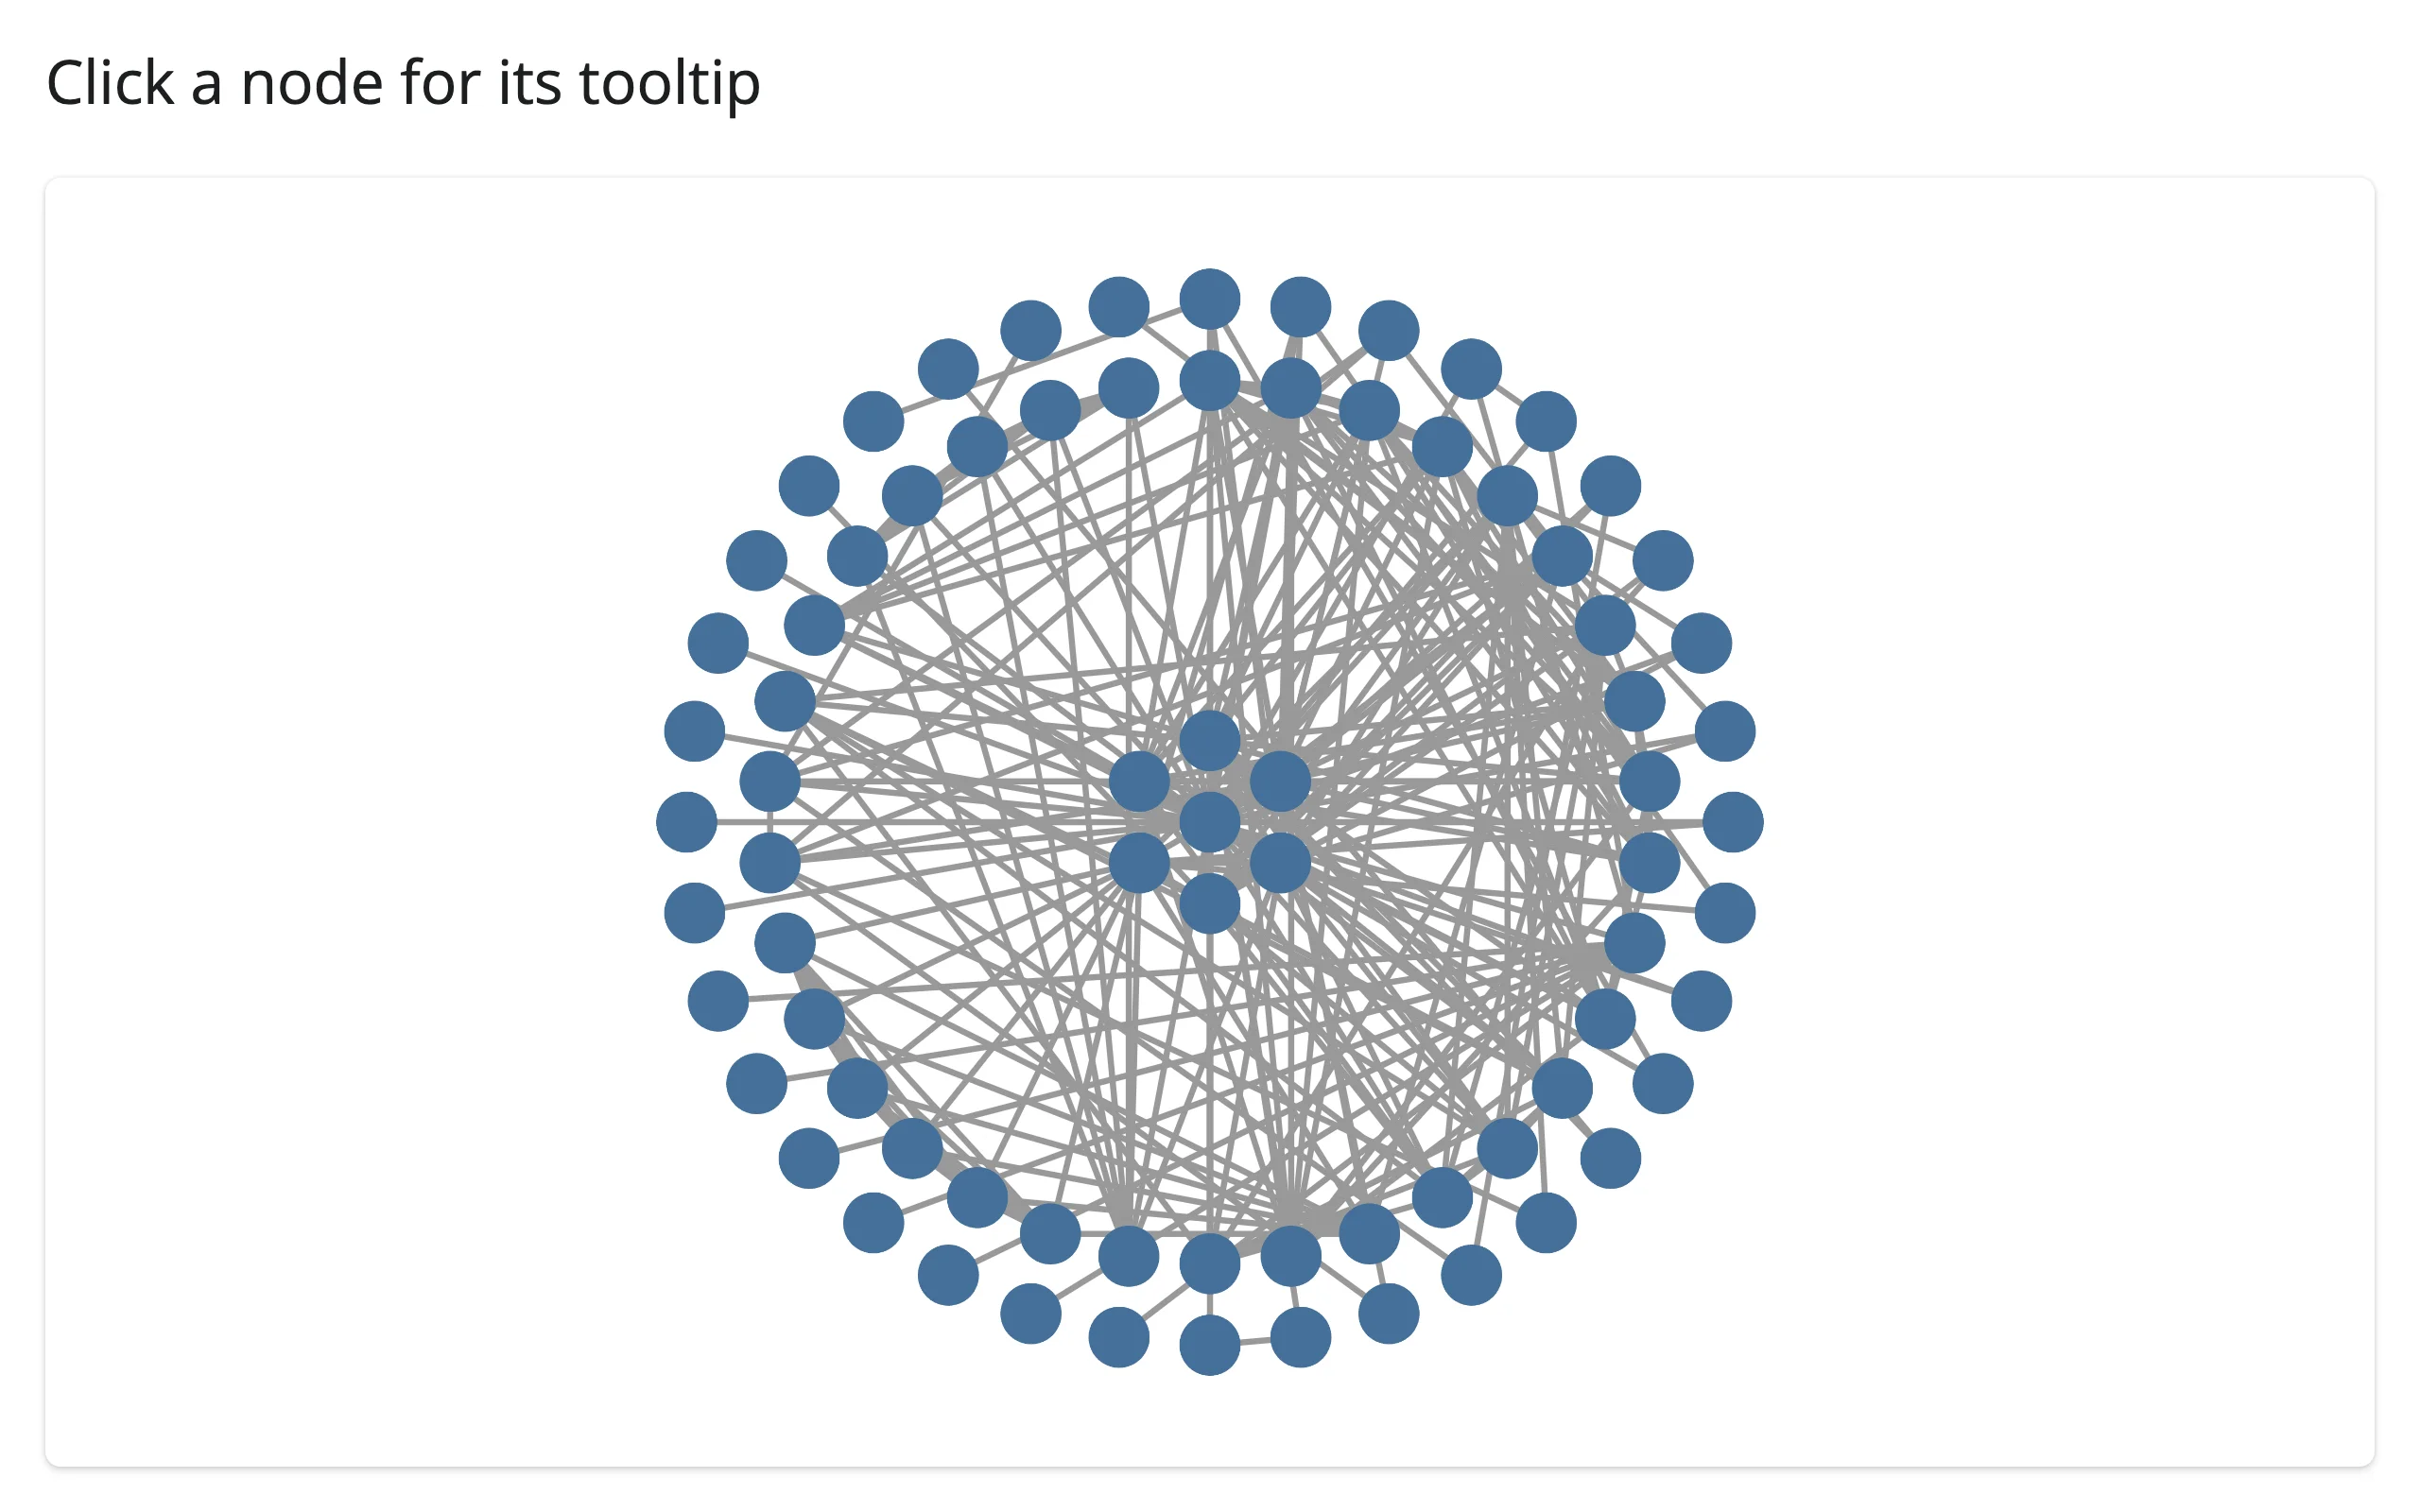
Put text in a node’s data["tooltip"] (or point set_tooltip_source() at a different key) and ipycytoscape shows it in a popup on click.
import networkx as nx
from ipycytoscape import CytoscapeWidget
from shiny.express import ui
from shinywidgets import render_ipycytoscape

G = nx.les_miserables_graph()
for n in G.nodes:
    scenes = sorted(G[n].items(), key=lambda kv: -kv[1]["weight"])[:3]
    top = ", ".join(f"{m} ({d['weight']})" for m, d in scenes)
    G.nodes[n]["tooltip"] = f"{n}\nTop co-stars: {top}"

STYLE = [{"selector": "node", "style": {"background-color": "#447099"}}]

ui.page_opts(title="Click a node for its tooltip", fillable=True)

with ui.card(full_screen=True):

    @render_ipycytoscape
    def network():
        widget = CytoscapeWidget(G)
        widget.set_style(STYLE)
        widget.set_layout(name="concentric")
return widget| Before | After clicking Valjean |
|---|---|
 |
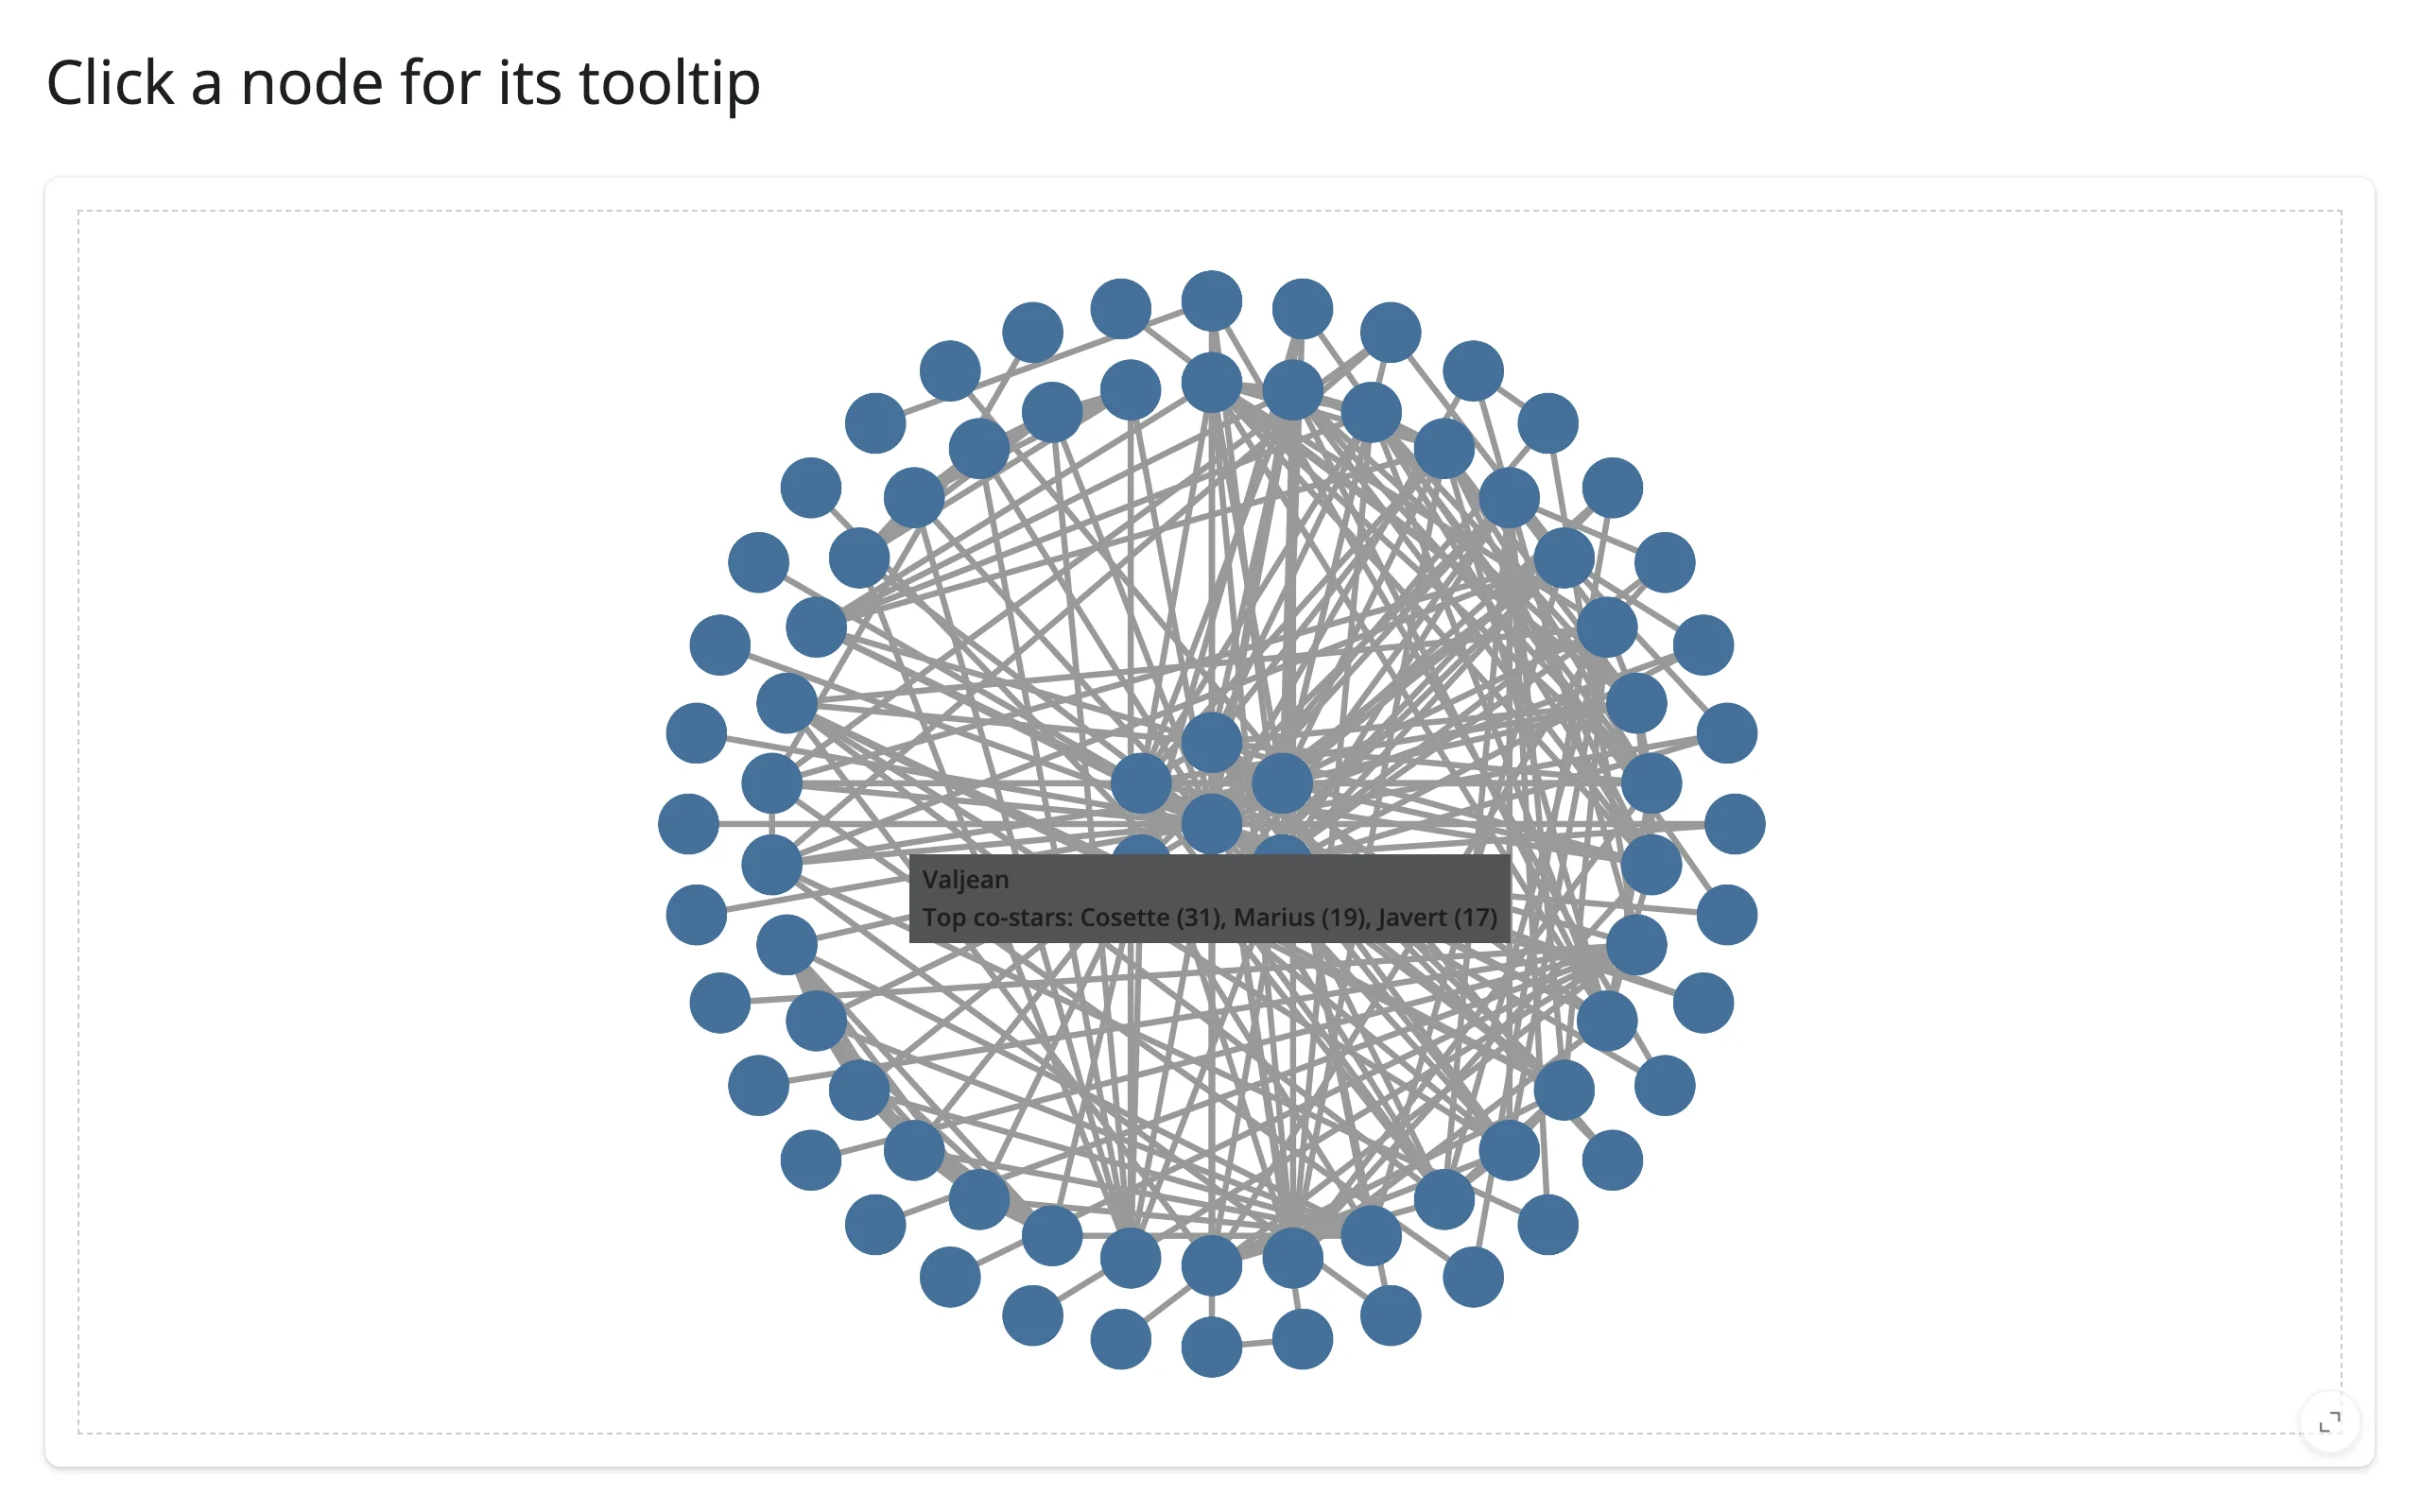 |
Newlines in the tooltip text become <br>. The tooltip toggles on each click of the same node and hides on the next click.
Reacting to user interaction
Accessor reference
| accessor | returns | before any interaction | across re-render | default rate policy |
|---|---|---|---|---|
clicked_node() |
the clicked node’s cytoscape ele.json() dict (["data"] holds its data, including "id") |
None |
kept | none |
clicked_edge() |
the clicked edge’s ele.json() dict (["data"] has "id", "source", "target") |
None |
kept | none |
selected_nodes() |
the selected nodes’ data dicts, in graph order |
[] |
re-seeded | debounce (0.25s) |
selected_edges() |
the selected edges’ data dicts, in graph order |
[] |
re-seeded | debounce (0.25s) |
All four attach the moment the graph renders, so an interaction is never lost to timing – there’s no warm-up step and no “first read” gotcha. clicked_node()/clicked_edge() are click events: they return None until the first matching click, and then keep that payload across a re-render until the user clicks the new graph (the click still happened, though the payload then refers to the previous render’s graph – node ids from networkx are always strings, but edge ids are fresh UUIDs every render, so don’t persist a retained edge id across renders). selected_nodes()/selected_edges() instead re-seed from the new graph on every render, so they always describe what’s currently selected – [] right after a render unless you pre-select nodes in the render function. Wrap a dependent read in req(...) when you want to wait for the first click; the selection accessors need no req() since [] is already a valid, checkable “nothing selected” value.
All four are eager: shinywidgets registers their handlers (CytoscapeWidget.on() for clicks, Node/Edge.observe() for selection) while the widget is being constructed, before the view reaches the browser. This matters because of an upstream quirk (verified on ipycytoscape 1.3.3): the frontend only wires up new event types the first time it sees them per element type, so a handler registered later – for example, from inside a @reactive.effect instead of at render time – can be silently dropped. If you register your own widget.on(...) callbacks for other event types (mouseover, tap, etc.), do it inside the render function before returning the widget, the same way the built-in accessors do. Each accessor can also be read by name, network.read("clicked_node"), which is useful for code that reads accessors generically.
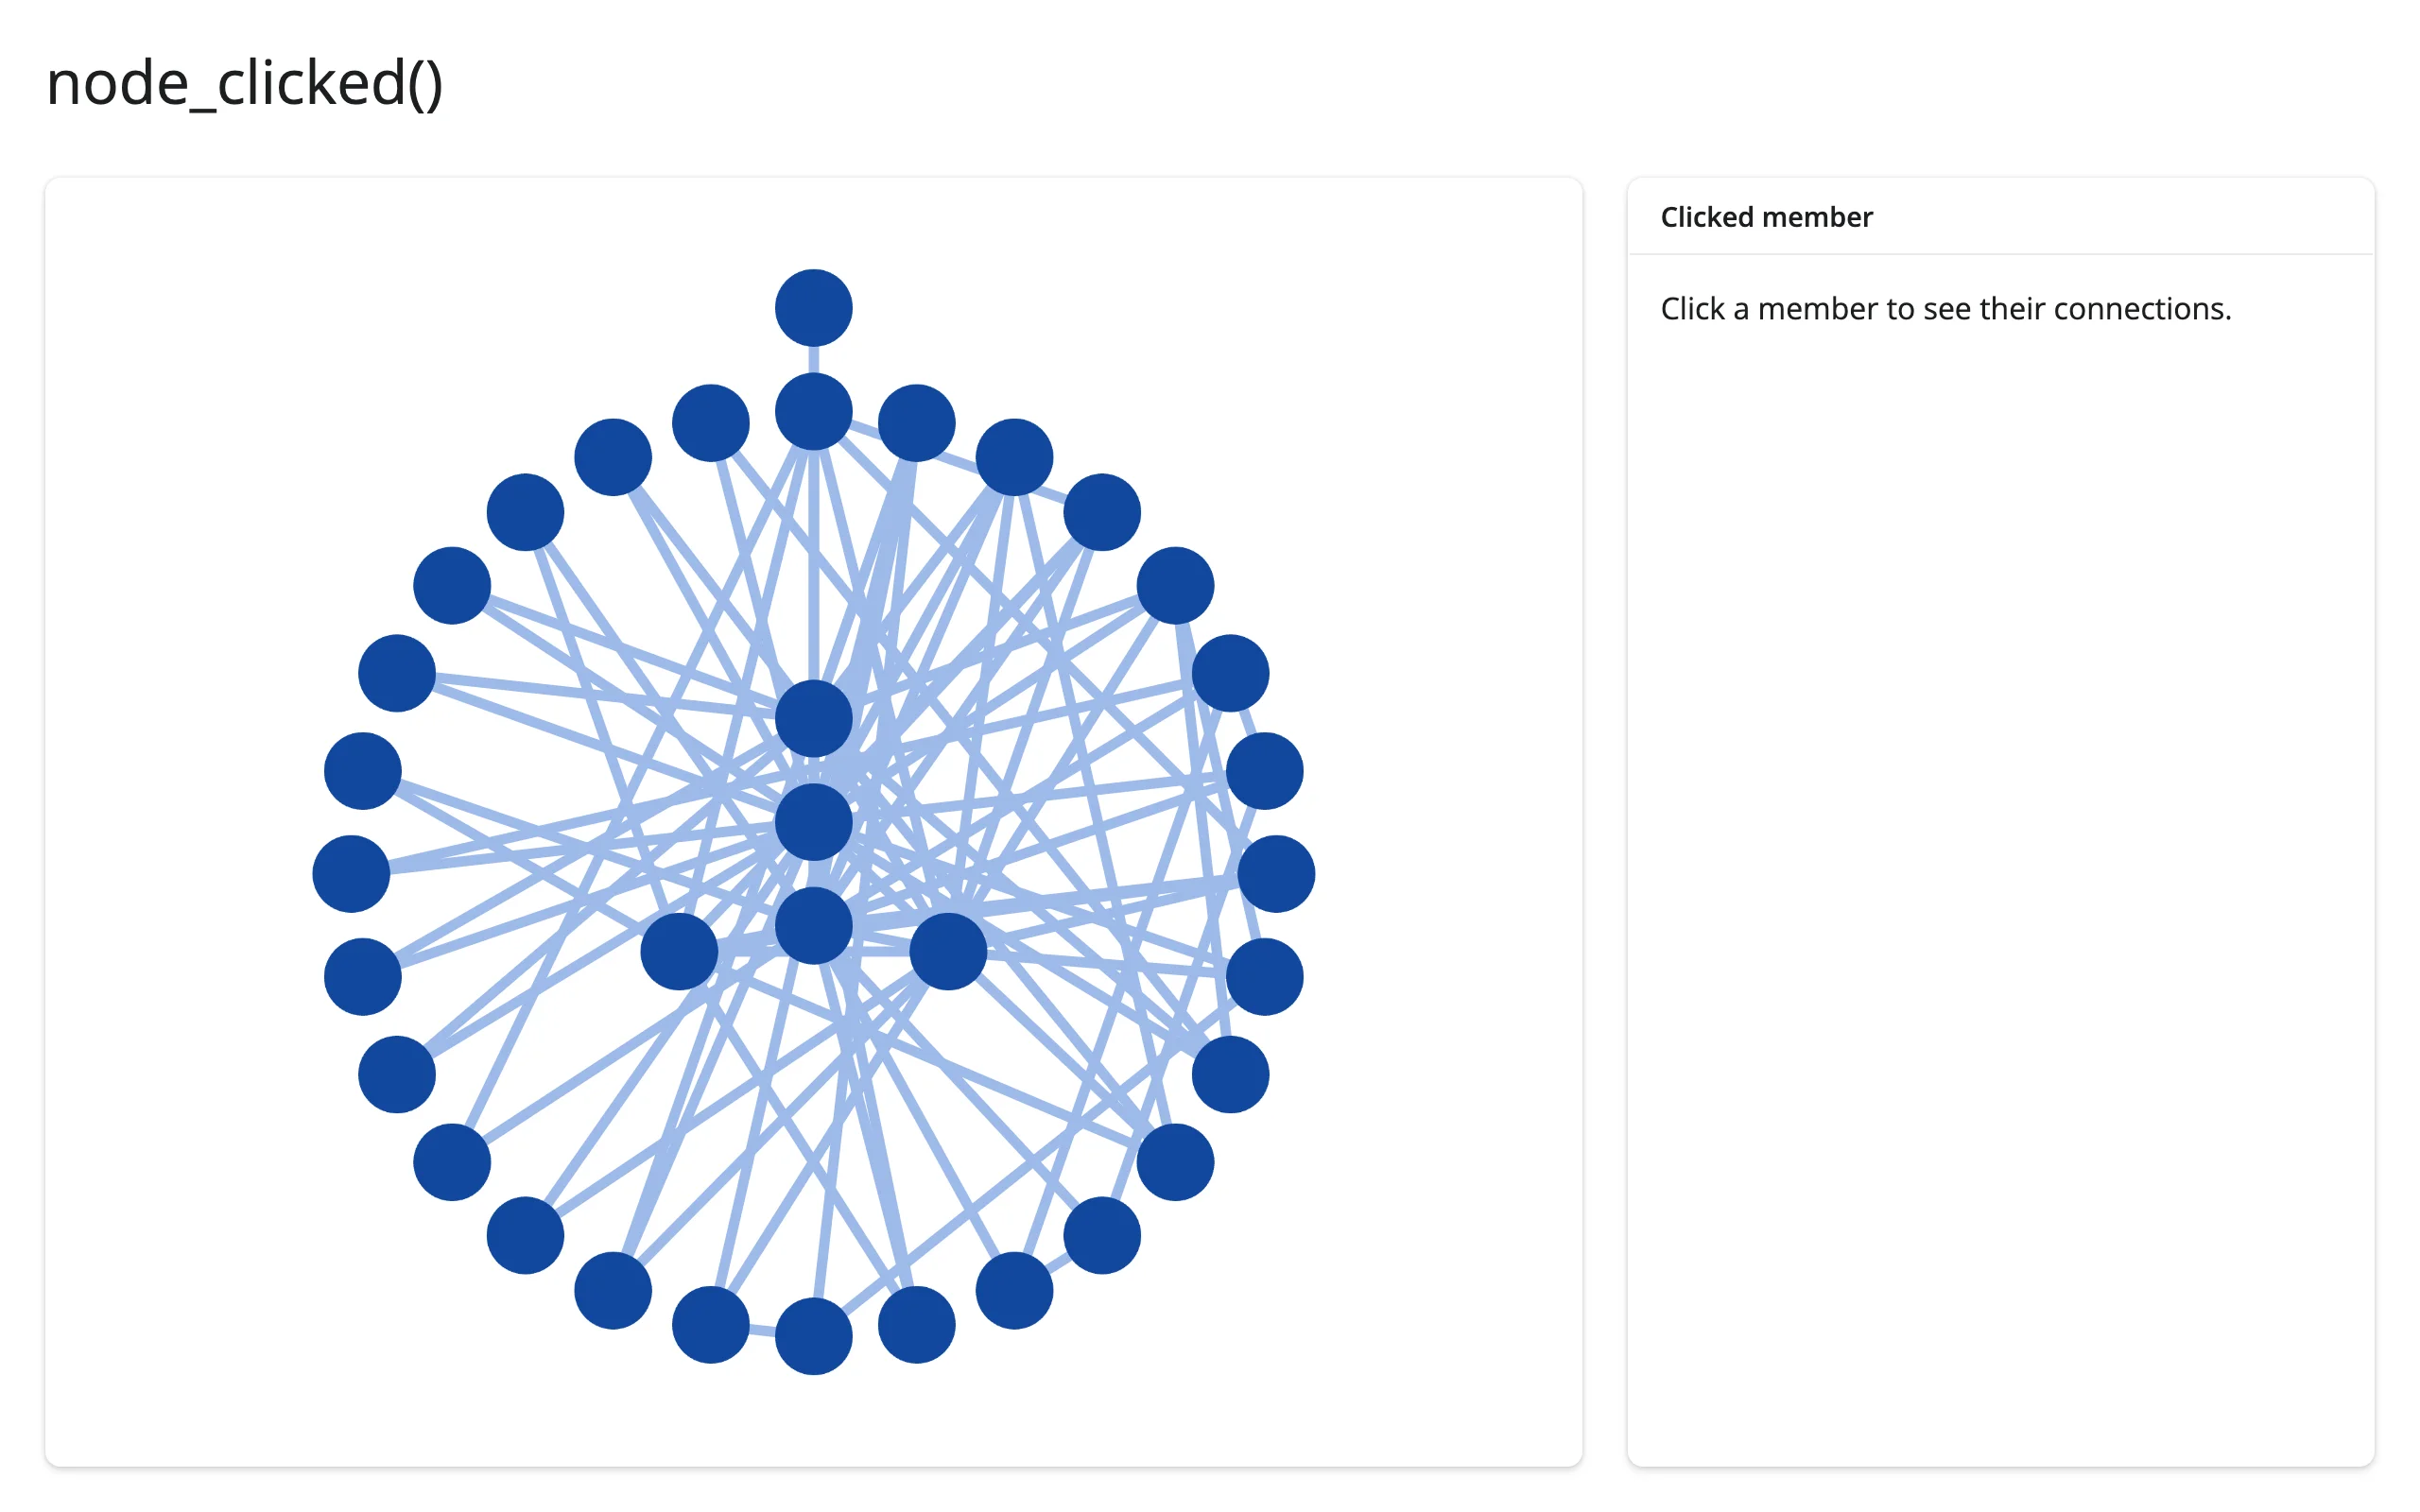
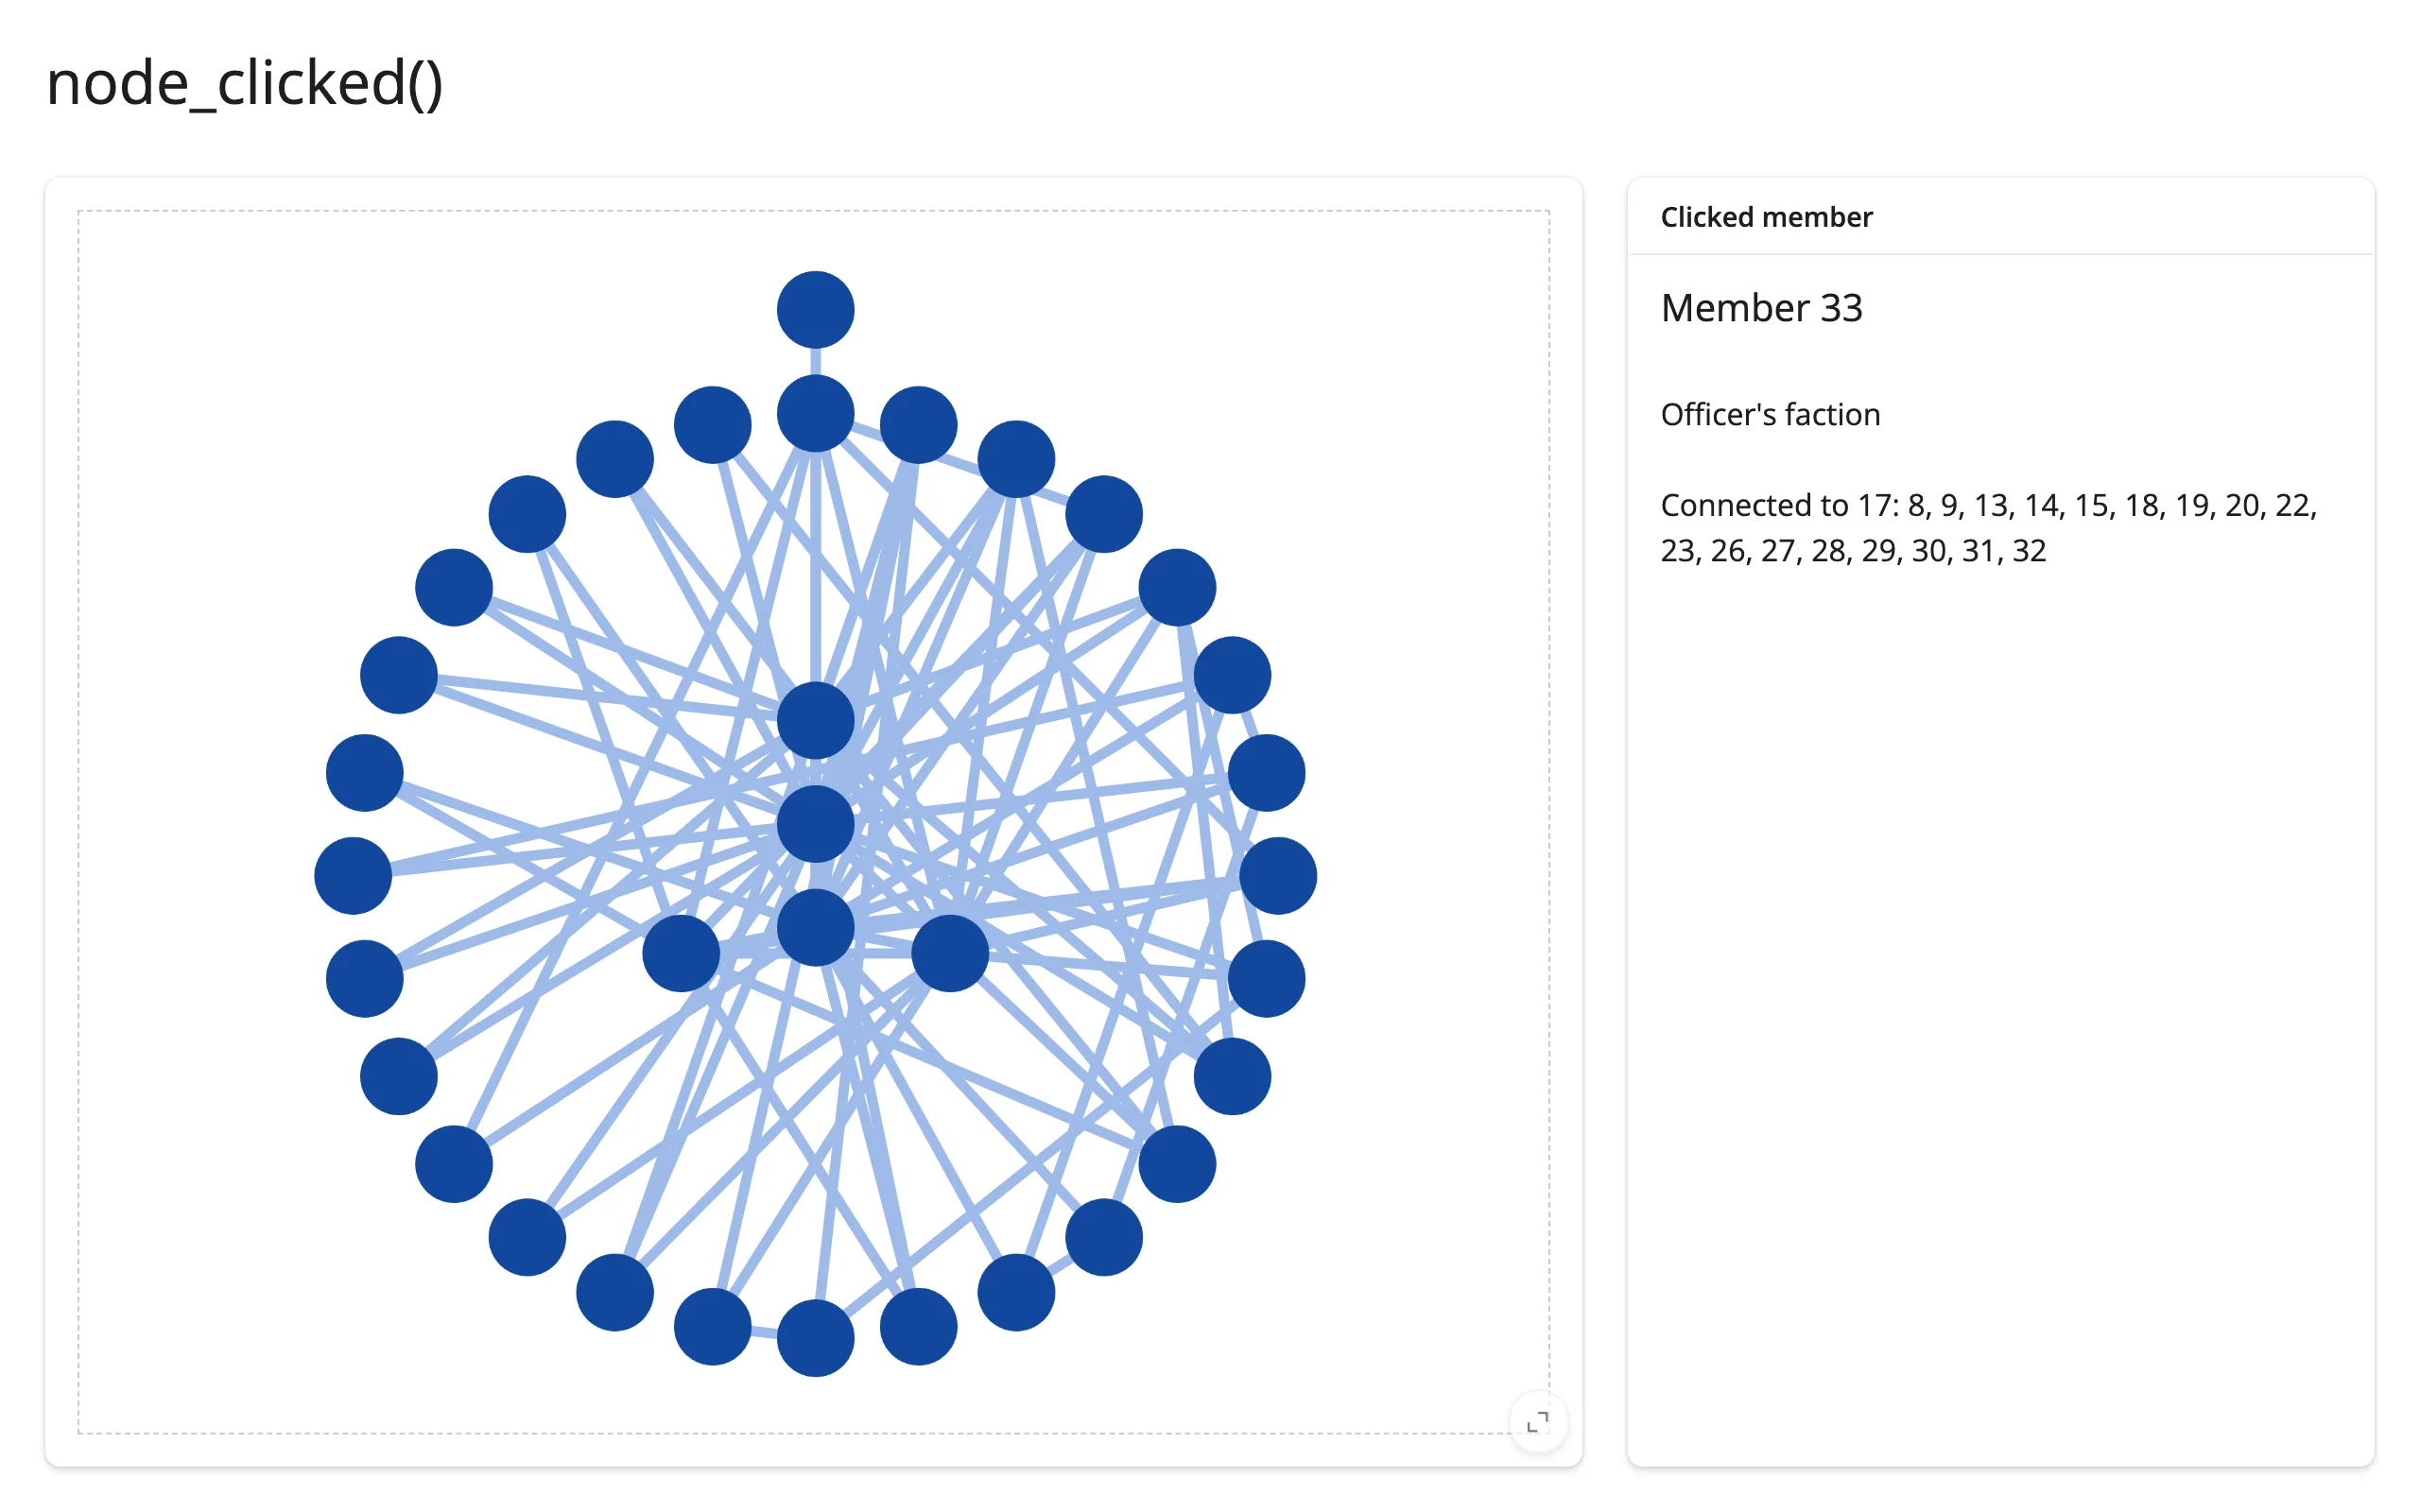
clicked_node(): a detail card and neighbor list
import networkx as nx
from ipycytoscape import CytoscapeWidget
from shiny.express import render, ui
from shinywidgets import render_ipycytoscape

G = nx.karate_club_graph()

ui.page_opts(title="clicked_node()", fillable=True)

with ui.layout_columns(col_widths=[8, 4]):
    with ui.card(full_screen=True):

        @render_ipycytoscape
        def network():
            widget = CytoscapeWidget(G)
            widget.set_layout(name="concentric")
            return widget

    with ui.card():
        ui.card_header("Clicked member")

        @render.ui
        def detail():
            clicked = network.clicked_node()
            if clicked is None:
                return ui.p("Click a member to see their connections.")
            member = int(clicked["data"]["id"])
            friends = sorted(G.neighbors(member))
            return ui.TagList(
                ui.h5(f"Member {member}"),
                ui.p(f"{G.nodes[member]['club']}'s faction"),
                ui.p(f"Connected to {len(friends)}: {', '.join(map(str, friends))}"),
)| Before | After clicking member 33 |
|---|---|
 |
 |
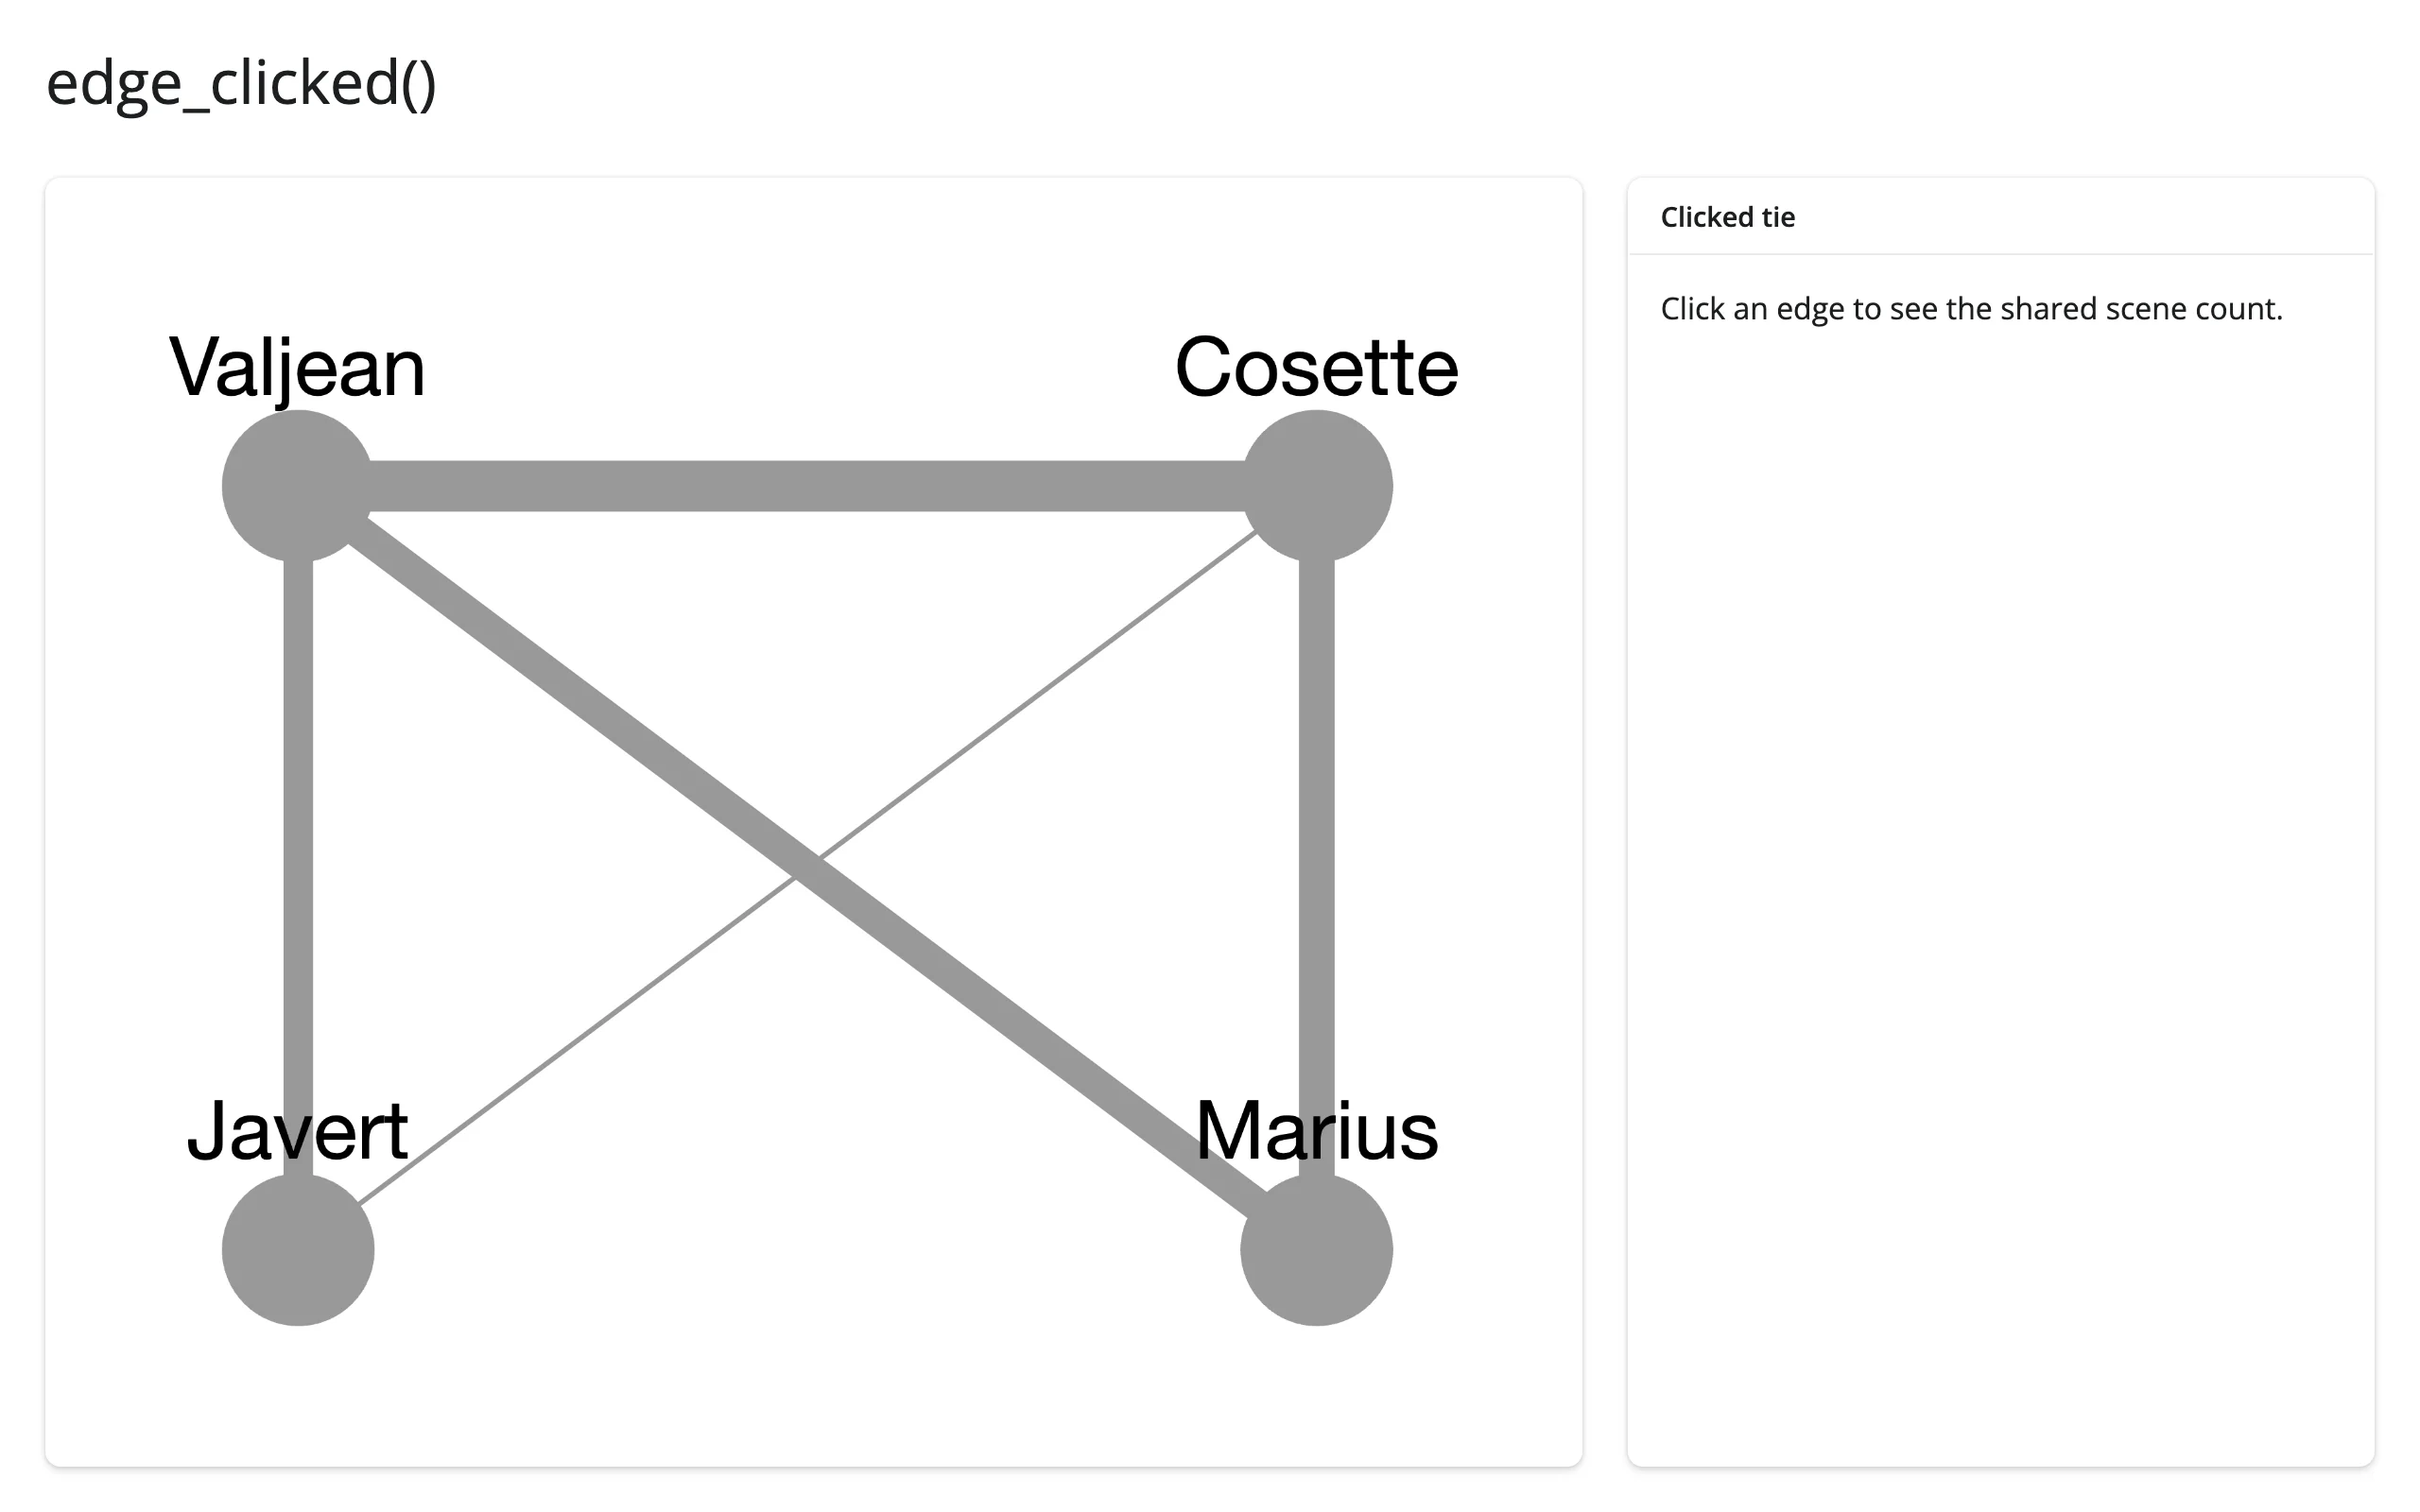
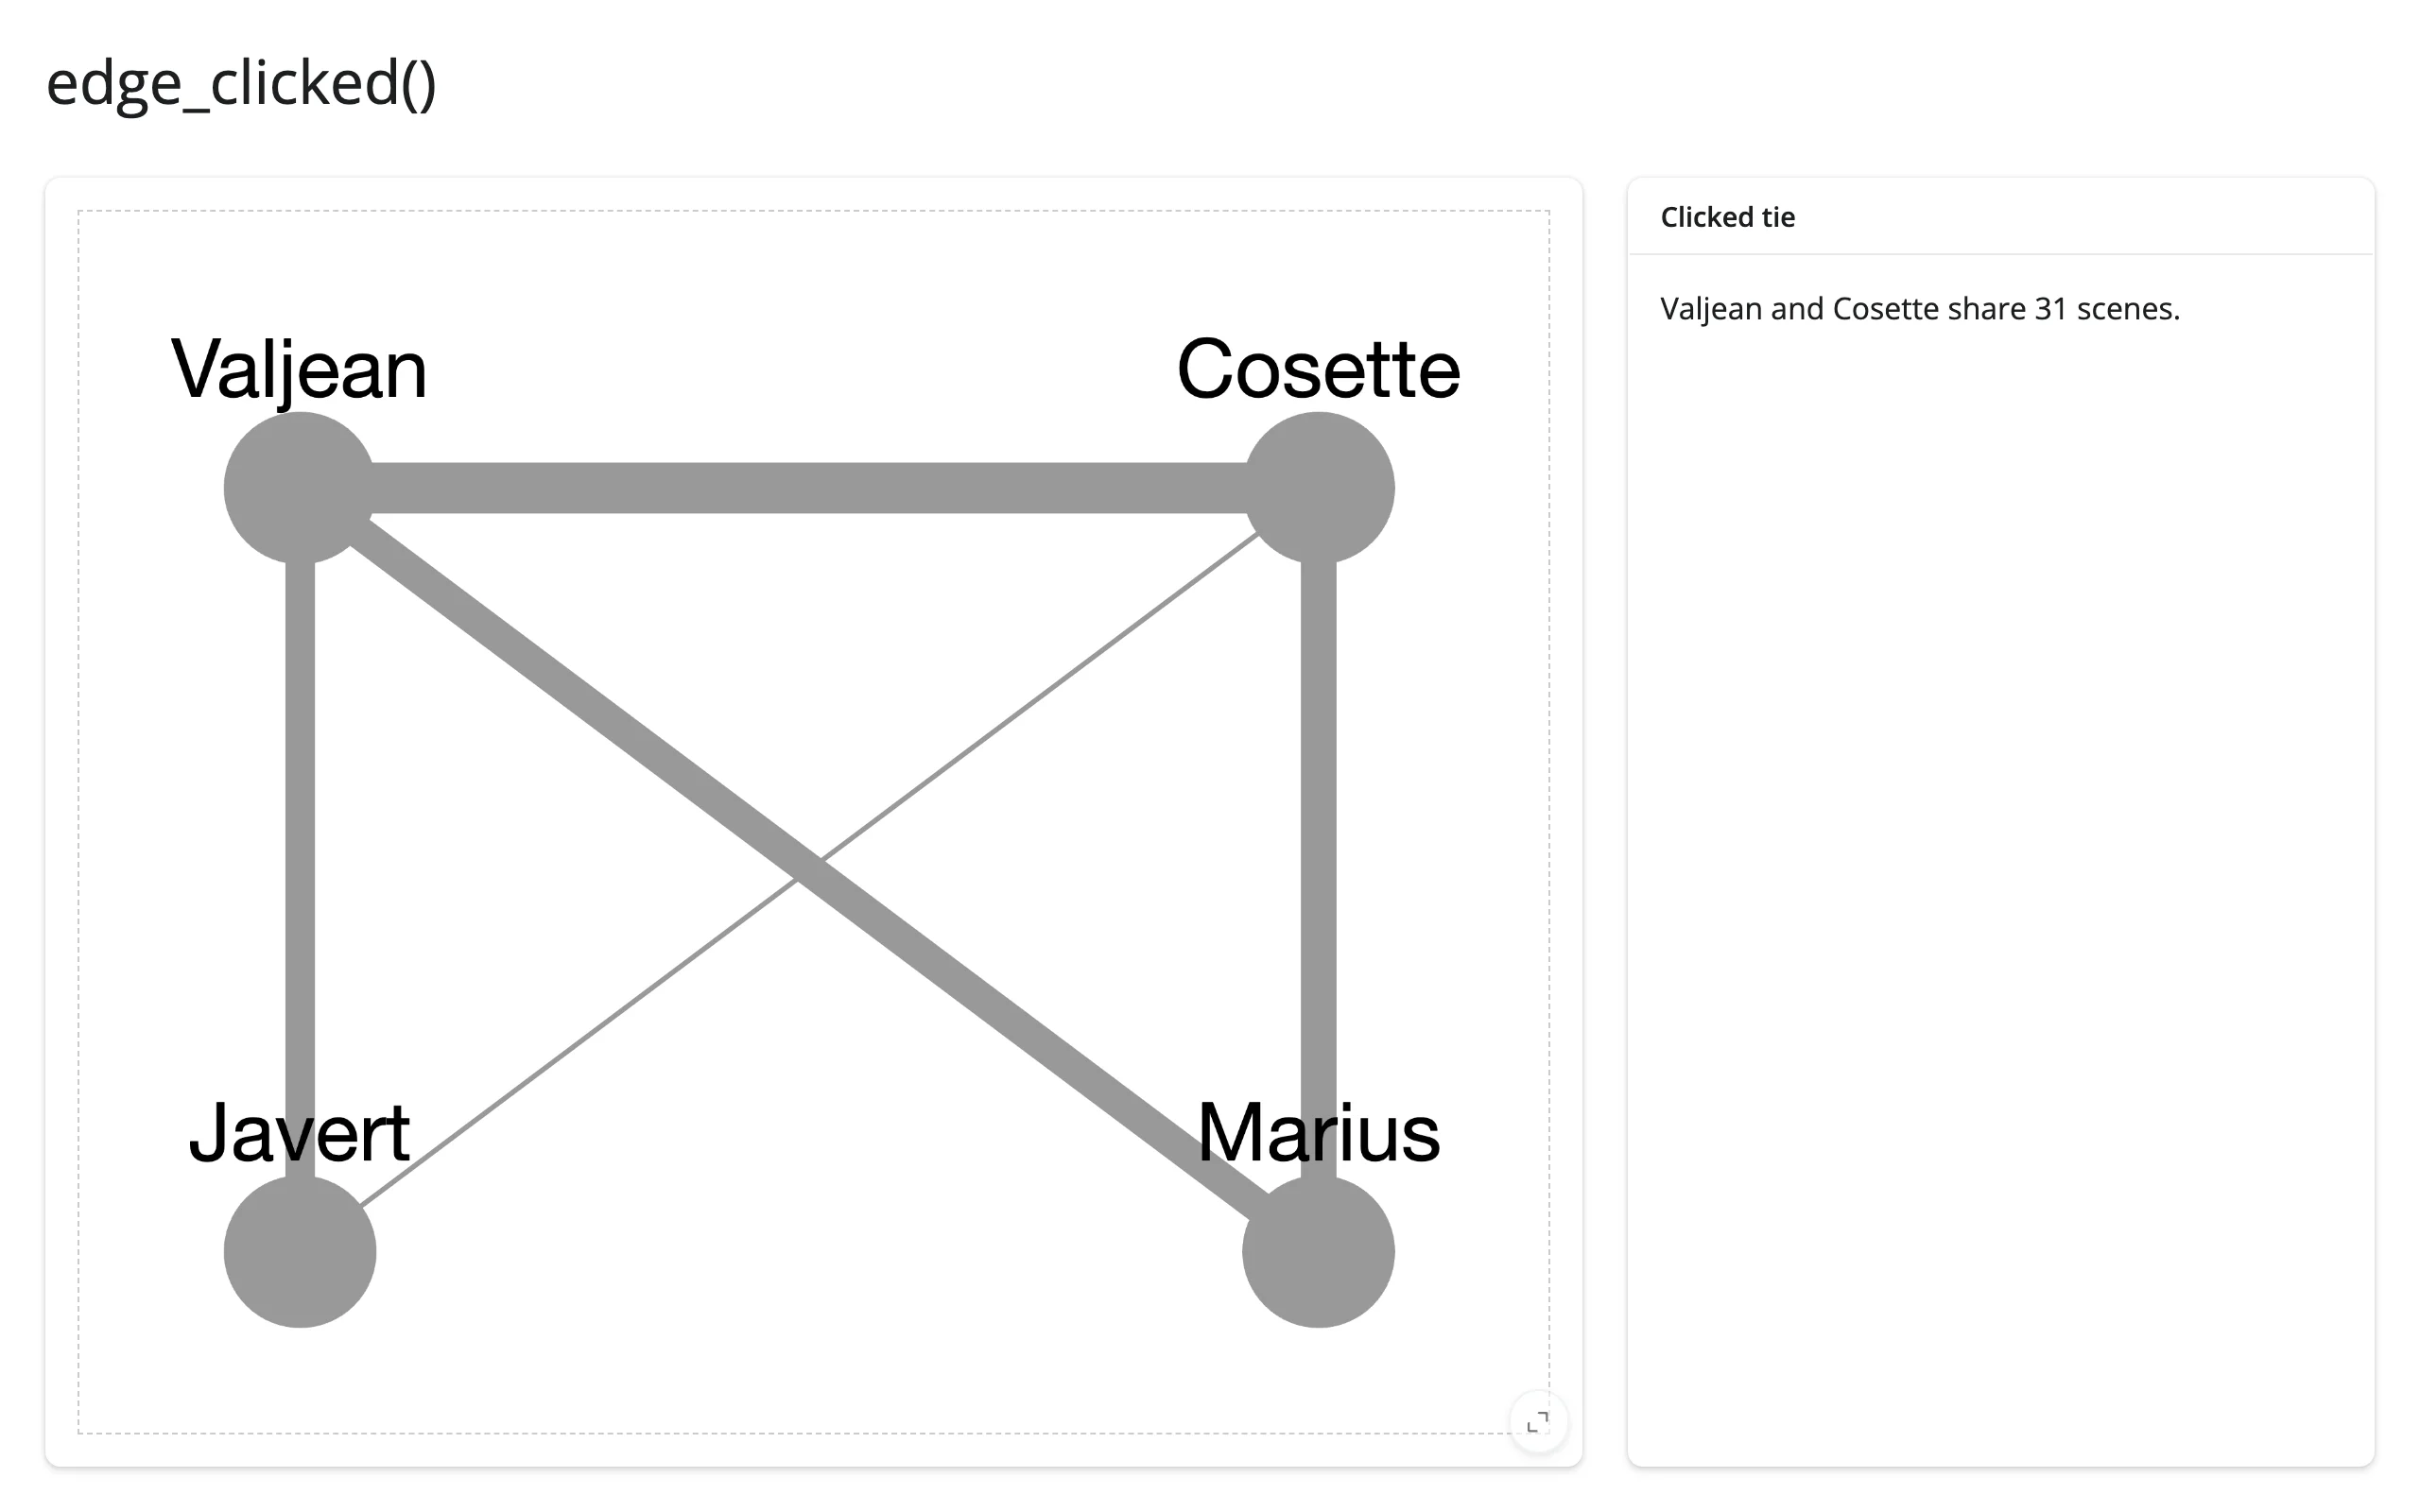
clicked_edge(): the data behind a tie
import networkx as nx
from ipycytoscape import CytoscapeWidget
from shiny.express import render, ui
from shinywidgets import render_ipycytoscape

# A small corner of the Les Miserables co-appearance graph, with fixed
# positions so every edge lands in a predictable spot
G = (
    nx.les_miserables_graph()
    .subgraph(["Valjean", "Cosette", "Javert", "Marius"])
    .copy()
)
POSITIONS = {
    "Valjean": (200, 150),
    "Cosette": (400, 150),
    "Javert": (200, 300),
    "Marius": (400, 300),
}

STYLE = [
    {"selector": "node", "style": {"label": "data(id)"}},
    {"selector": "edge", "style": {"width": "mapData(weight, 1, 31, 1, 10)"}},
]

ui.page_opts(title="clicked_edge()", fillable=True)

with ui.layout_columns(col_widths=[8, 4]):
    with ui.card(full_screen=True):

        @render_ipycytoscape
        def network():
            widget = CytoscapeWidget(G)
            widget.set_style(STYLE)
            for node in widget.graph.nodes:
                node.position = {
                    "x": POSITIONS[node.data["id"]][0],
                    "y": POSITIONS[node.data["id"]][1],
                }
            widget.set_layout(name="preset", fit=True, padding=40)
            return widget

    with ui.card():
        ui.card_header("Clicked tie")

        @render.ui
        def detail():
            clicked = network.clicked_edge()
            if clicked is None:
                return ui.p("Click an edge to see the shared scene count.")
            d = clicked["data"]
return ui.p(f"{d['source']} and {d['target']} share {d['weight']} scenes.")| Before | After clicking Valjean–Cosette |
|---|---|
 |
 |
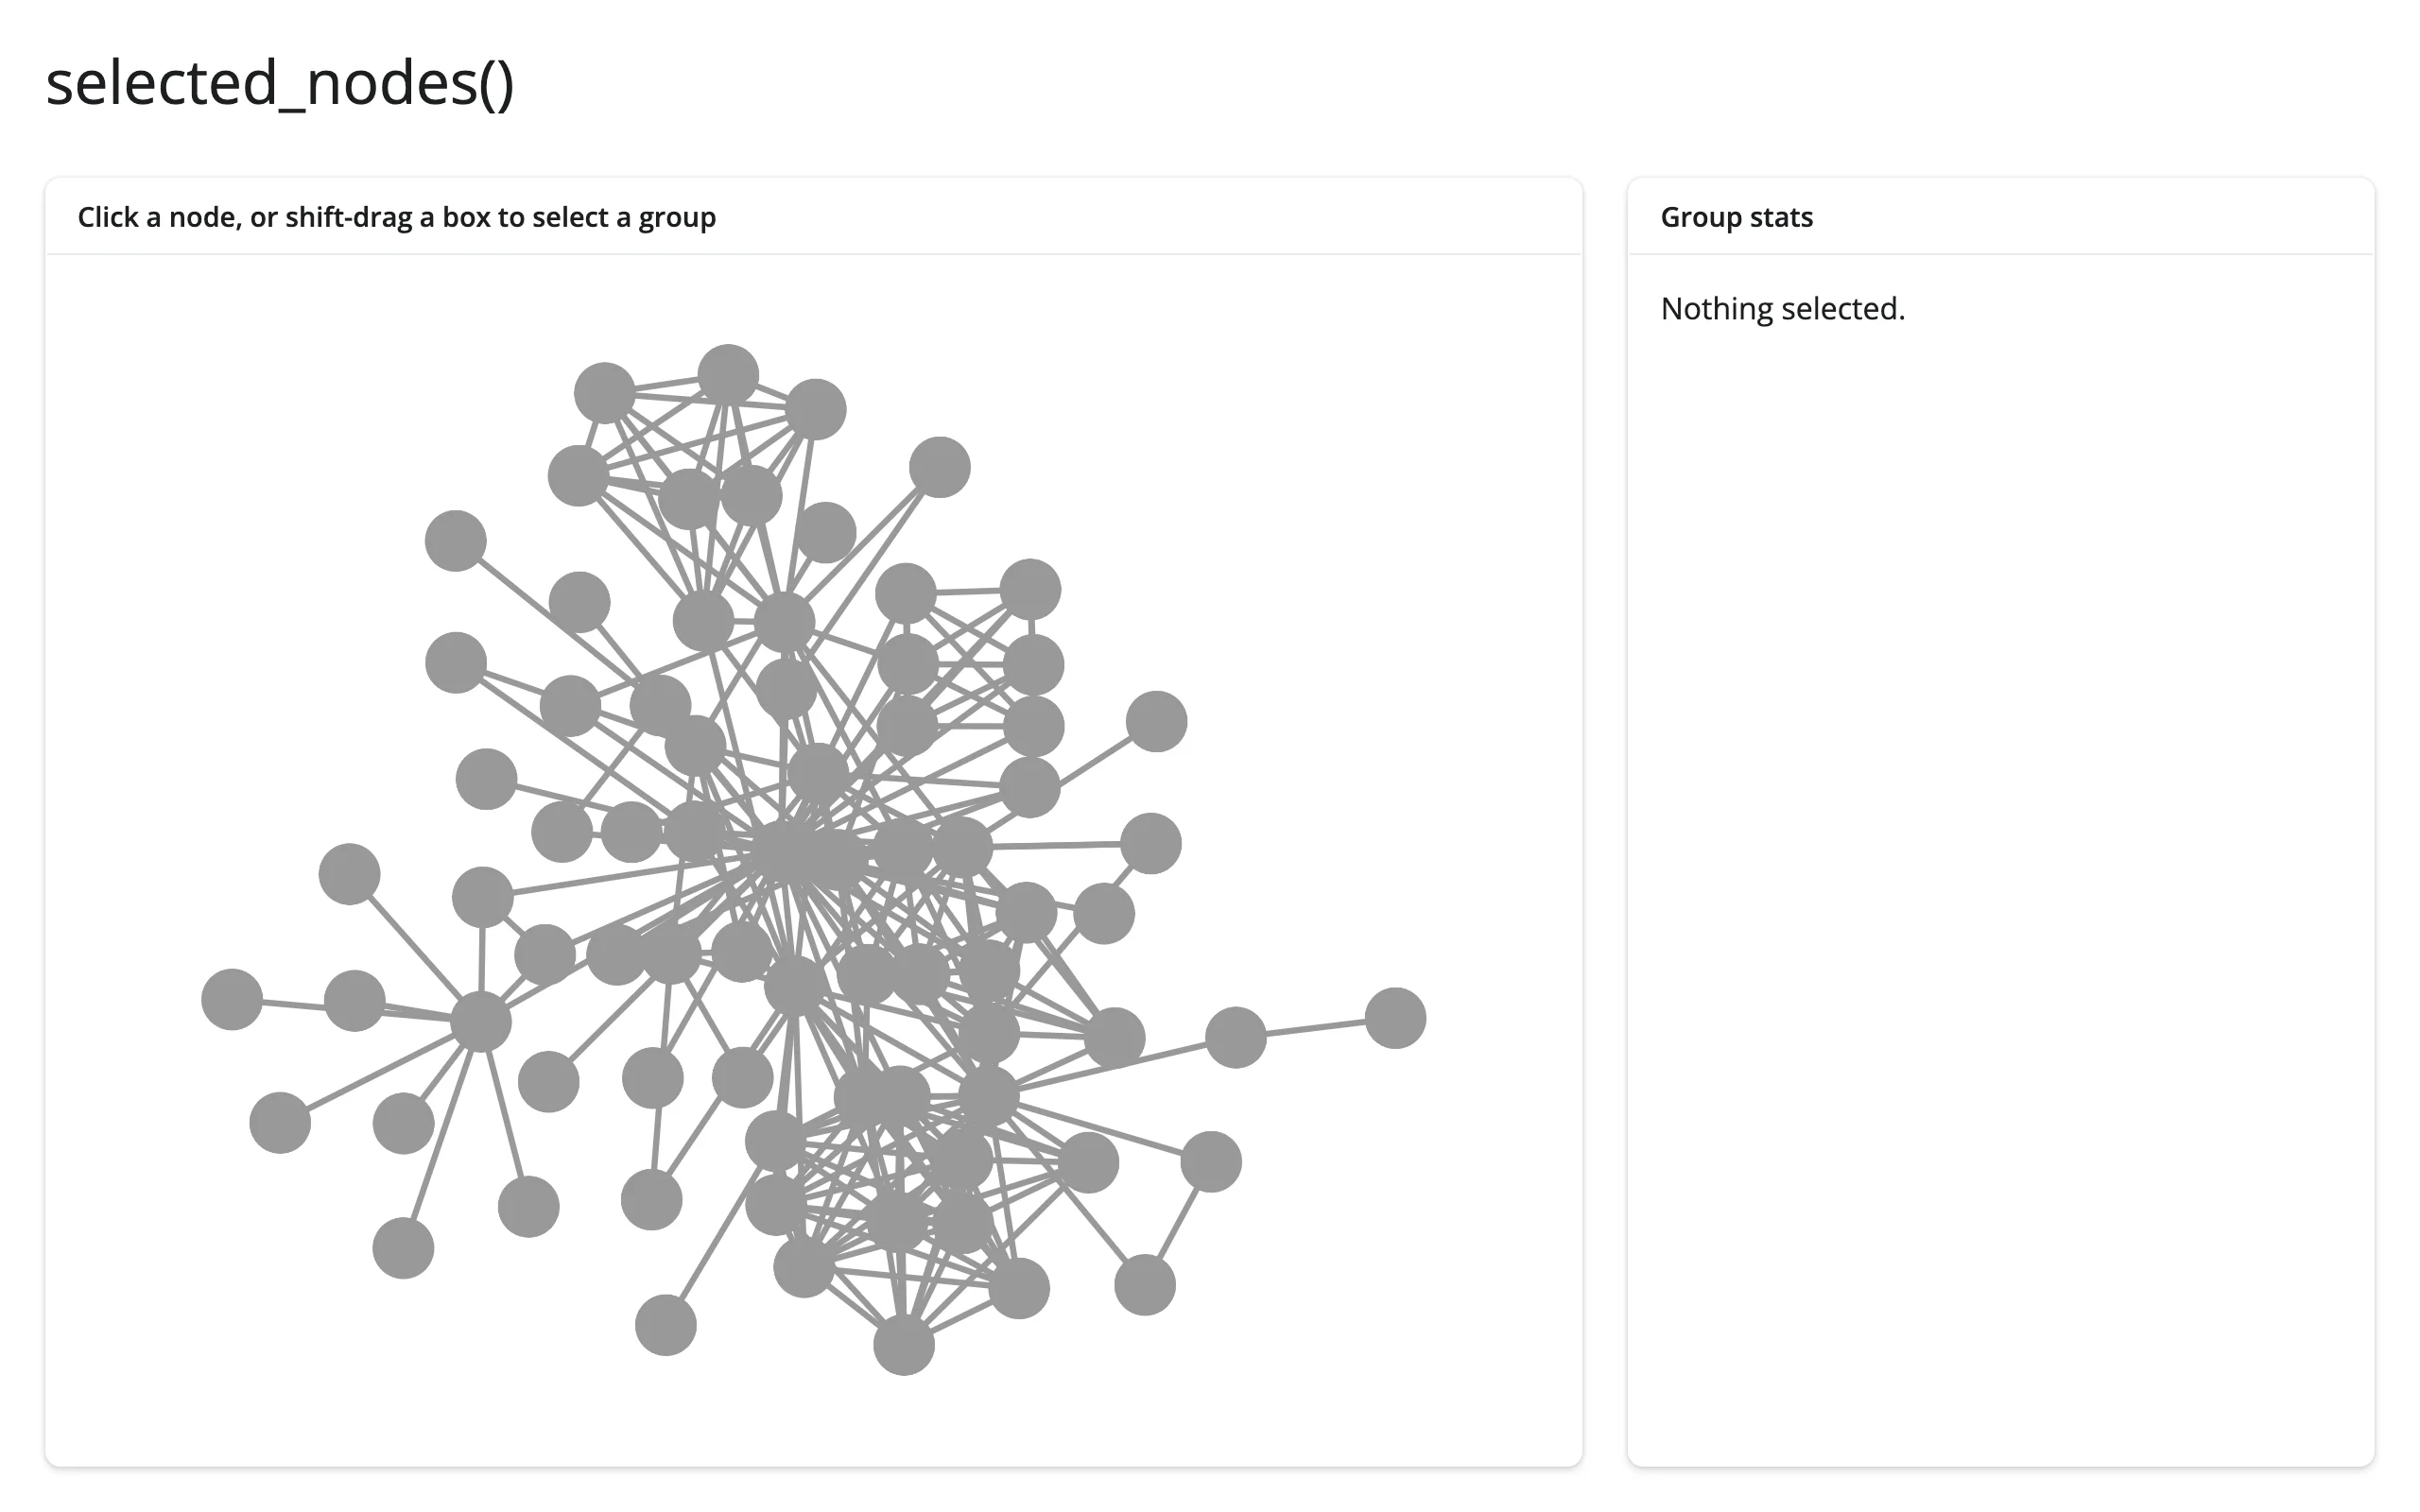
selected_nodes()/selected_edges(): box and multi-select
clicked_node() only reports single clicks. selected_nodes() and selected_edges() cover the rest of ipycytoscape’s selection model – shift-drag box selection and multi-select – as a one-line read of the current selection, with no need to loop over the graph’s children yourself.
Two things to set up first, both verified on current main: ipycytoscape makes nodes unselectable by default (Node.selectable defaults to False, diverging from the JS default), so set node.selectable = True on each node; and box selection itself needs CytoscapeWidget(..., auto_unselectify=False, box_selection_enabled=True).
import networkx as nx
from ipycytoscape import CytoscapeWidget
from shiny.express import render, ui
from shinywidgets import render_ipycytoscape

G = nx.les_miserables_graph()
STYLE = [{"selector": "node:selected", "style": {"background-color": "#e15759"}}]

ui.page_opts(title="selected_nodes()", fillable=True)

with ui.layout_columns(col_widths=[8, 4]):
    with ui.card(full_screen=True):
        ui.card_header("Click a node, or shift-drag a box to select a group")

        @render_ipycytoscape
        def network():
            widget = CytoscapeWidget(
                G, auto_unselectify=False, box_selection_enabled=True
            )
            widget.set_style(STYLE)
            widget.set_layout(name="cose")
            for node in widget.graph.nodes:
                node.selectable = True  # ipycytoscape defaults nodes to unselectable
            return widget

    with ui.card():
        ui.card_header("Group stats")

        @render.ui
        def stats():
            selected = {d["id"] for d in network.selected_nodes()}
            if not selected:
                return ui.p("Nothing selected.")
            sub = G.subgraph(selected)
            return ui.p(
                f"{len(selected)} characters, {sub.number_of_edges()} ties inside "
                f"the group, density {nx.density(sub):.2f}"
)| Before | After a shift-drag box select |
|---|---|
 |
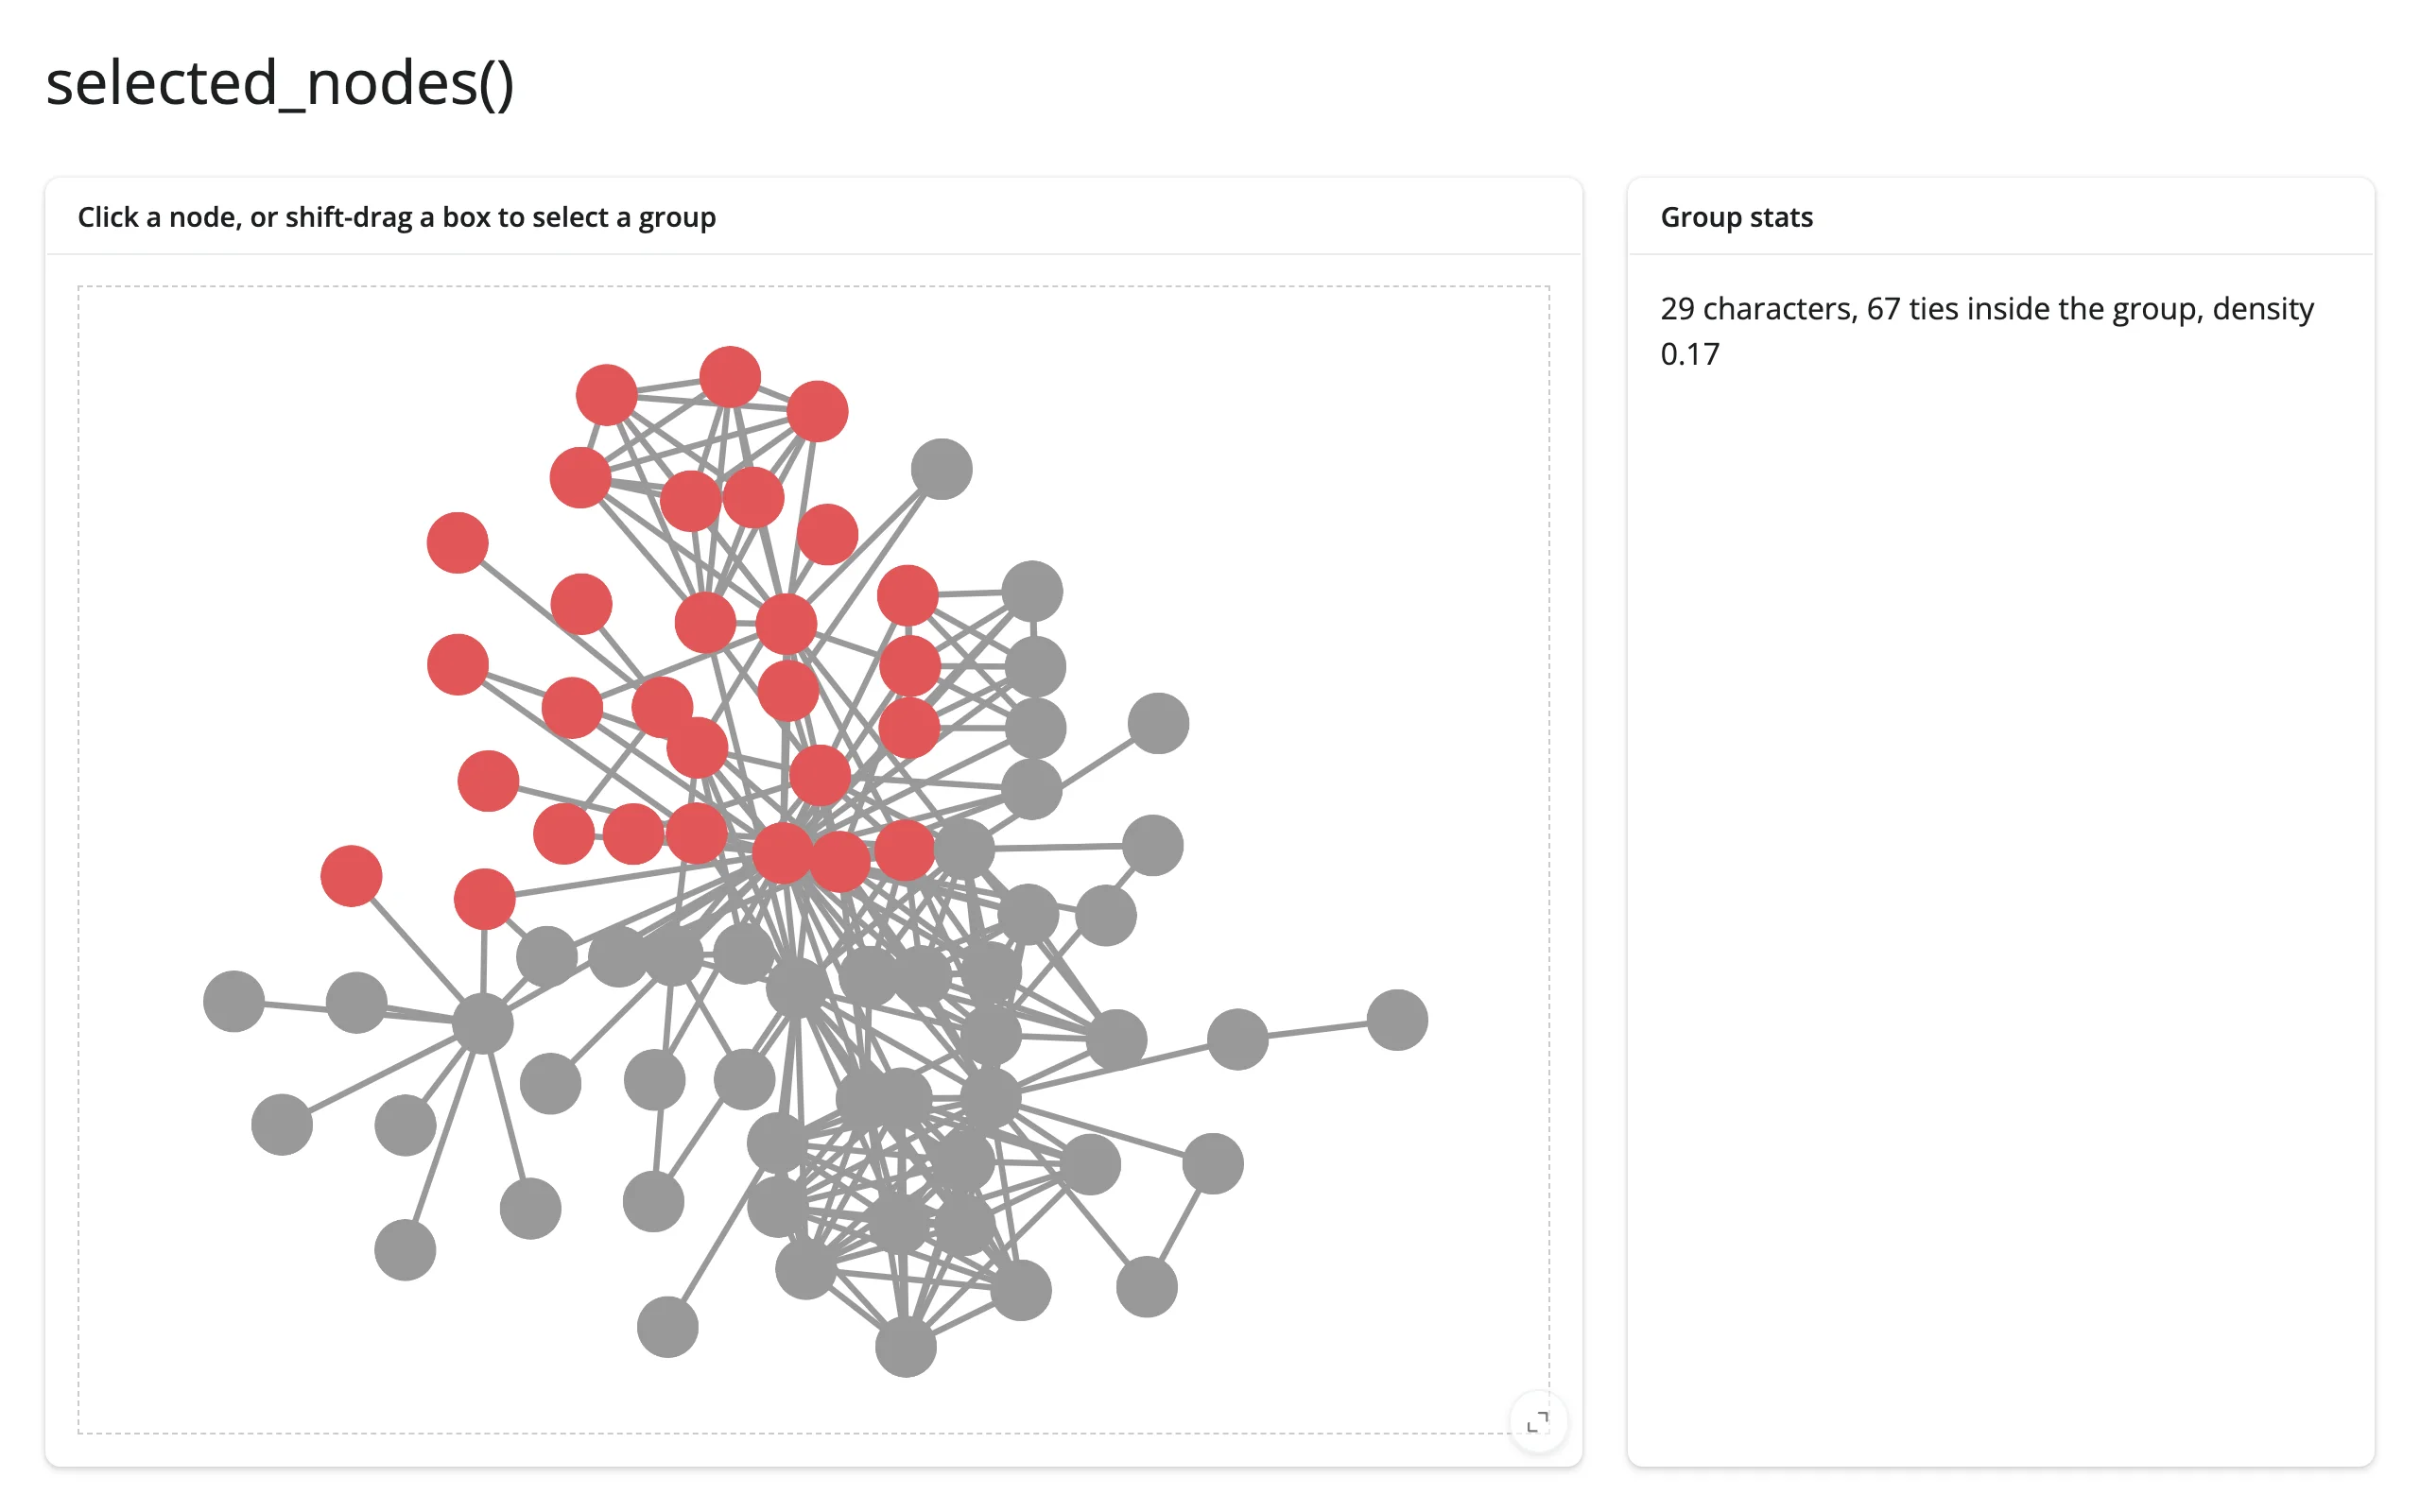 |
A click selects one node (or adds to the selection with selection_type="additive"); shift-drag box-selects a group; clicking the background clears everything. Don’t try to set node.selected from Python to drive selection – on current main, writing it toggles the node’s selectability instead of its selection state, an upstream mismatch between the Python trait and the JS property it’s supposed to mirror. Use classes to highlight from Python instead (see “Coordinating multiple views” below).
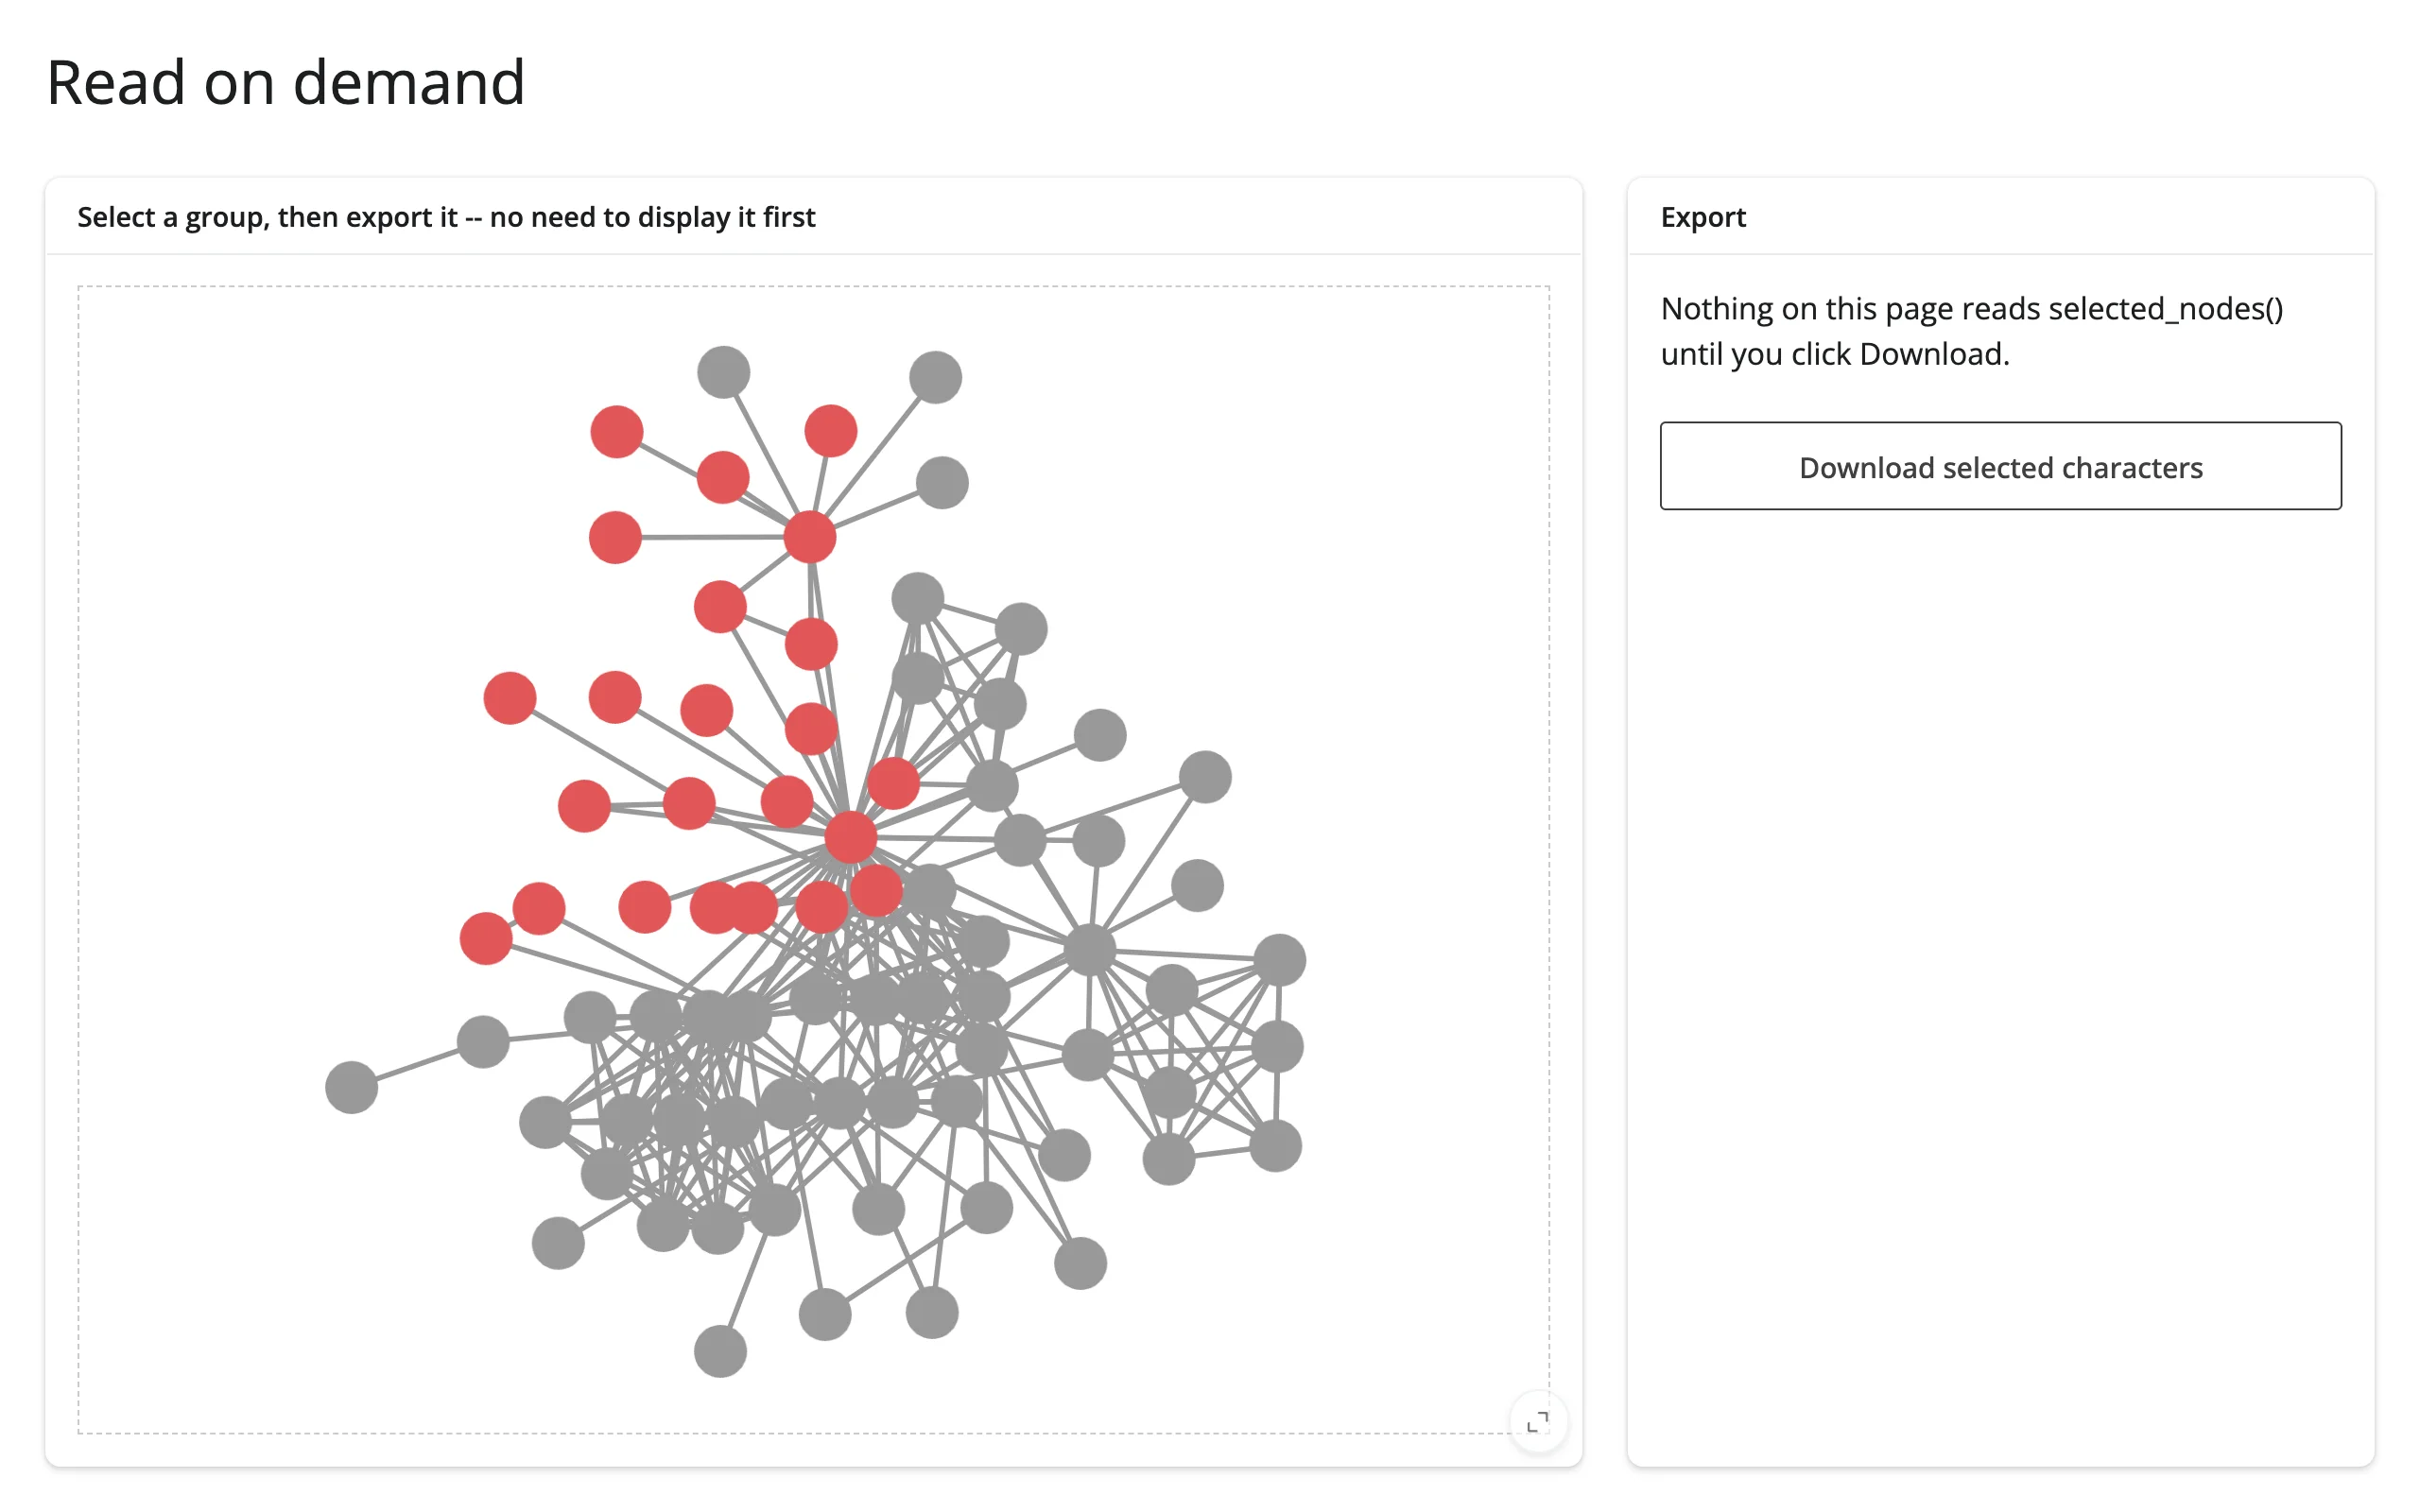
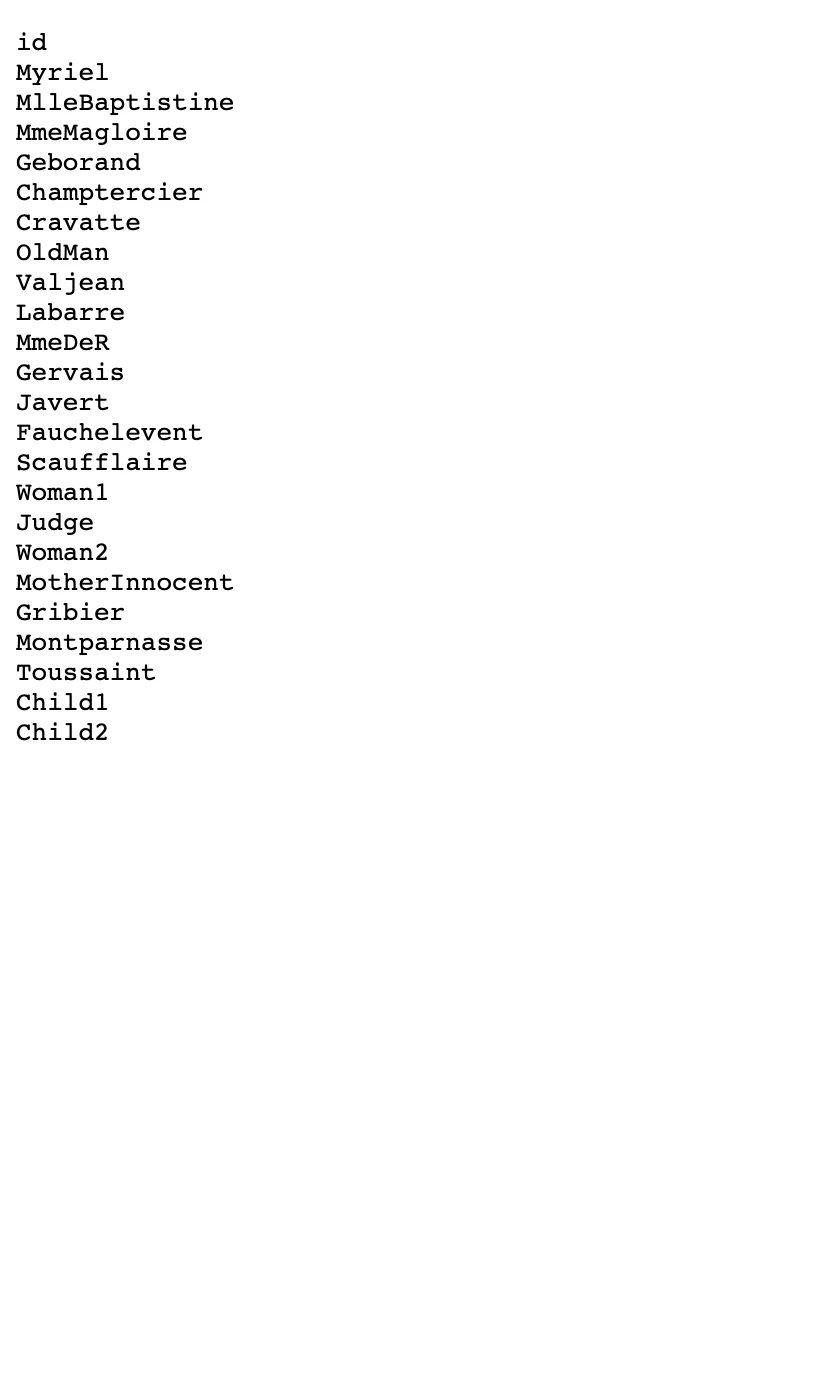
Reading an accessor on demand
Because every accessor is already live and recording interactions the moment the graph renders, reading one for the first time inside a button handler or download handler works – there’s no need to display it reactively first to “warm it up”. A handler that only runs when the user asks for it still sees the latest selection:
import io

import networkx as nx
from ipycytoscape import CytoscapeWidget
from shiny.express import render, ui
from shinywidgets import render_ipycytoscape

G = nx.les_miserables_graph()
STYLE = [{"selector": "node:selected", "style": {"background-color": "#e15759"}}]

ui.page_opts(title="Read on demand", fillable=True)

with ui.layout_columns(col_widths=[8, 4]):
    with ui.card(full_screen=True):
        ui.card_header("Select a group, then export it -- no need to display it first")

        @render_ipycytoscape
        def network():
            widget = CytoscapeWidget(
                G, auto_unselectify=False, box_selection_enabled=True
            )
            widget.set_style(STYLE)
            widget.set_layout(name="cose")
            for node in widget.graph.nodes:
                node.selectable = True
            return widget

    with ui.card():
        ui.card_header("Export")
        ui.p("Nothing on this page reads selected_nodes() until you click Download.")

        @render.download_button(
            filename="selection.csv", label="Download selected characters"
        )
        def export():
            # Read on demand: no warm-up, no earlier display of this value --
            # selected_nodes() already has the latest selection the moment
            # the handler runs.
            rows = ["id"] + [d["id"] for d in network.selected_nodes()]
yield io.BytesIO("\n".join(rows).encode()).getvalue()| Before download | Downloaded file |
|---|---|
 |
 |
Beyond the accessors: reactive_read
The accessors above cover clicks and selection. A couple of other traits sync from the browser but aren’t worth an accessor of their own: each node’s grabbed trait is True while the user is actively dragging it, and removed tracks structural edits. Read either with reactive_read(node, "grabbed") on a node in .widget.graph.nodes. Node position does not sync back (see “Gotchas and limitations”), so there’s no way to read a user’s manual drag target from Python.
For box-selection at a larger scale than selected_nodes()/selected_edges() comfortably handle (well past Les Mis’s 77 nodes, under very heavy selection churn), the accessors’ own implementation is the pattern to copy: one node.observe(callback, "selected") per node, folded into a single reactive.value, which is exactly what selected_nodes() already does for you in the common case.
Rate limiting
render_ipycytoscape’s rate_policy/rate_delay kwargs cover reactive_read() on the top-level CytoscapeWidget and the graph’s child Node/Edge widgets – the ones that actually own selected and grabbed. They also override selected_nodes()/selected_edges()’s own debounce default (0.25s); clicked_node()/clicked_edge() aren’t rate-limited (every click is discrete and immediate, so there’s nothing to smooth out). One limitation worth knowing: nodes or edges added to the graph after a render aren’t covered until the next render.
Updating the widget from Python
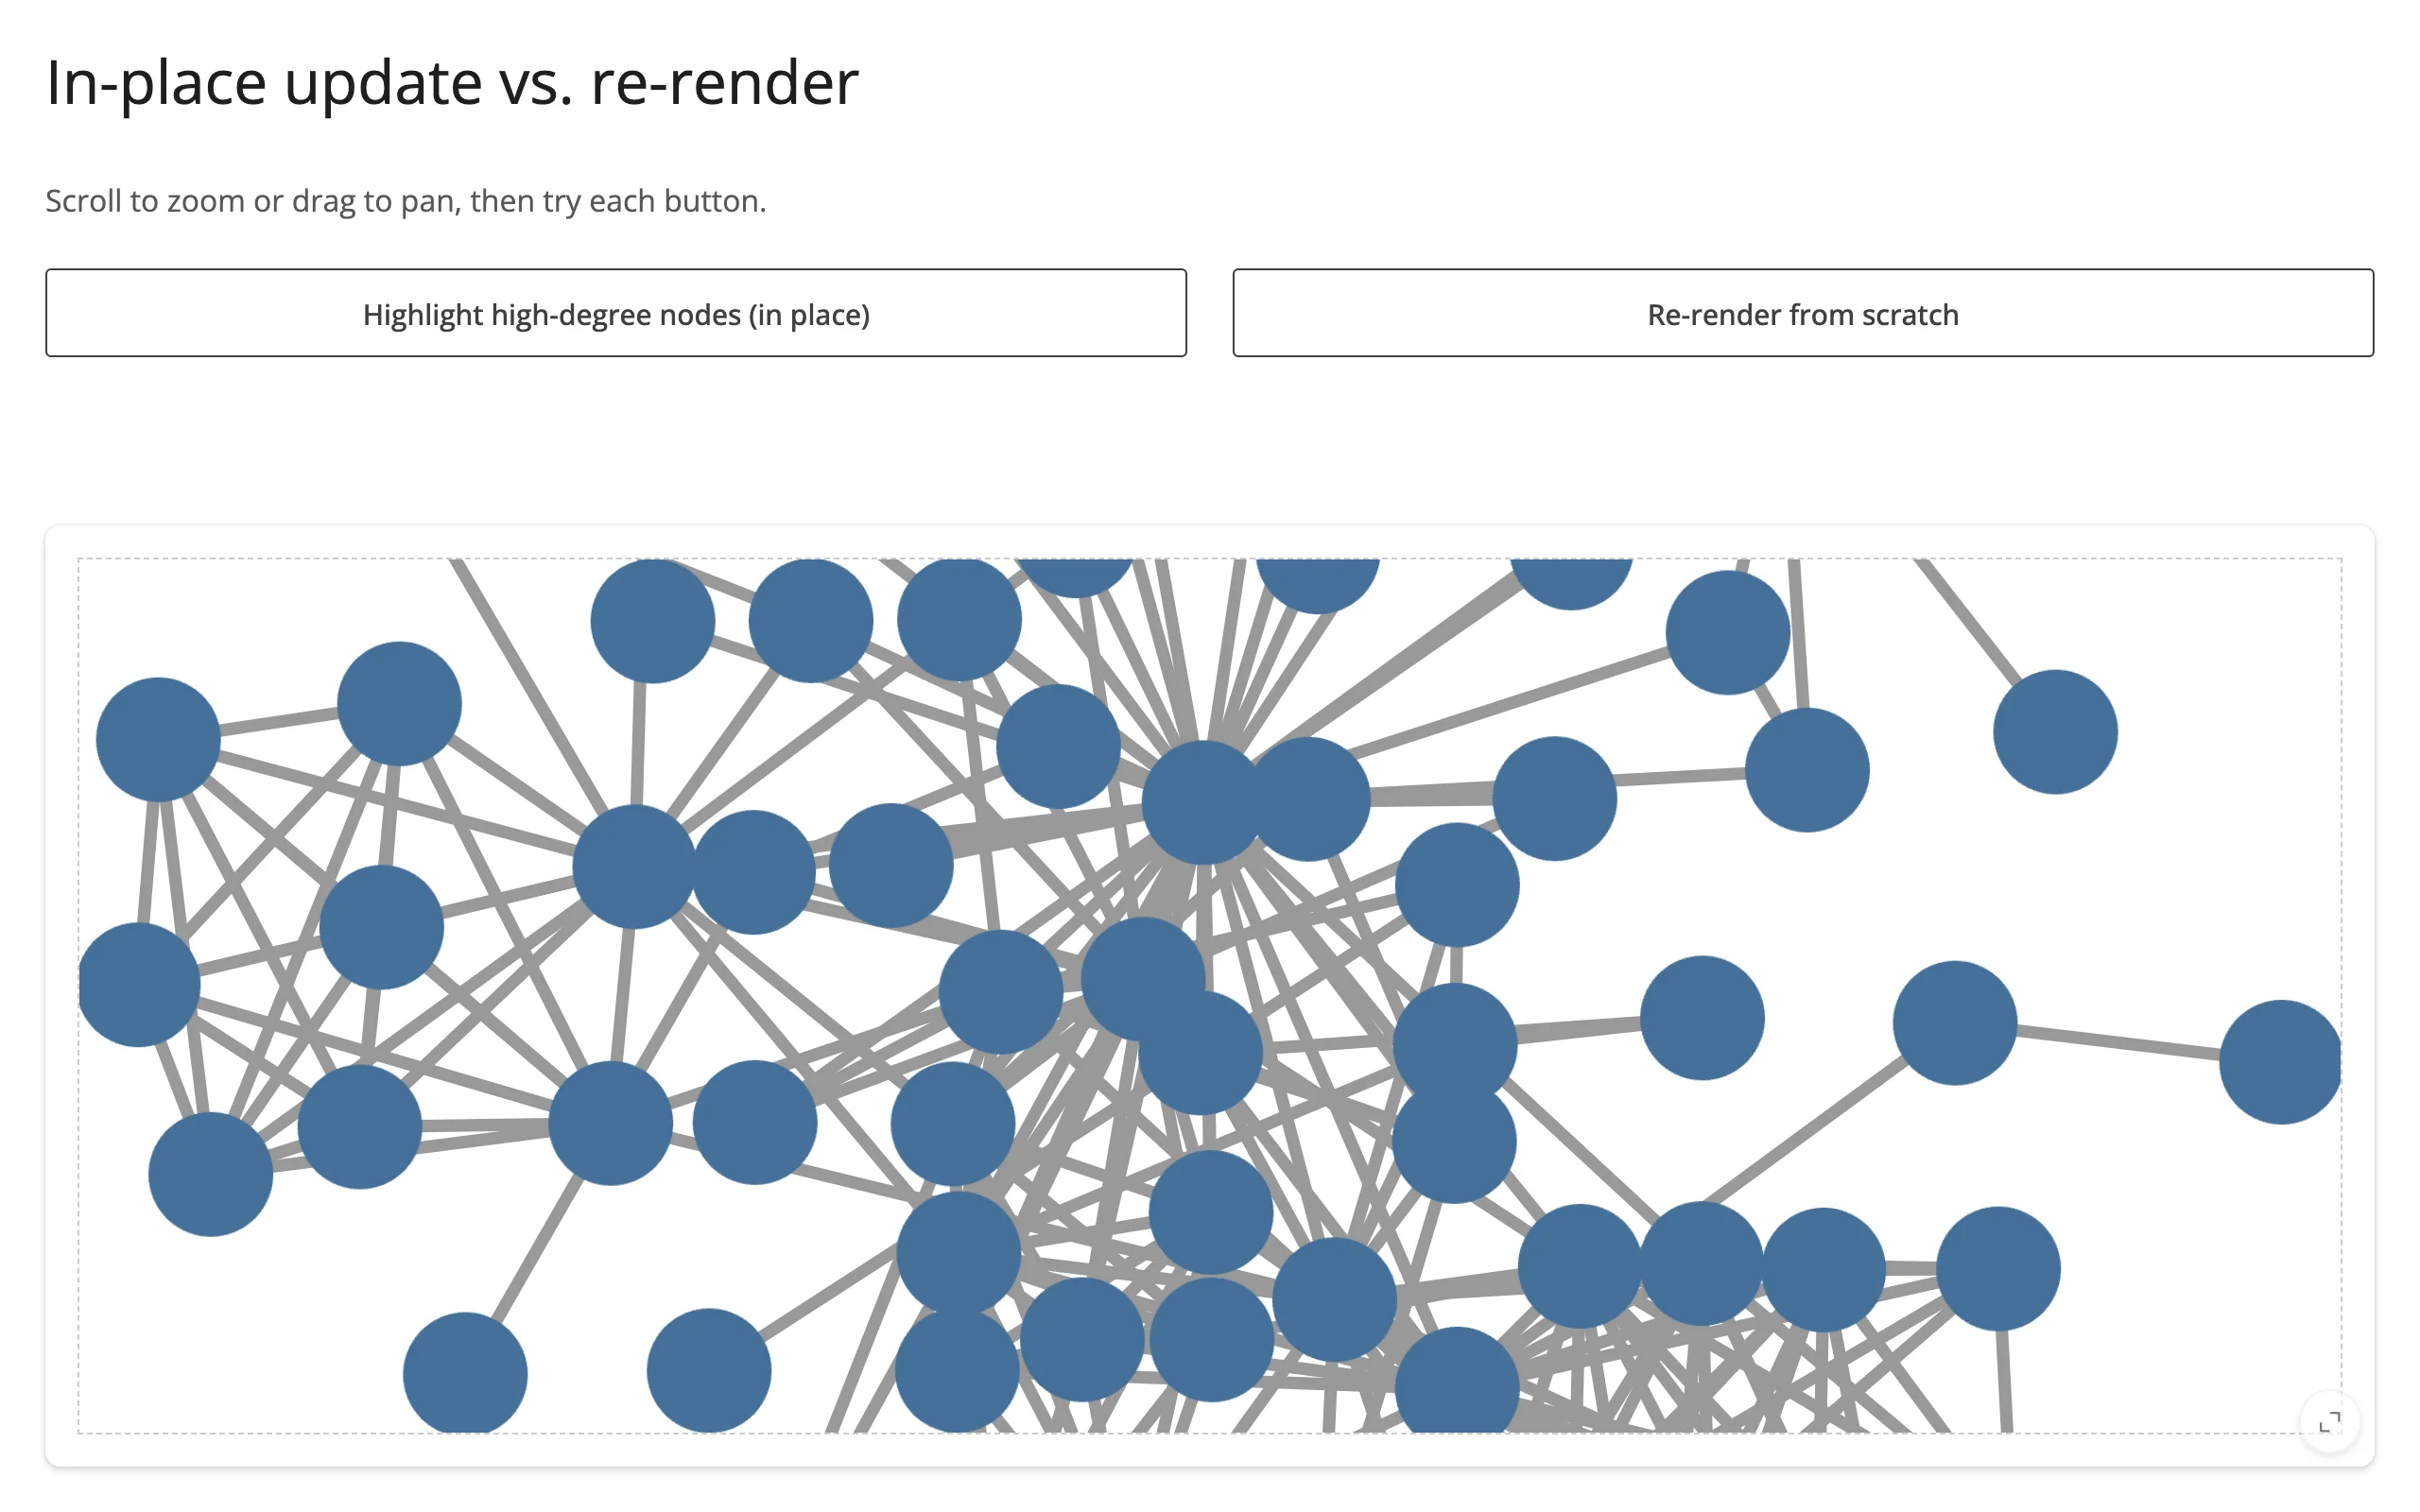
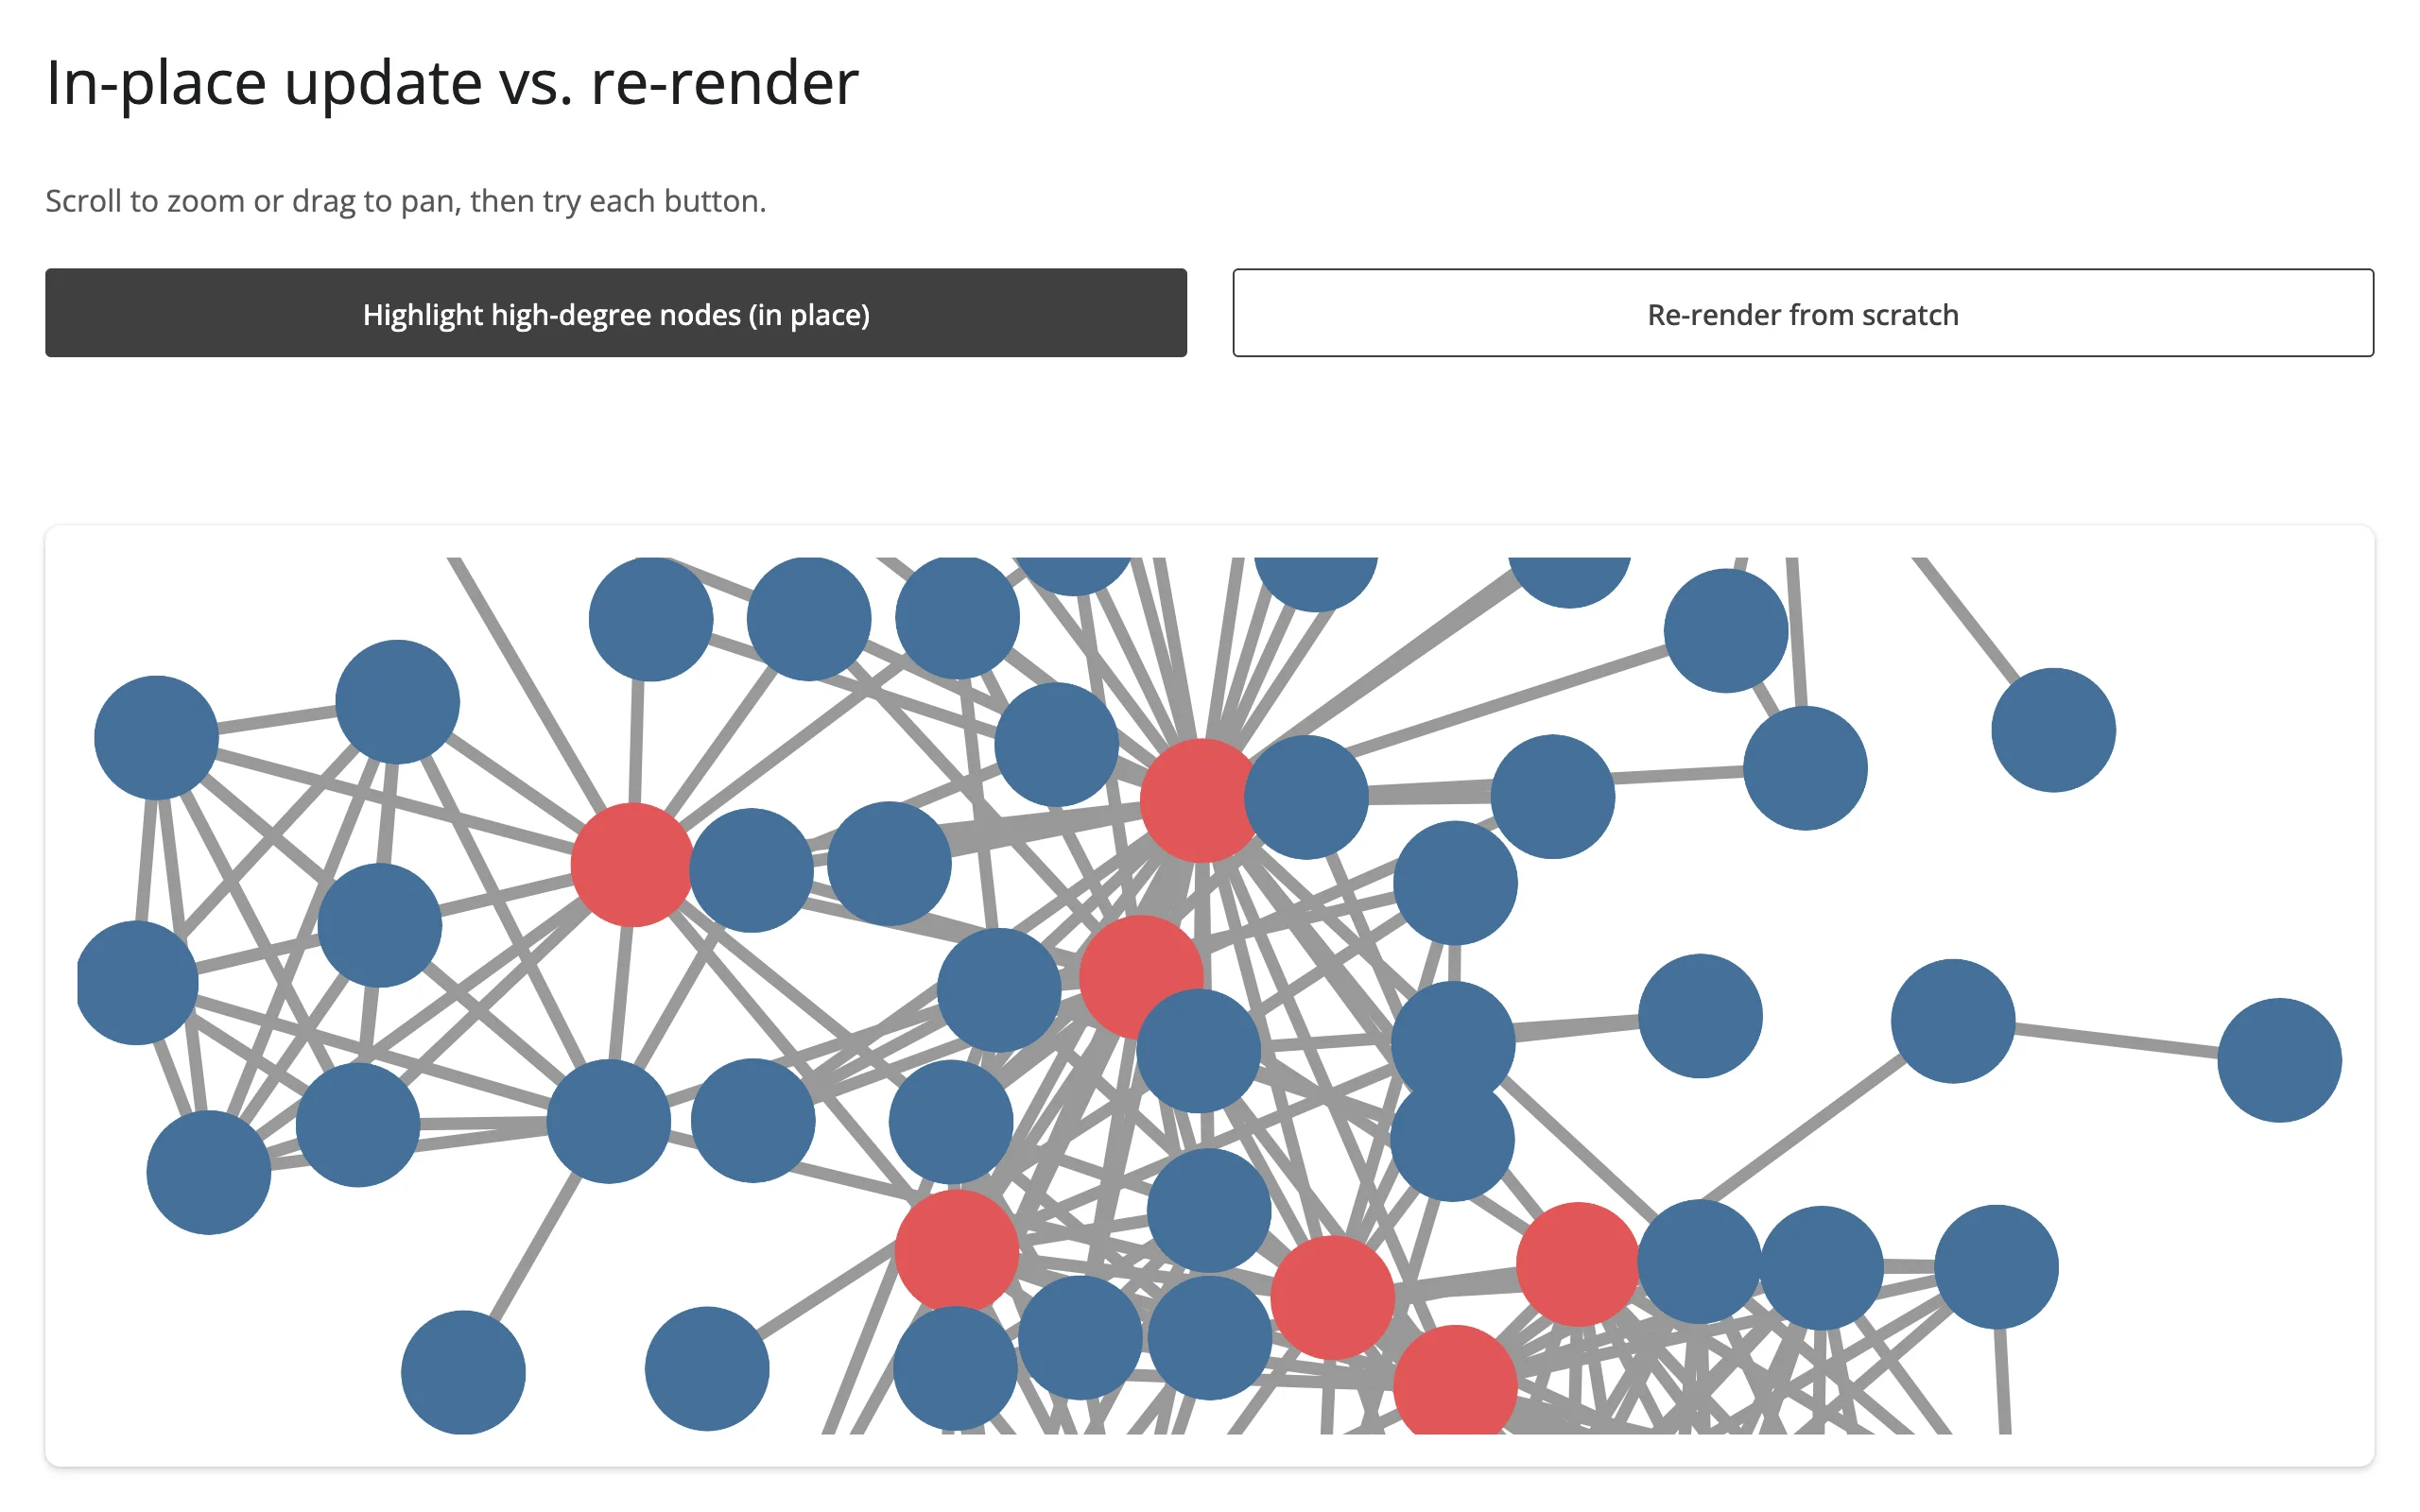
Because the widget lives on in the browser between renders, you can restyle it from Python without resending the graph or losing the user’s pan and zoom. The difference matters: re-rendering (returning a new value from the @render_ipycytoscape function) tears down and rebuilds every node and edge widget – recall each one is its own ipywidget – resets the camera to the layout’s default fit, and clears any classes you’d set. An in-place update (network.widget.<trait> = ..., called from a @reactive.effect) touches only what you change.
import networkx as nx
from ipycytoscape import CytoscapeWidget
from shiny import reactive
from shiny.express import input, ui
from shinywidgets import render_ipycytoscape

G = nx.les_miserables_graph()
STYLE = [
    {"selector": "node", "style": {"background-color": "#447099"}},
    {"selector": "node.highlight", "style": {"background-color": "#e15759"}},
]

ui.page_opts(title="In-place update vs. re-render", fillable=True)
ui.p("Scroll to zoom or drag to pan, then try each button.", class_="text-muted")
with ui.layout_columns(col_widths=[6, 6]):
    ui.input_action_button("highlight", "Highlight high-degree nodes (in place)")
    ui.input_action_button("rerender", "Re-render from scratch")

with ui.card(full_screen=True):

    @render_ipycytoscape
    def network():
        input.rerender()  # only this button forces a full rebuild
        widget = CytoscapeWidget(G)
        widget.set_style(STYLE)
        widget.set_layout(name="cose")
        return widget

    @reactive.effect
    @reactive.event(input.highlight)
    def _():
        # Toggles a class on each node: no re-render, no relayout, so the
        # user's current pan/zoom is untouched
        for node in network.widget.graph.nodes:
            node.classes = "highlight" if G.degree(node.data["id"]) >= 15 else ""
Zoomed in, then highlighted in place (same pan/zoom):
After “re-render from scratch” (camera reset to the default fit, highlight lost):
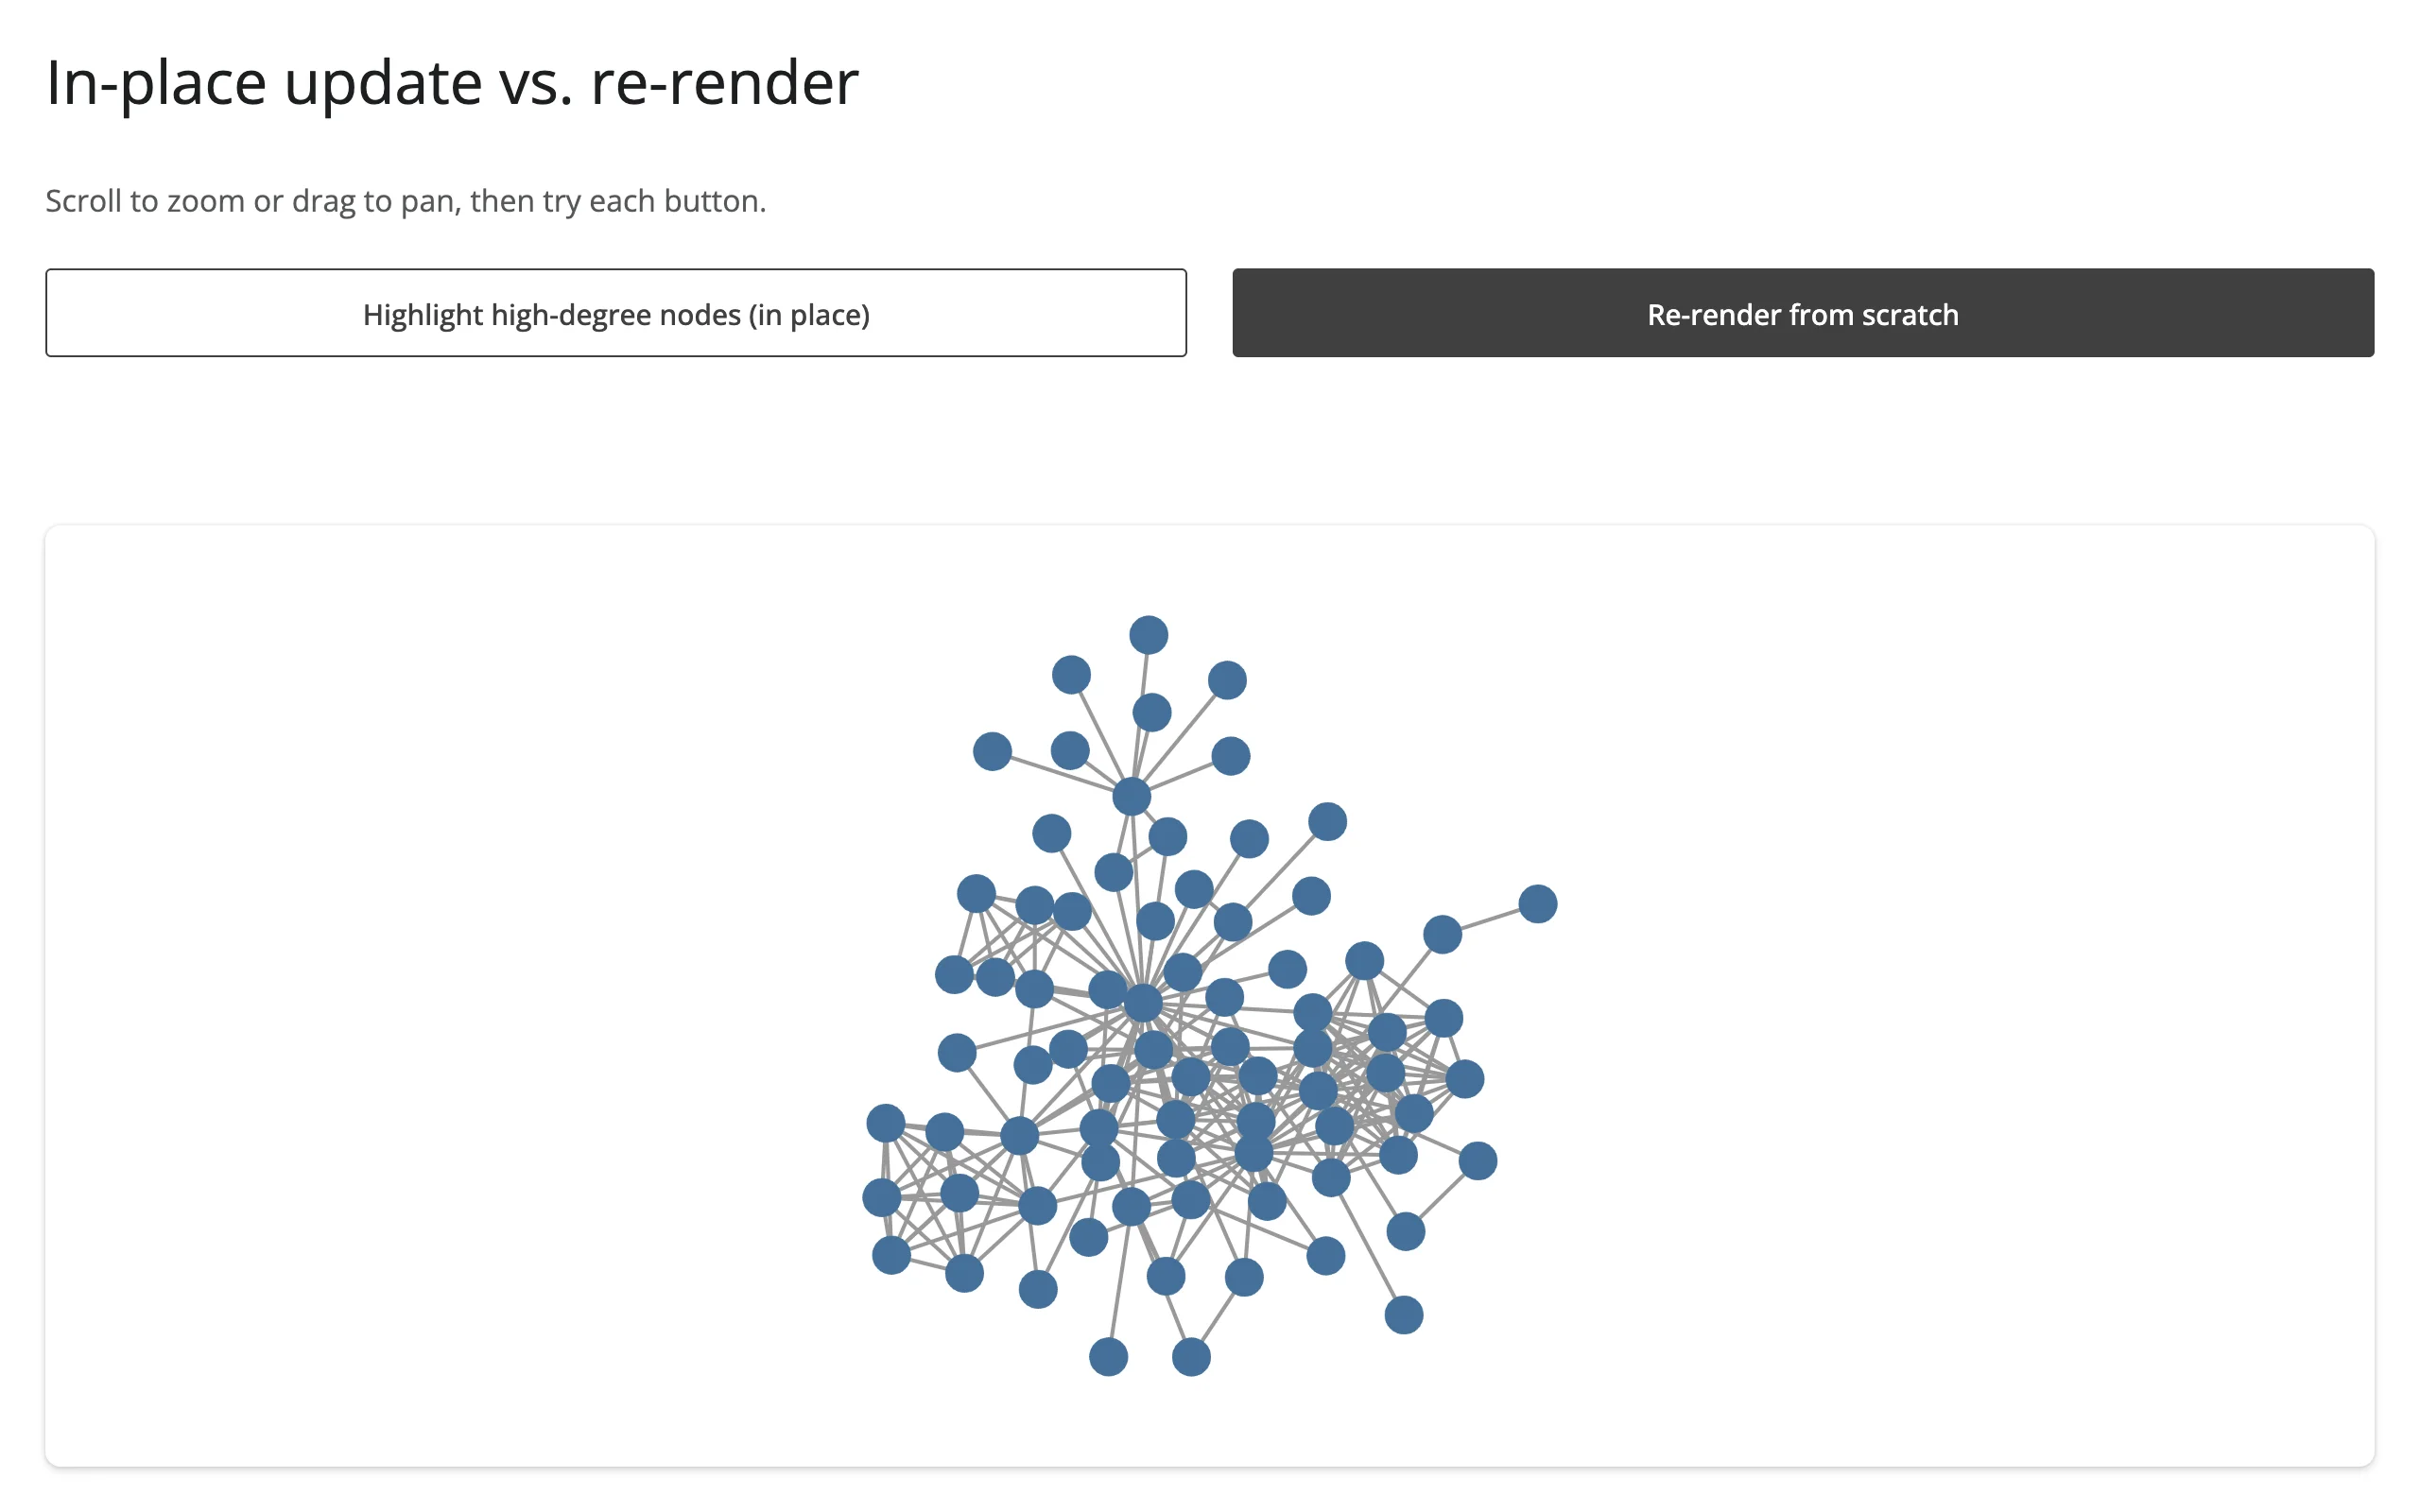
Verified directly: reading cytoscape_obj.zoom() through the browser’s live widget manager held at exactly 2.2 across the in-place highlight, then reset to the layout’s default fit (~0.7) after the re-render button.
Use in-place updates for anything the user is actively exploring (styling, classes, layout tweaks, selection handling); reserve re-rendering for when the underlying data actually changes shape (different graph, different node set).
Coordinating multiple views
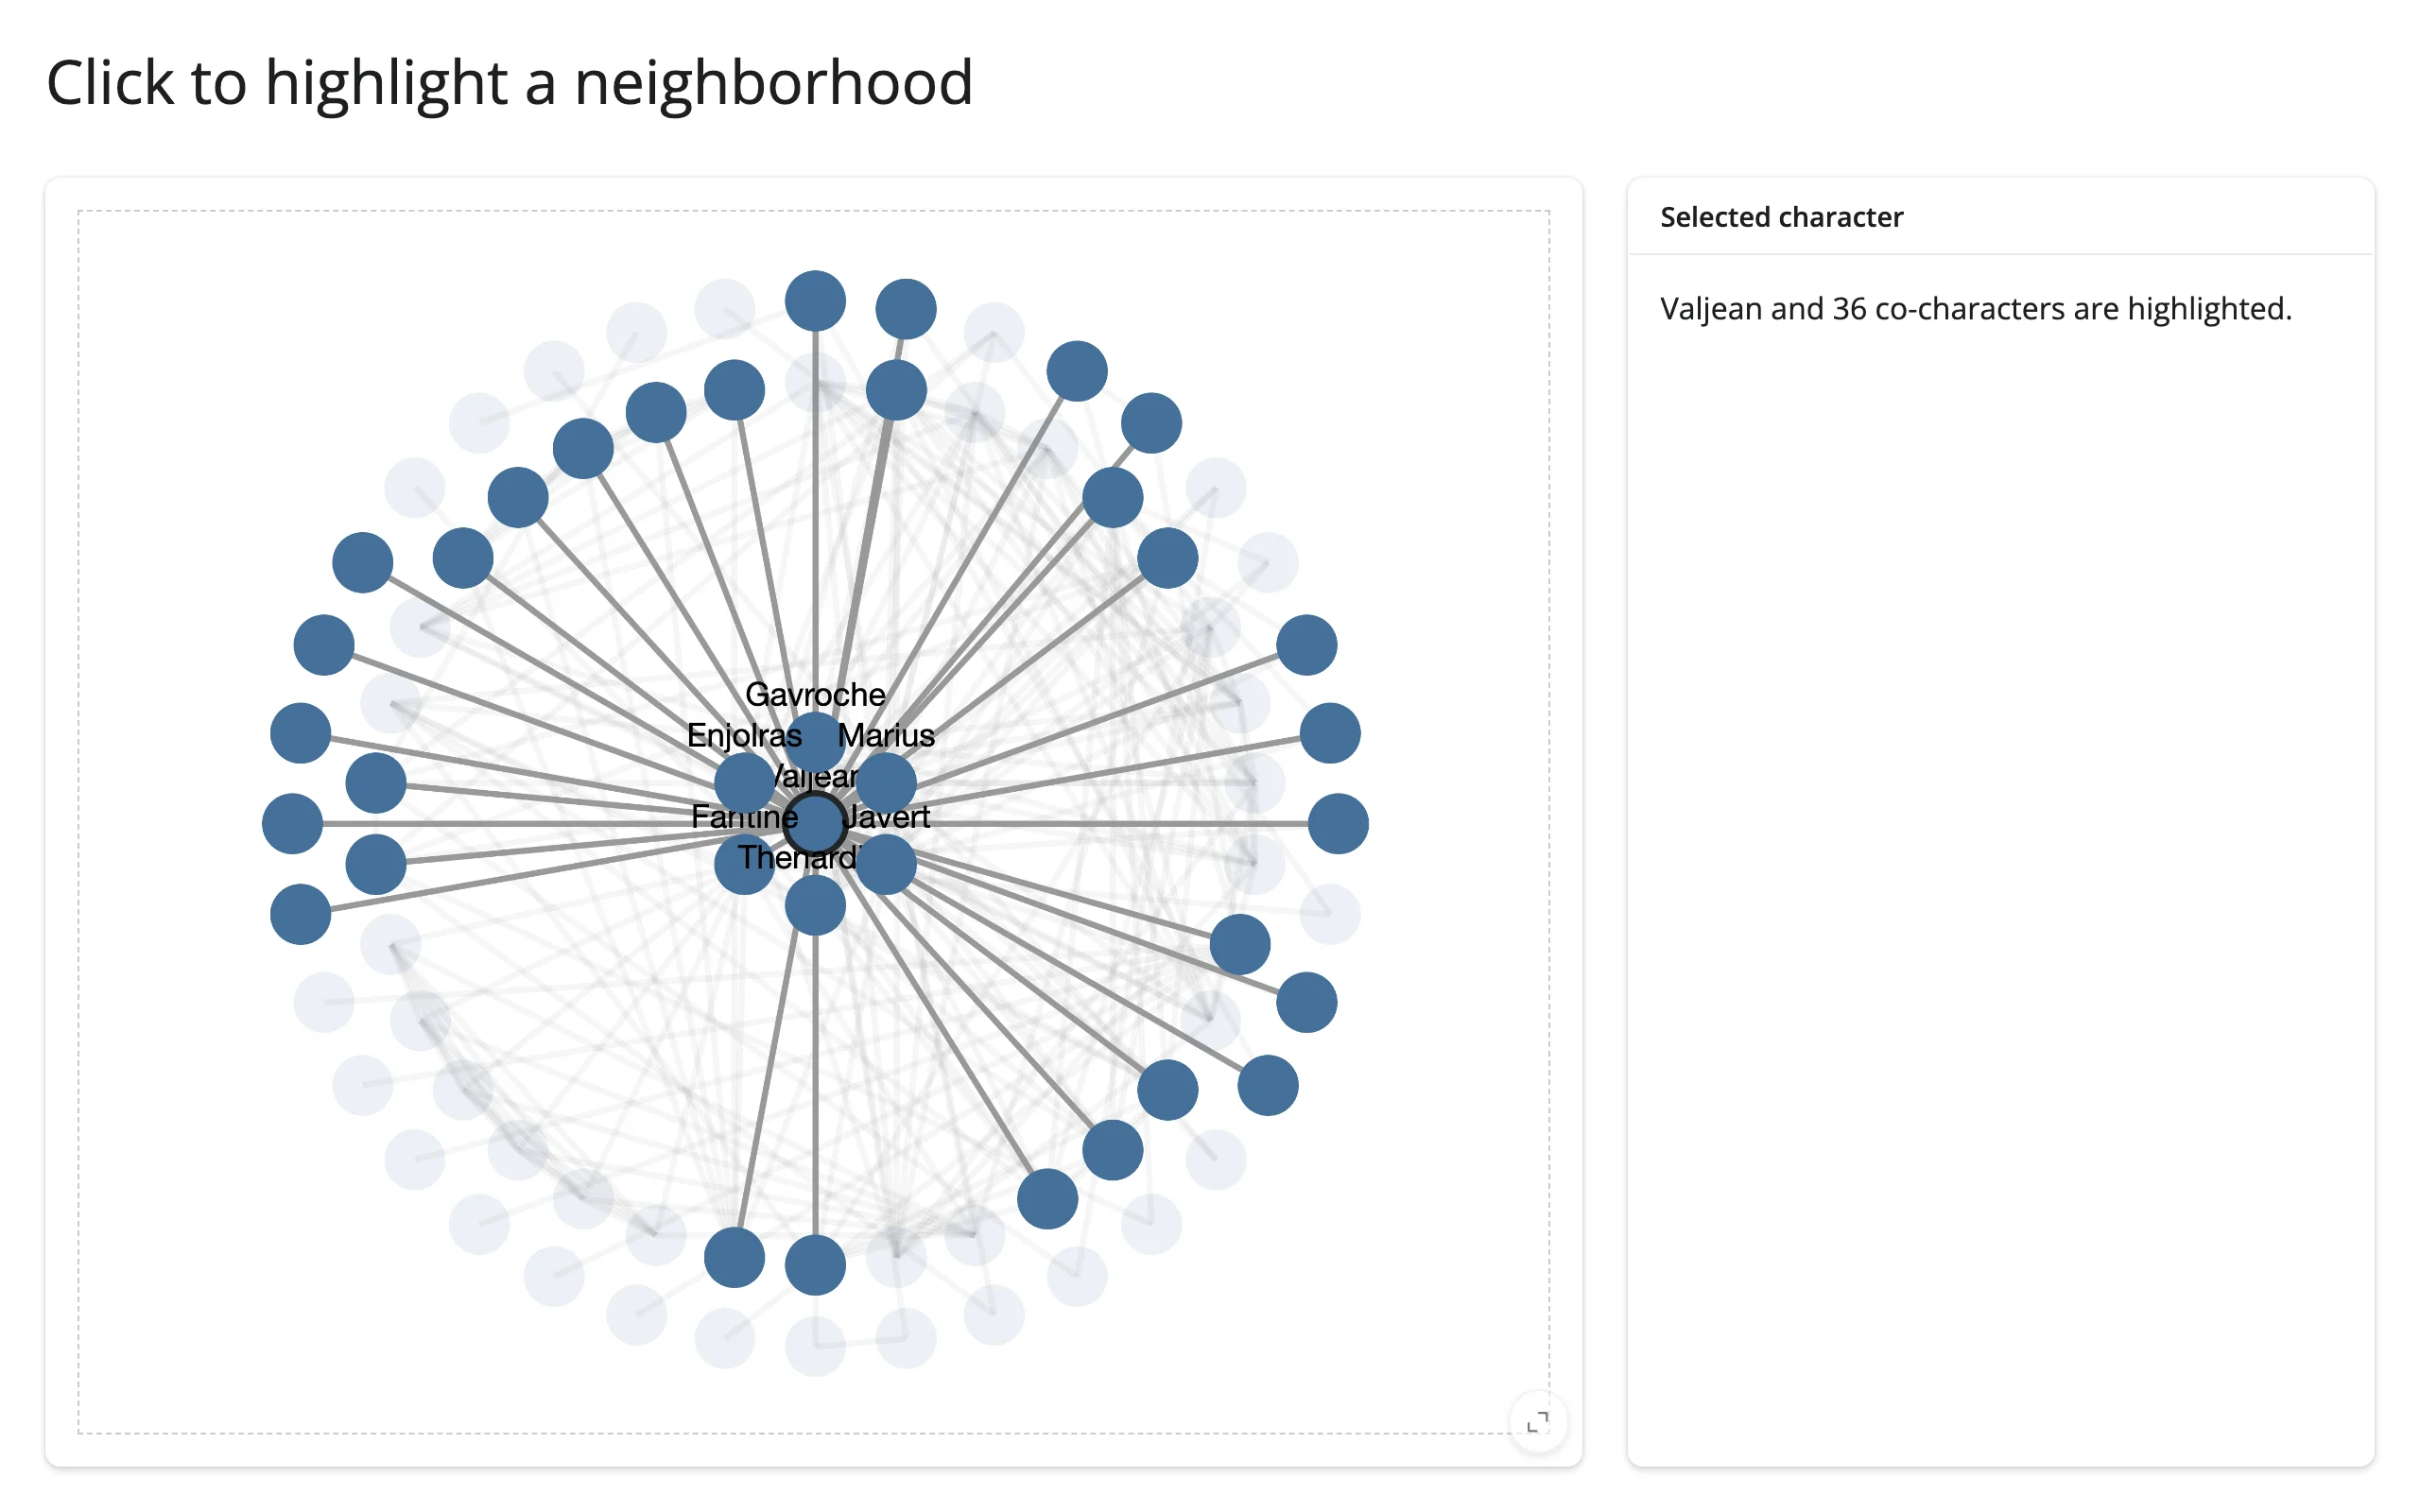
Click a node, highlight its neighborhood
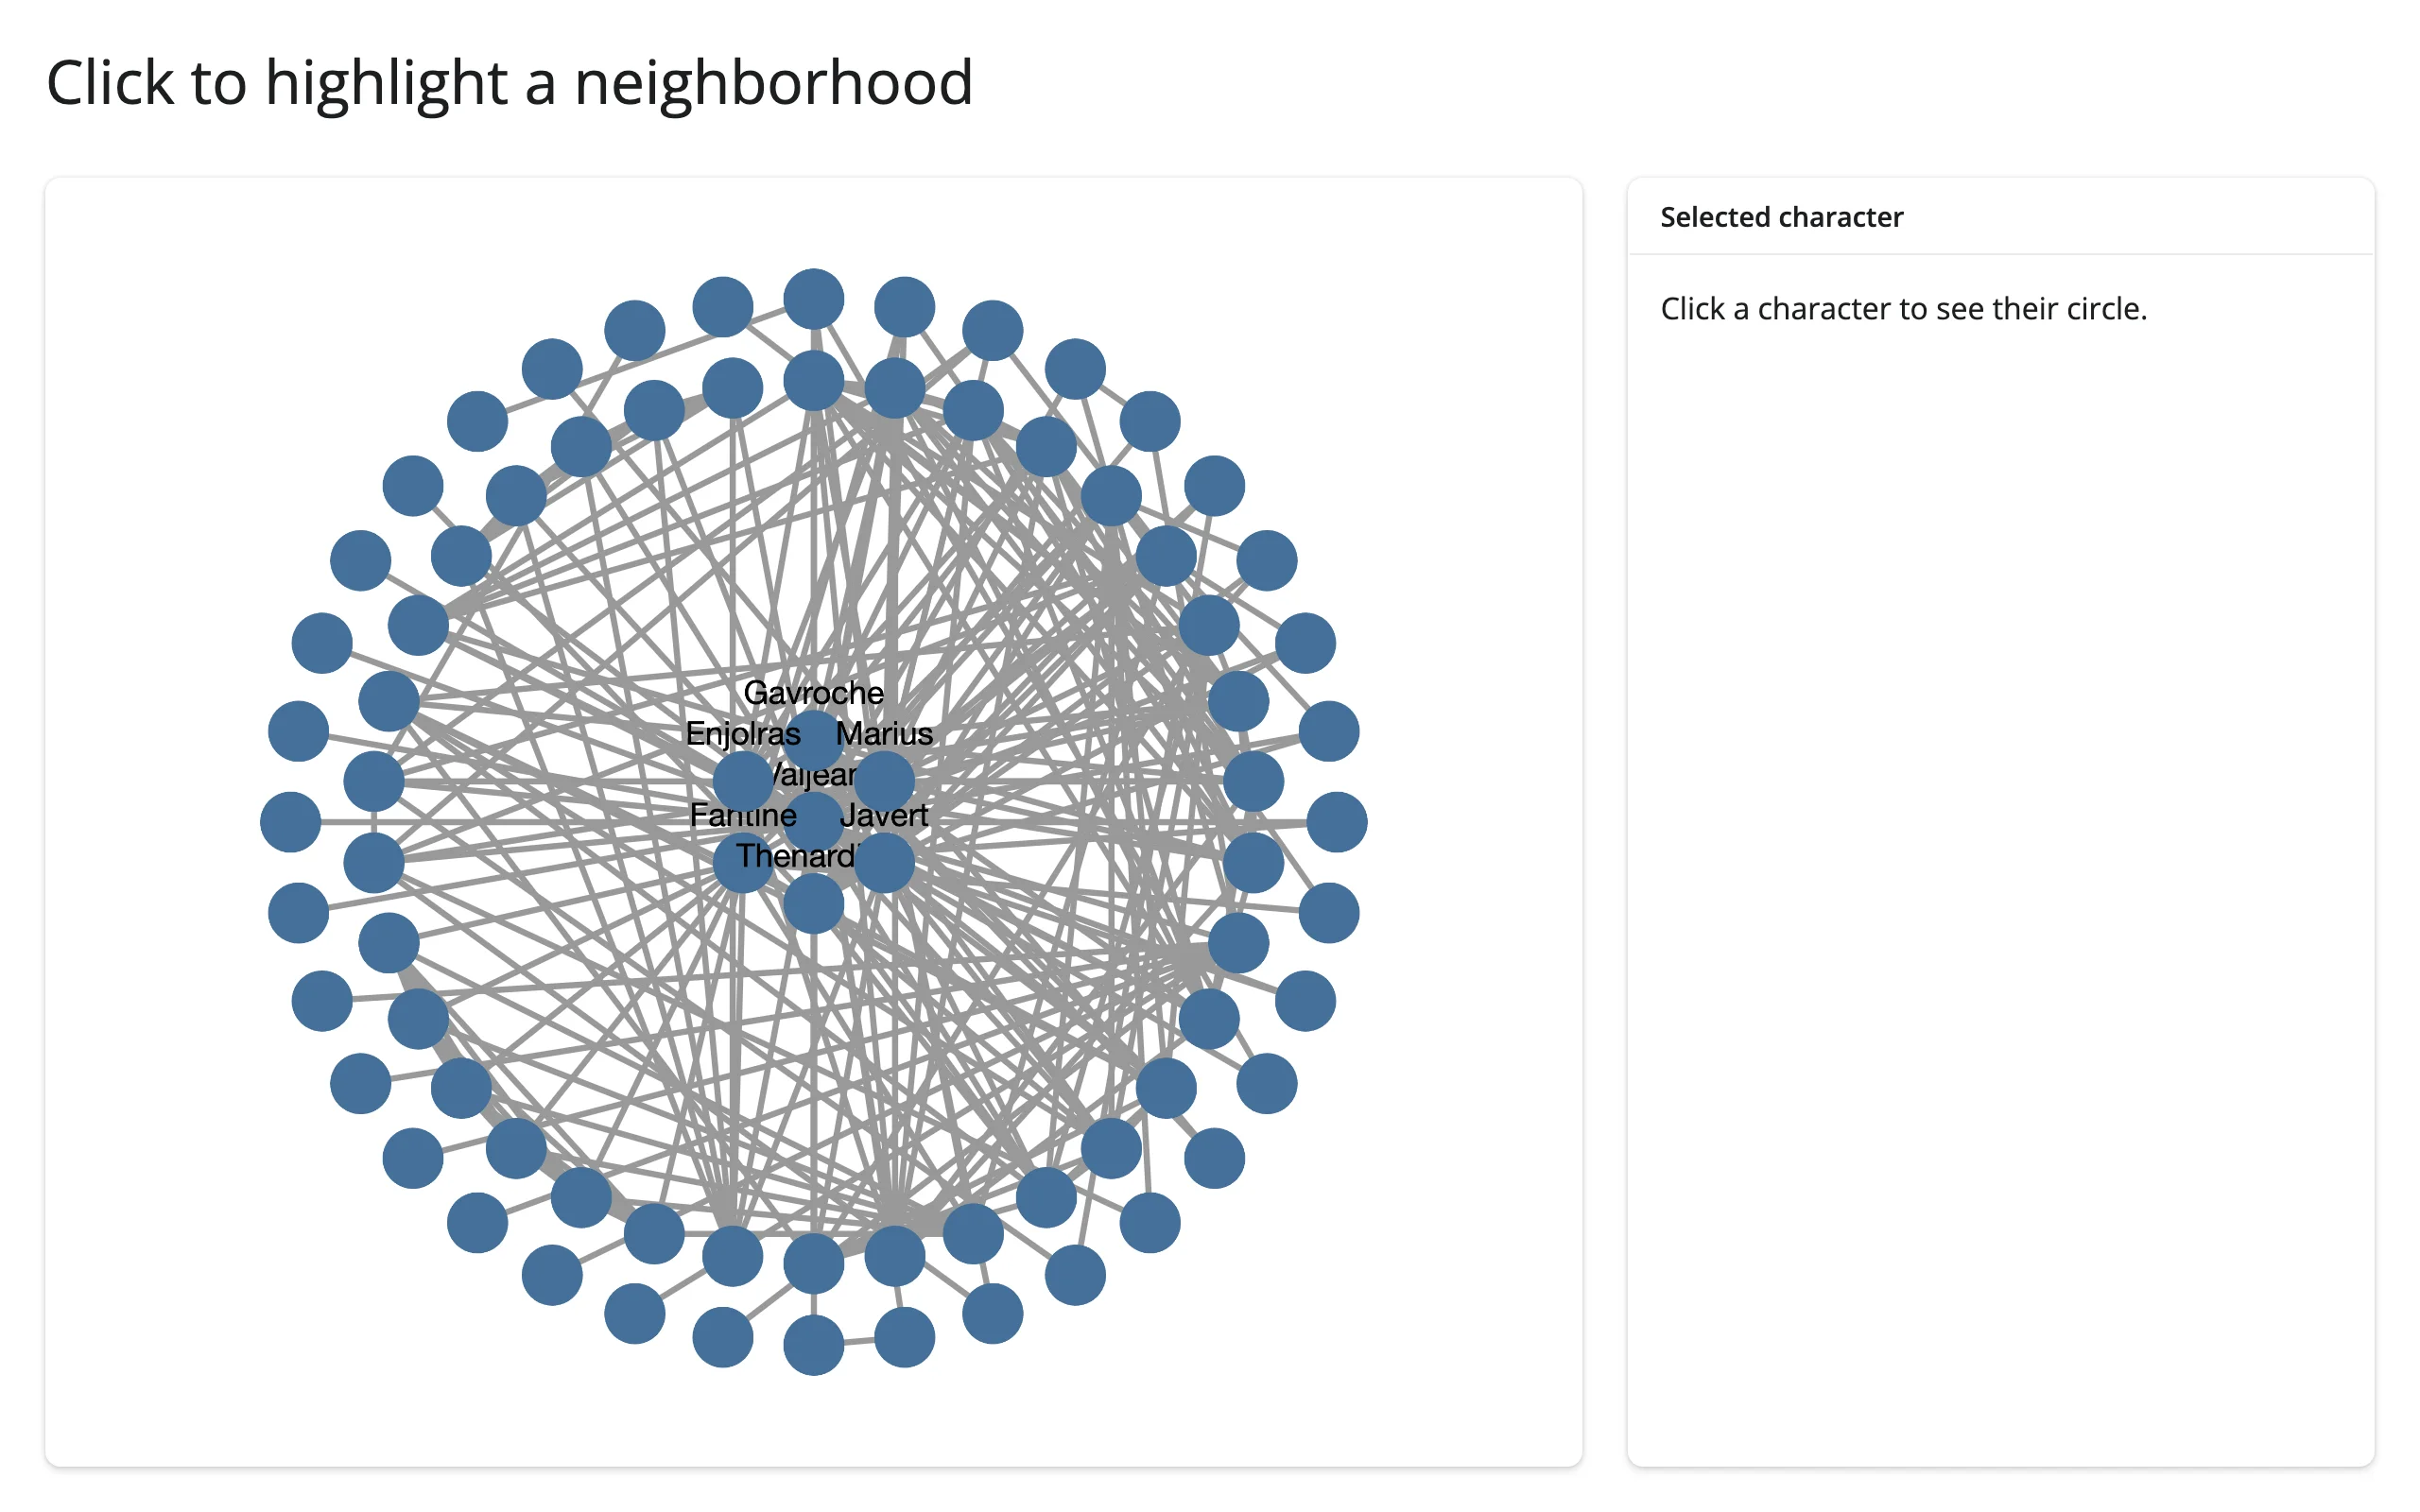
Combining clicked_node() with a restyle effect gives you a “focus” interaction: fade everything except the clicked node and its neighbors, without ever re-running the layout.
import networkx as nx
from ipycytoscape import CytoscapeWidget
from shiny import reactive
from shiny.express import render, ui
from shinywidgets import render_ipycytoscape

G = nx.les_miserables_graph()
STYLE = [
    {"selector": "node", "style": {"background-color": "#447099"}},
    {"selector": "node[degree >= 15]", "style": {"label": "data(id)"}},
    {"selector": ".faded", "style": {"opacity": 0.1, "text-opacity": 0}},
    {"selector": "node.focus", "style": {"border-width": 3, "border-color": "#212529"}},
]
for n in G.nodes:
    G.nodes[n]["degree"] = G.degree(n)

ui.page_opts(title="Click to highlight a neighborhood", fillable=True)

with ui.layout_columns(col_widths=[8, 4]):
    with ui.card(full_screen=True):

        @render_ipycytoscape
        def network():
            widget = CytoscapeWidget(G)
            widget.set_style(STYLE)
            widget.set_layout(name="concentric")
            return widget

    with ui.card():
        ui.card_header("Selected character")

        @render.ui
        def detail():
            clicked = network.clicked_node()
            if clicked is None:
                return ui.p("Click a character to see their circle.")
            name = clicked["data"]["id"]
            return ui.p(f"{name} and {G.degree(name)} co-characters are highlighted.")

    @reactive.effect
    def _():
        # Restyle in place by toggling classes: the layout never reruns and
        # the user's pan/zoom is kept
        clicked = network.clicked_node()
        center = clicked["data"]["id"] if clicked else None
        focus = {center, *G[center]} if center else set()
        for node in network.widget.graph.nodes:
            name = node.data["id"]
            if not focus:
                node.classes = ""
            else:
                node.classes = (
                    "focus" if name == center else "" if name in focus else "faded"
                )
        for edge in network.widget.graph.edges:
            s, t = edge.data["source"], edge.data["target"]
edge.classes = "" if not focus or center in (s, t) else "faded"| Before | After clicking Valjean |
|---|---|
 |
 |
Shortest path between two picks
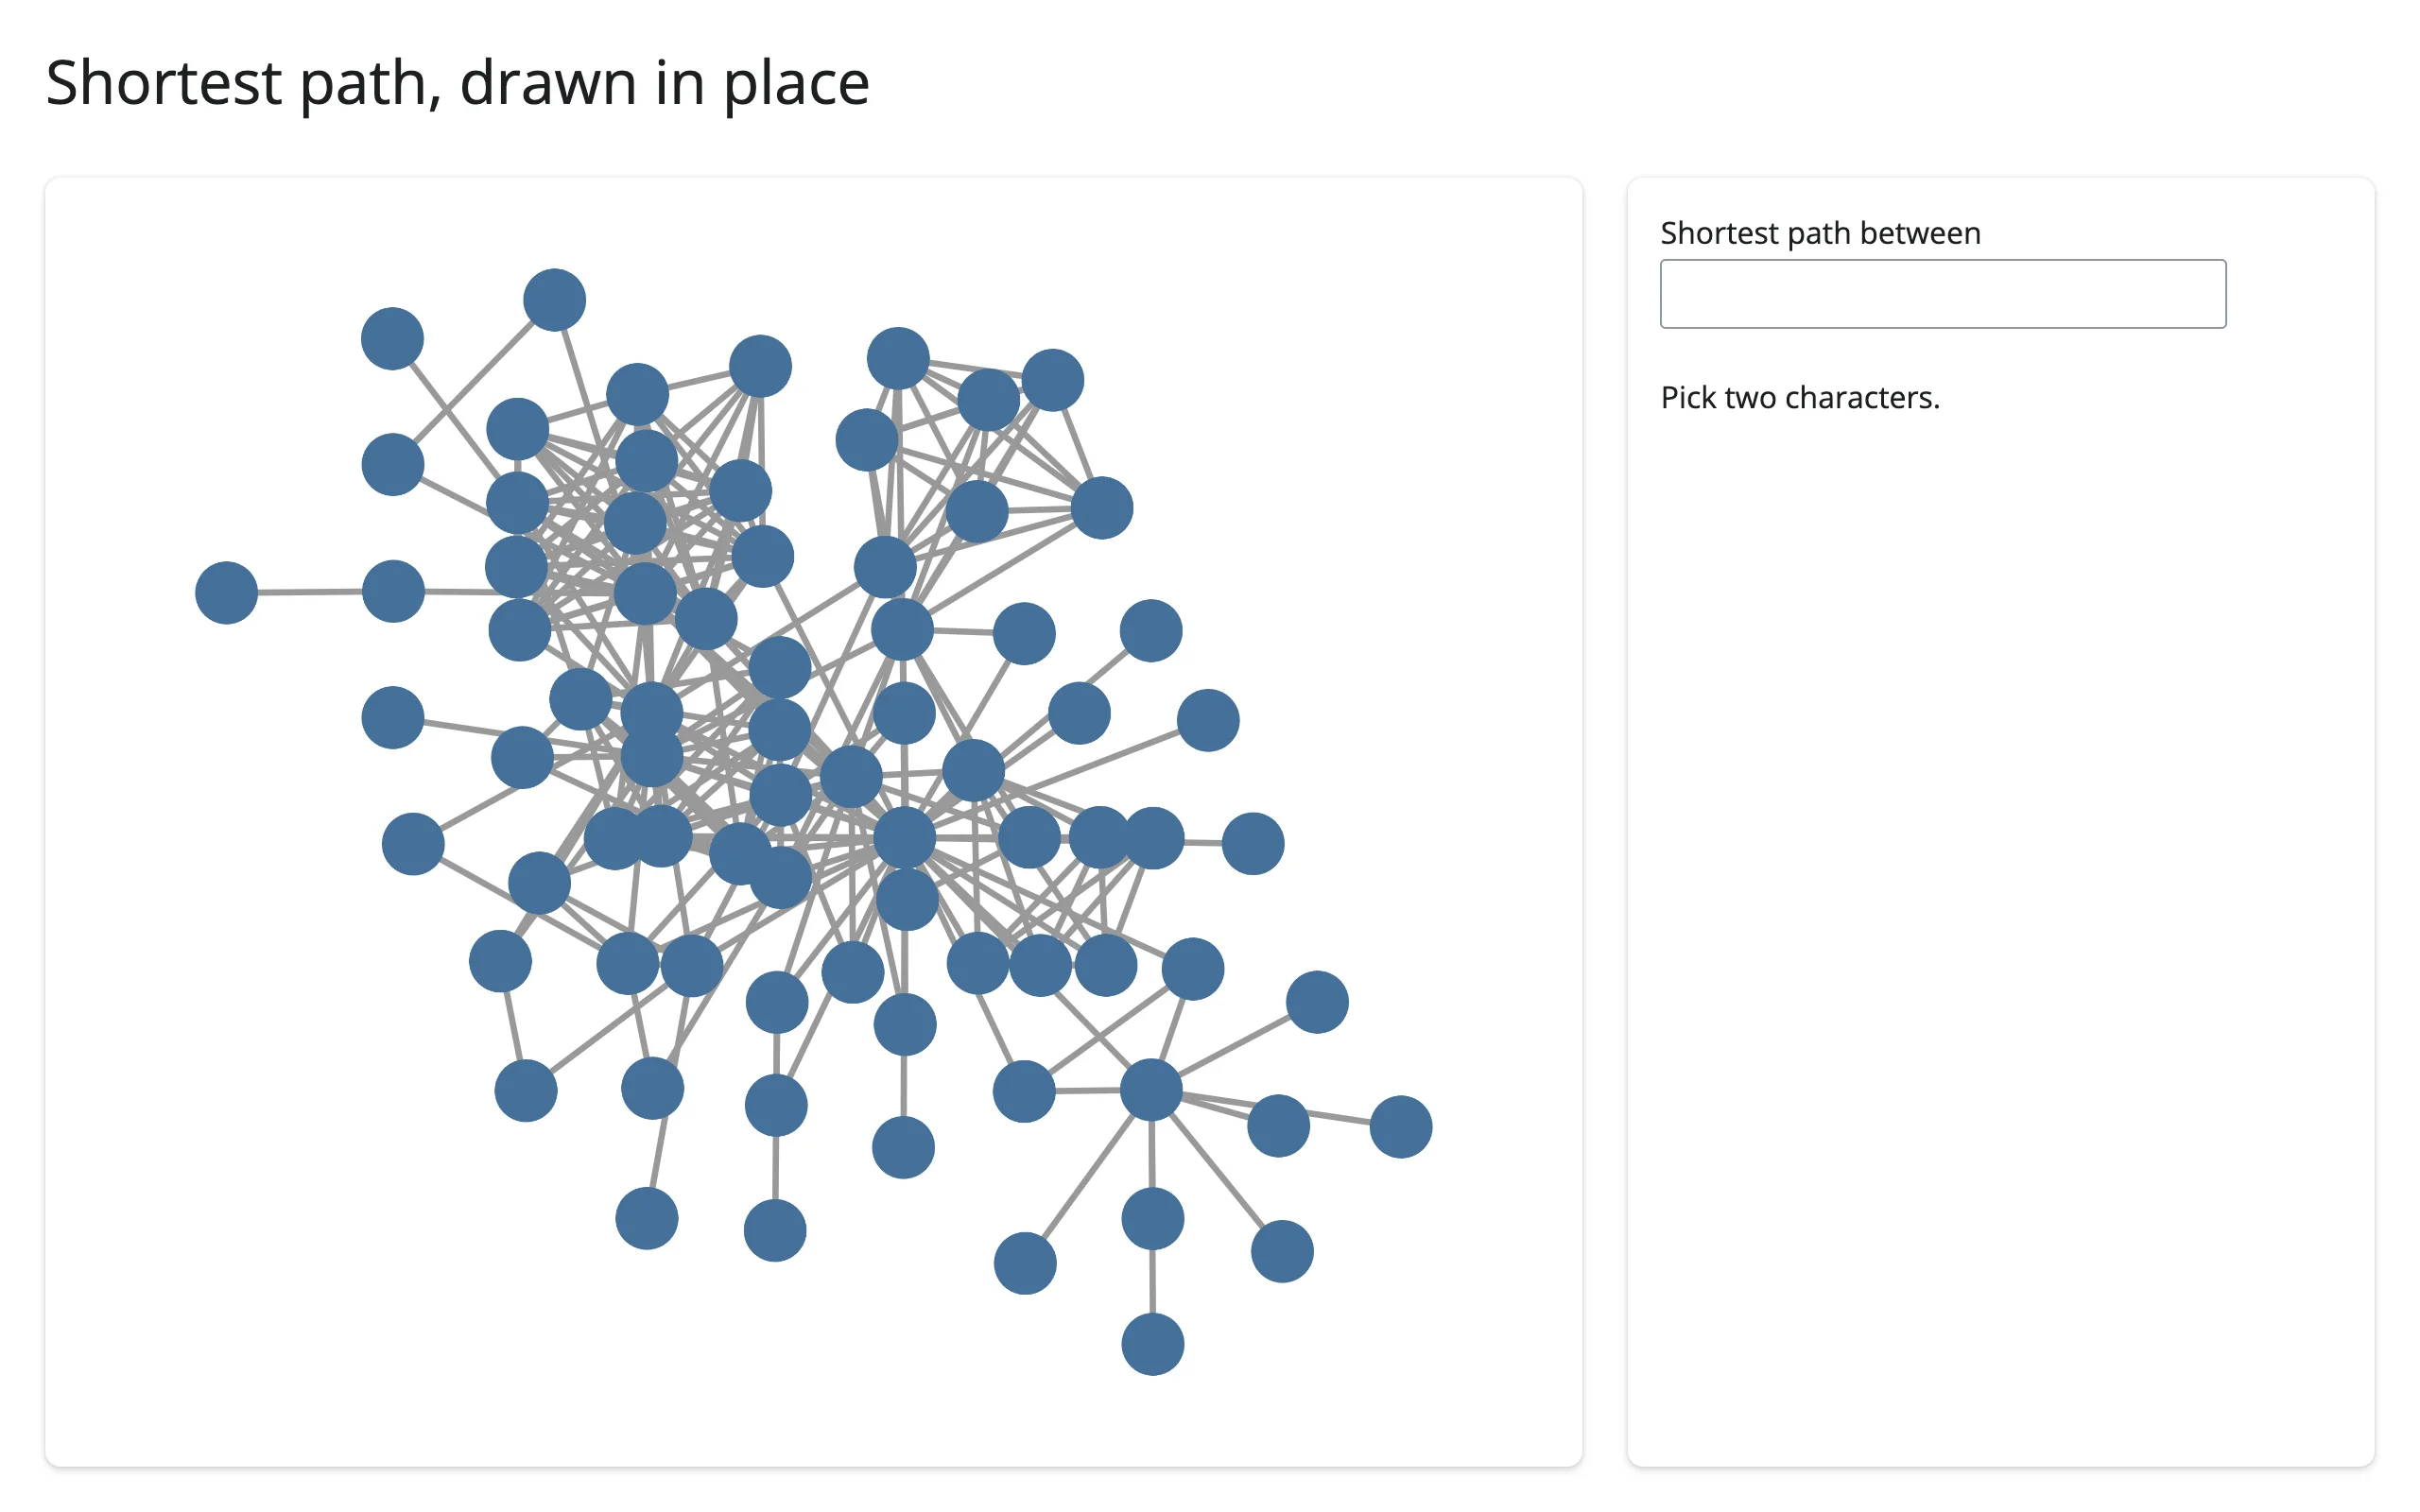
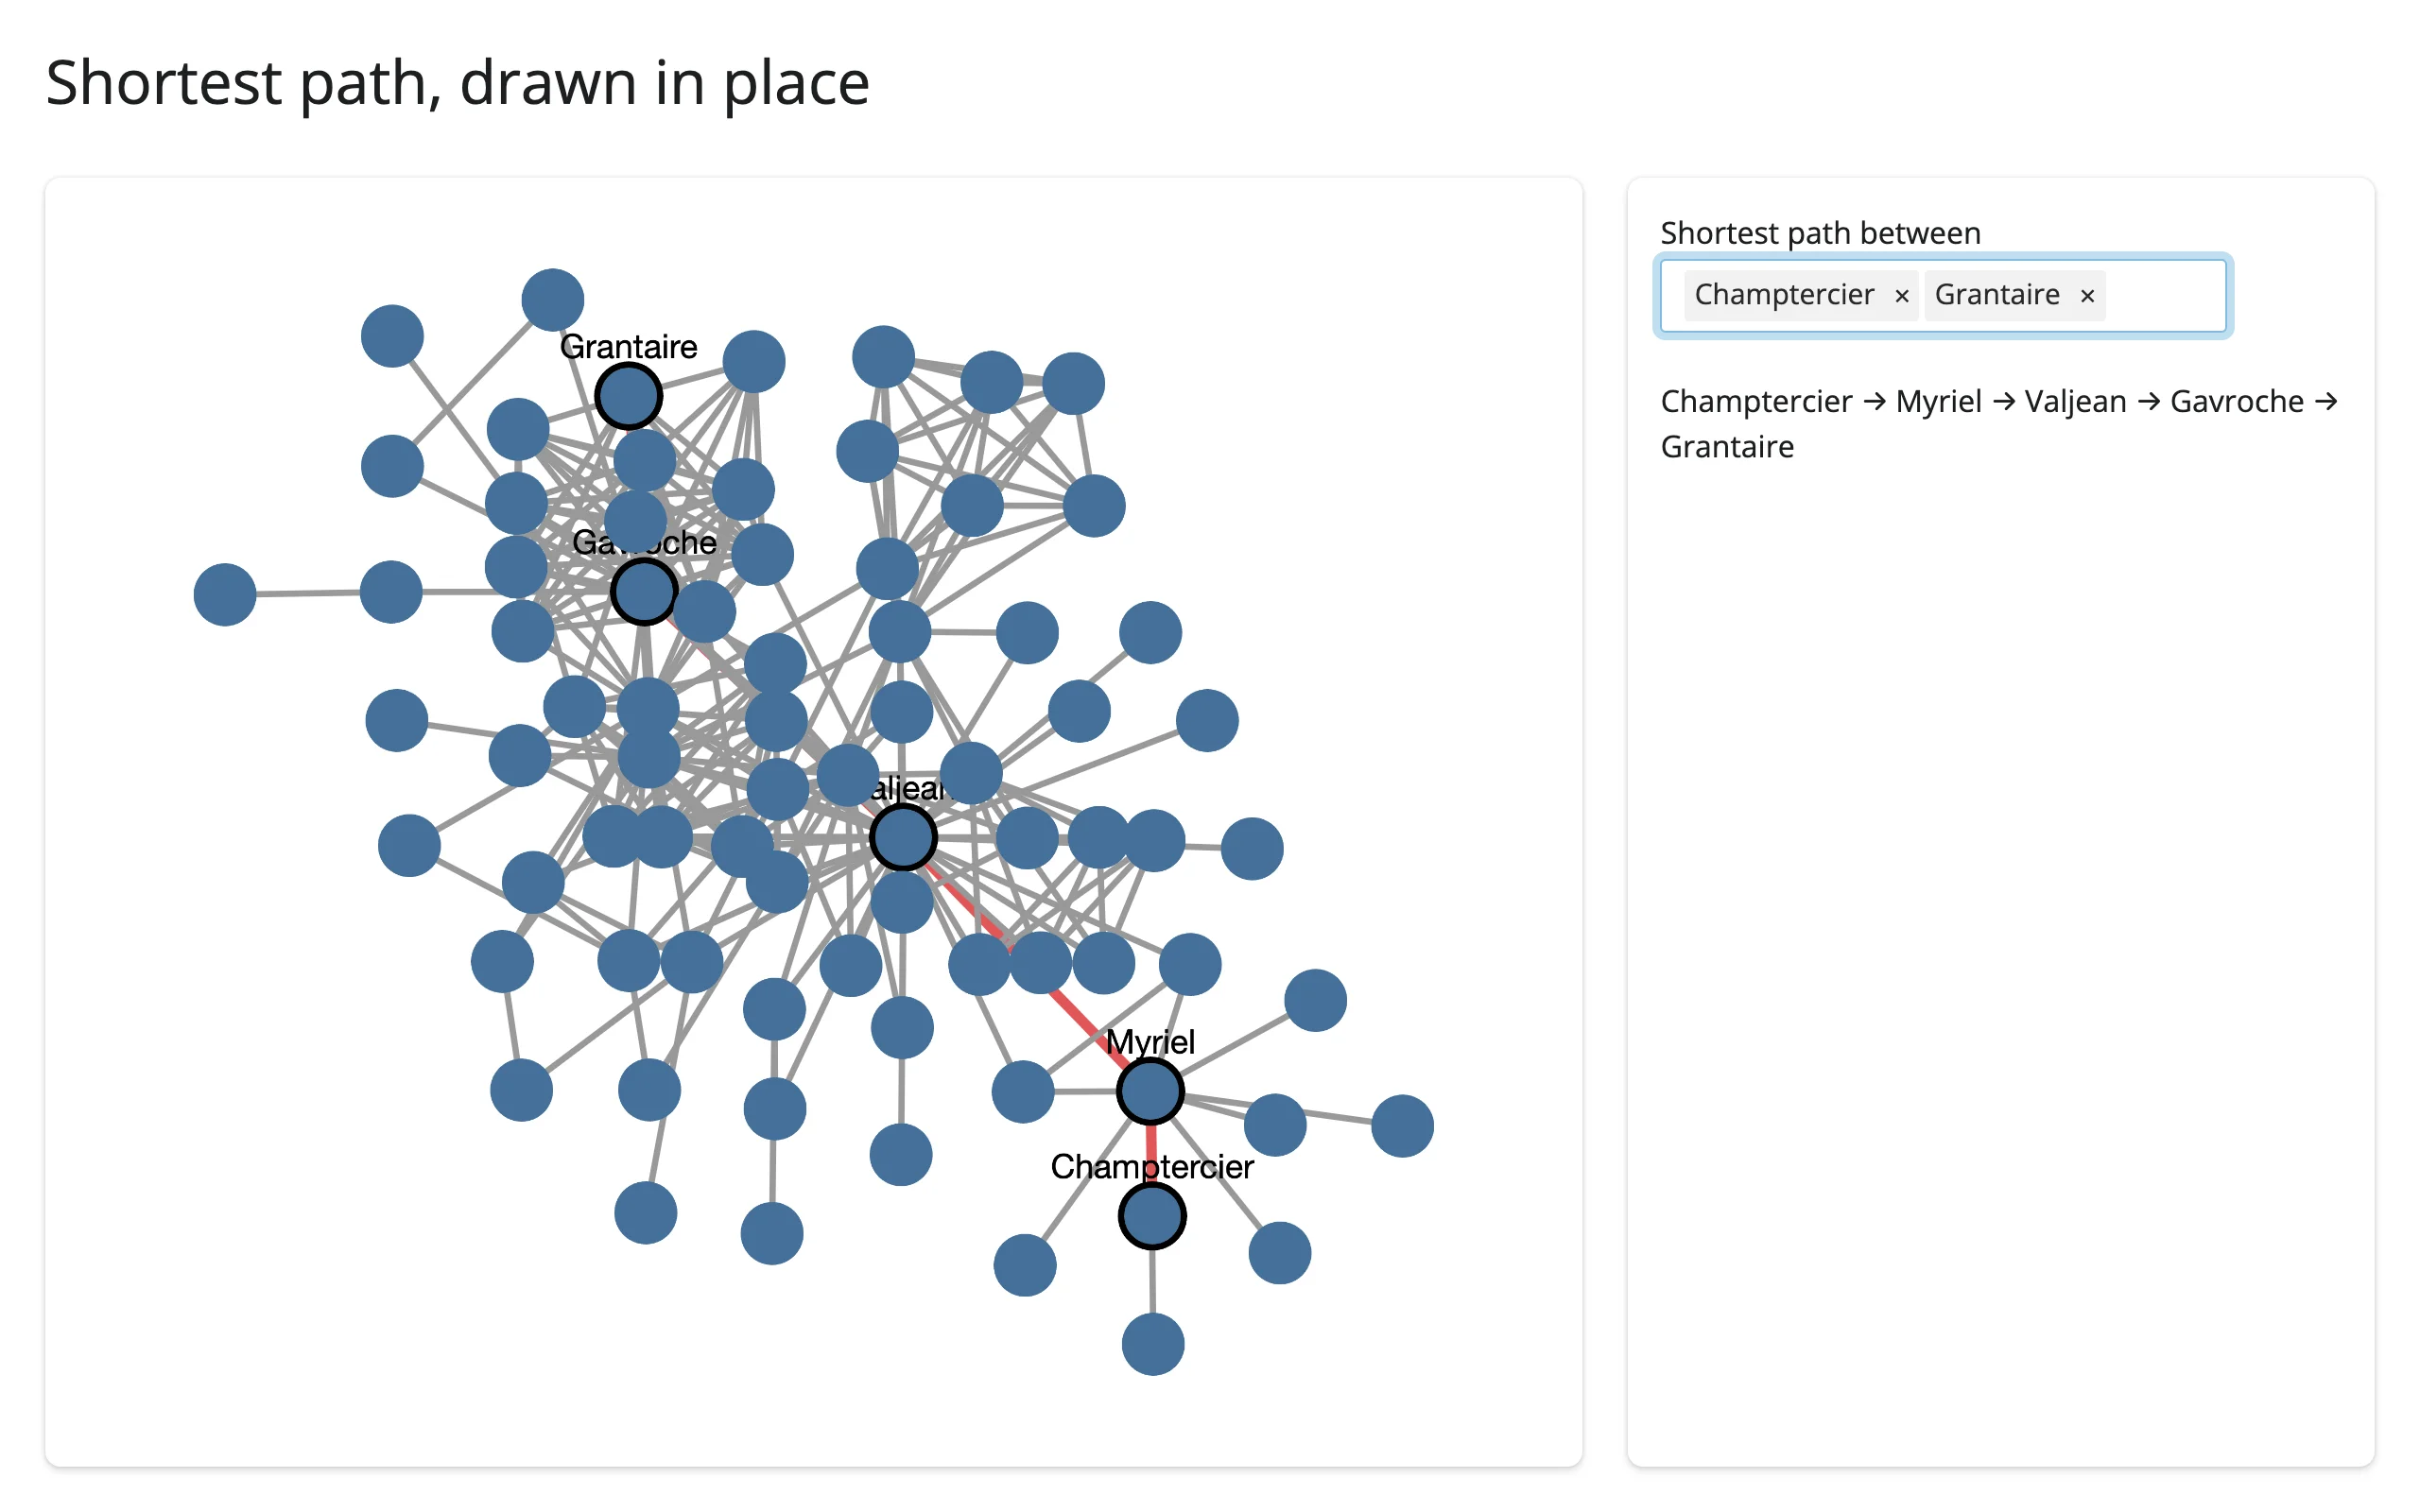
A pair of input_selectize() values feeds nx.shortest_path(); the result is drawn by toggling a path class, not by re-rendering.
import networkx as nx
from ipycytoscape import CytoscapeWidget
from shiny import reactive
from shiny.express import input, render, ui
from shinywidgets import render_ipycytoscape

G = nx.les_miserables_graph()
CHARACTERS = sorted(G.nodes)
STYLE = [
    {"selector": "node", "style": {"background-color": "#447099"}},
    {"selector": "node.path", "style": {"label": "data(id)", "border-width": 3}},
    {"selector": "edge.path", "style": {"line-color": "#e15759", "width": 5}},
]

ui.page_opts(title="Shortest path, drawn in place", fillable=True)

with ui.layout_columns(col_widths=[8, 4]):
    with ui.card(full_screen=True):

        @render_ipycytoscape
        def network():
            widget = CytoscapeWidget(G)
            widget.set_style(STYLE)
            widget.set_layout(name="cose")
            return widget

    with ui.card():
        ui.input_selectize(
            "ends",
            "Shortest path between",
            CHARACTERS,
            multiple=True,
            options={"maxItems": 2},
        )

        @render.ui
        def info():
            if len(input.ends()) != 2:
                return ui.p("Pick two characters.")
            return ui.p(" → ".join(path()))


@reactive.calc
def path() -> list[str]:
    ends = input.ends()
    if len(ends) != 2:
        return []
    return nx.shortest_path(G, *ends)


@reactive.effect
def _():
    # No re-render and no relayout: only each element's classes change
    p = set(path())
    on_path_edges = set(zip(path(), path()[1:])) | set(zip(path()[1:], path()))
    for node in network.widget.graph.nodes:
        node.classes = "path" if node.data["id"] in p else ""
    for edge in network.widget.graph.edges:
        key = (edge.data["source"], edge.data["target"])
edge.classes = "path" if key in on_path_edges else ""| Before | After picking Champtercier / Grantaire |
|---|---|
 |
 |
Filter from a slider without losing the layout
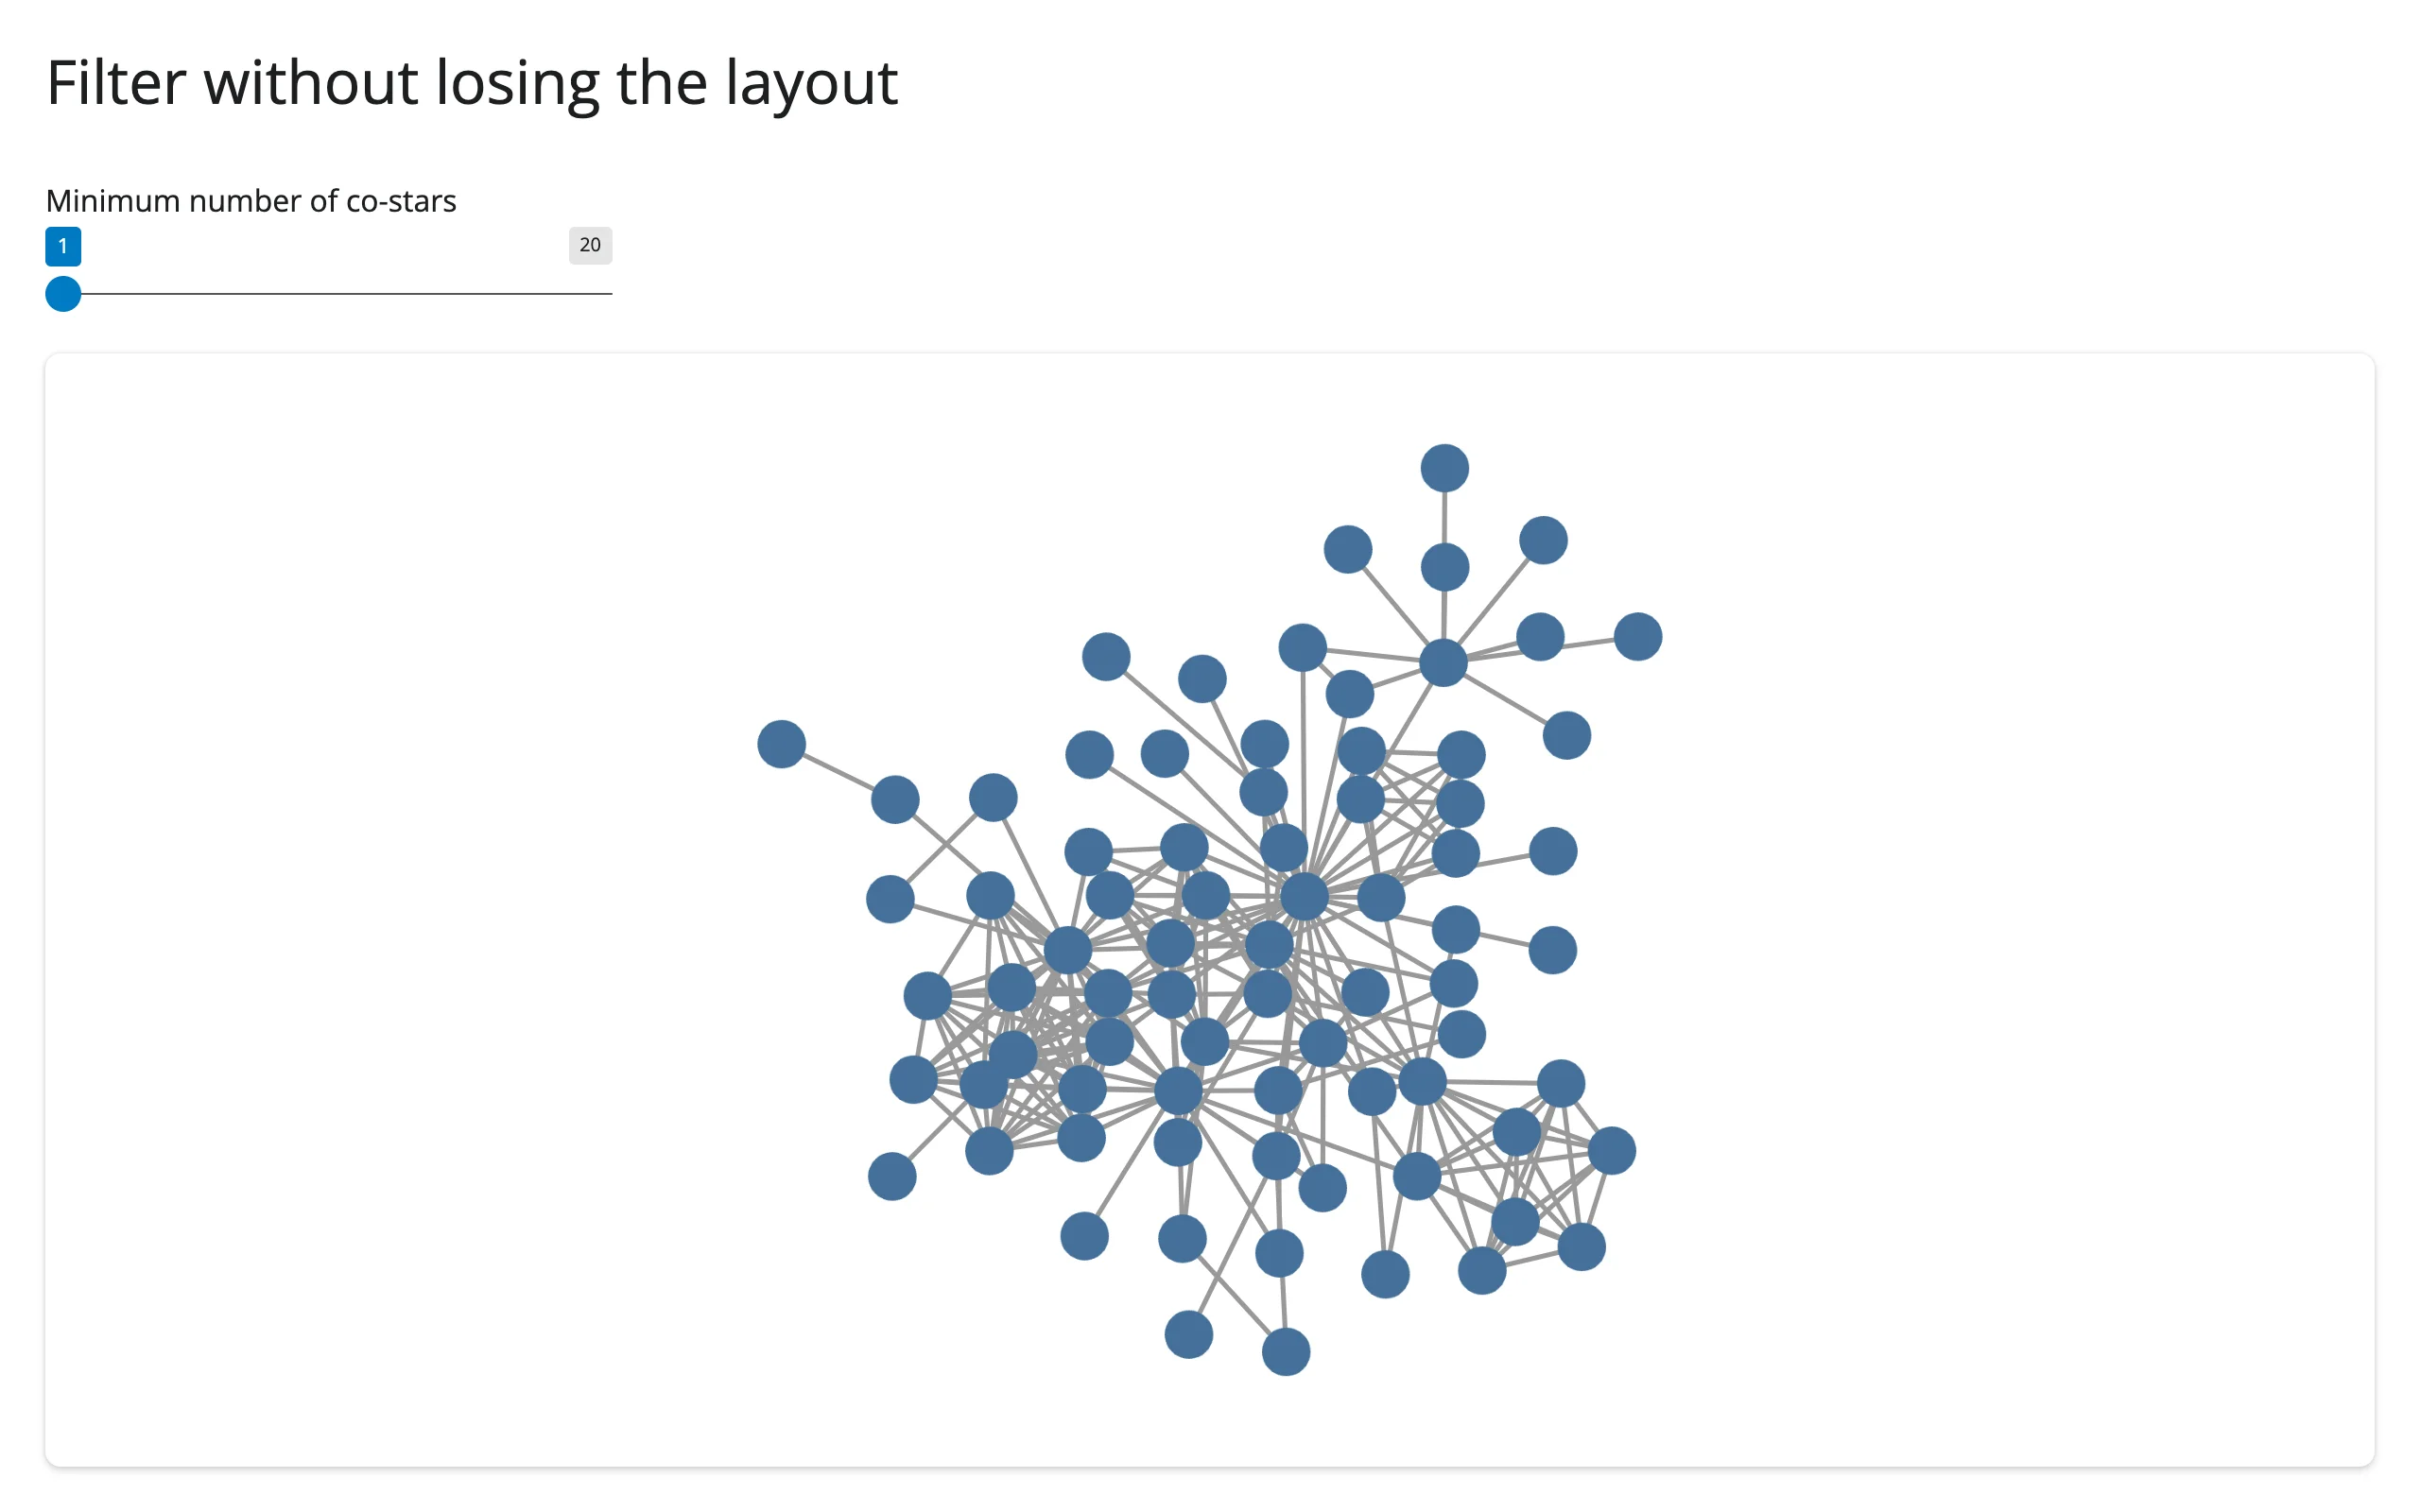
A force-directed layout is expensive to compute and meaningful positions take a moment to settle, so you don’t want to re-run it every time a filter changes. Hiding elements with a display: none style class – rather than removing them from the graph – keeps every remaining node exactly where it was.
import networkx as nx
from ipycytoscape import CytoscapeWidget
from shiny import reactive
from shiny.express import input, ui
from shinywidgets import render_ipycytoscape

G = nx.les_miserables_graph()
for n in G.nodes:
    G.nodes[n]["degree"] = G.degree(n)
STYLE = [
    {"selector": "node", "style": {"background-color": "#447099"}},
    {"selector": ".hidden", "style": {"display": "none"}},
]

ui.page_opts(title="Filter without losing the layout", fillable=True)
ui.input_slider("min_degree", "Minimum number of co-stars", 1, 20, 1)

with ui.card(full_screen=True):

    @render_ipycytoscape
    def network():
        widget = CytoscapeWidget(G)
        widget.set_style(STYLE)
        widget.set_layout(name="cose")  # computed once, from the full graph
        return widget

    @reactive.effect
    def _():
        # Hiding elements (not removing them) keeps every node's position, so
        # raising the slider back down instantly restores the full layout
        shown = {n for n in G if G.nodes[n]["degree"] >= input.min_degree()}
        for node in network.widget.graph.nodes:
            node.classes = "" if node.data["id"] in shown else "hidden"
        for edge in network.widget.graph.edges:
            s, t = edge.data["source"], edge.data["target"]
edge.classes = "" if s in shown and t in shown else "hidden"| Before (all 77 characters) | After raising the slider to 11 |
|---|---|
 |
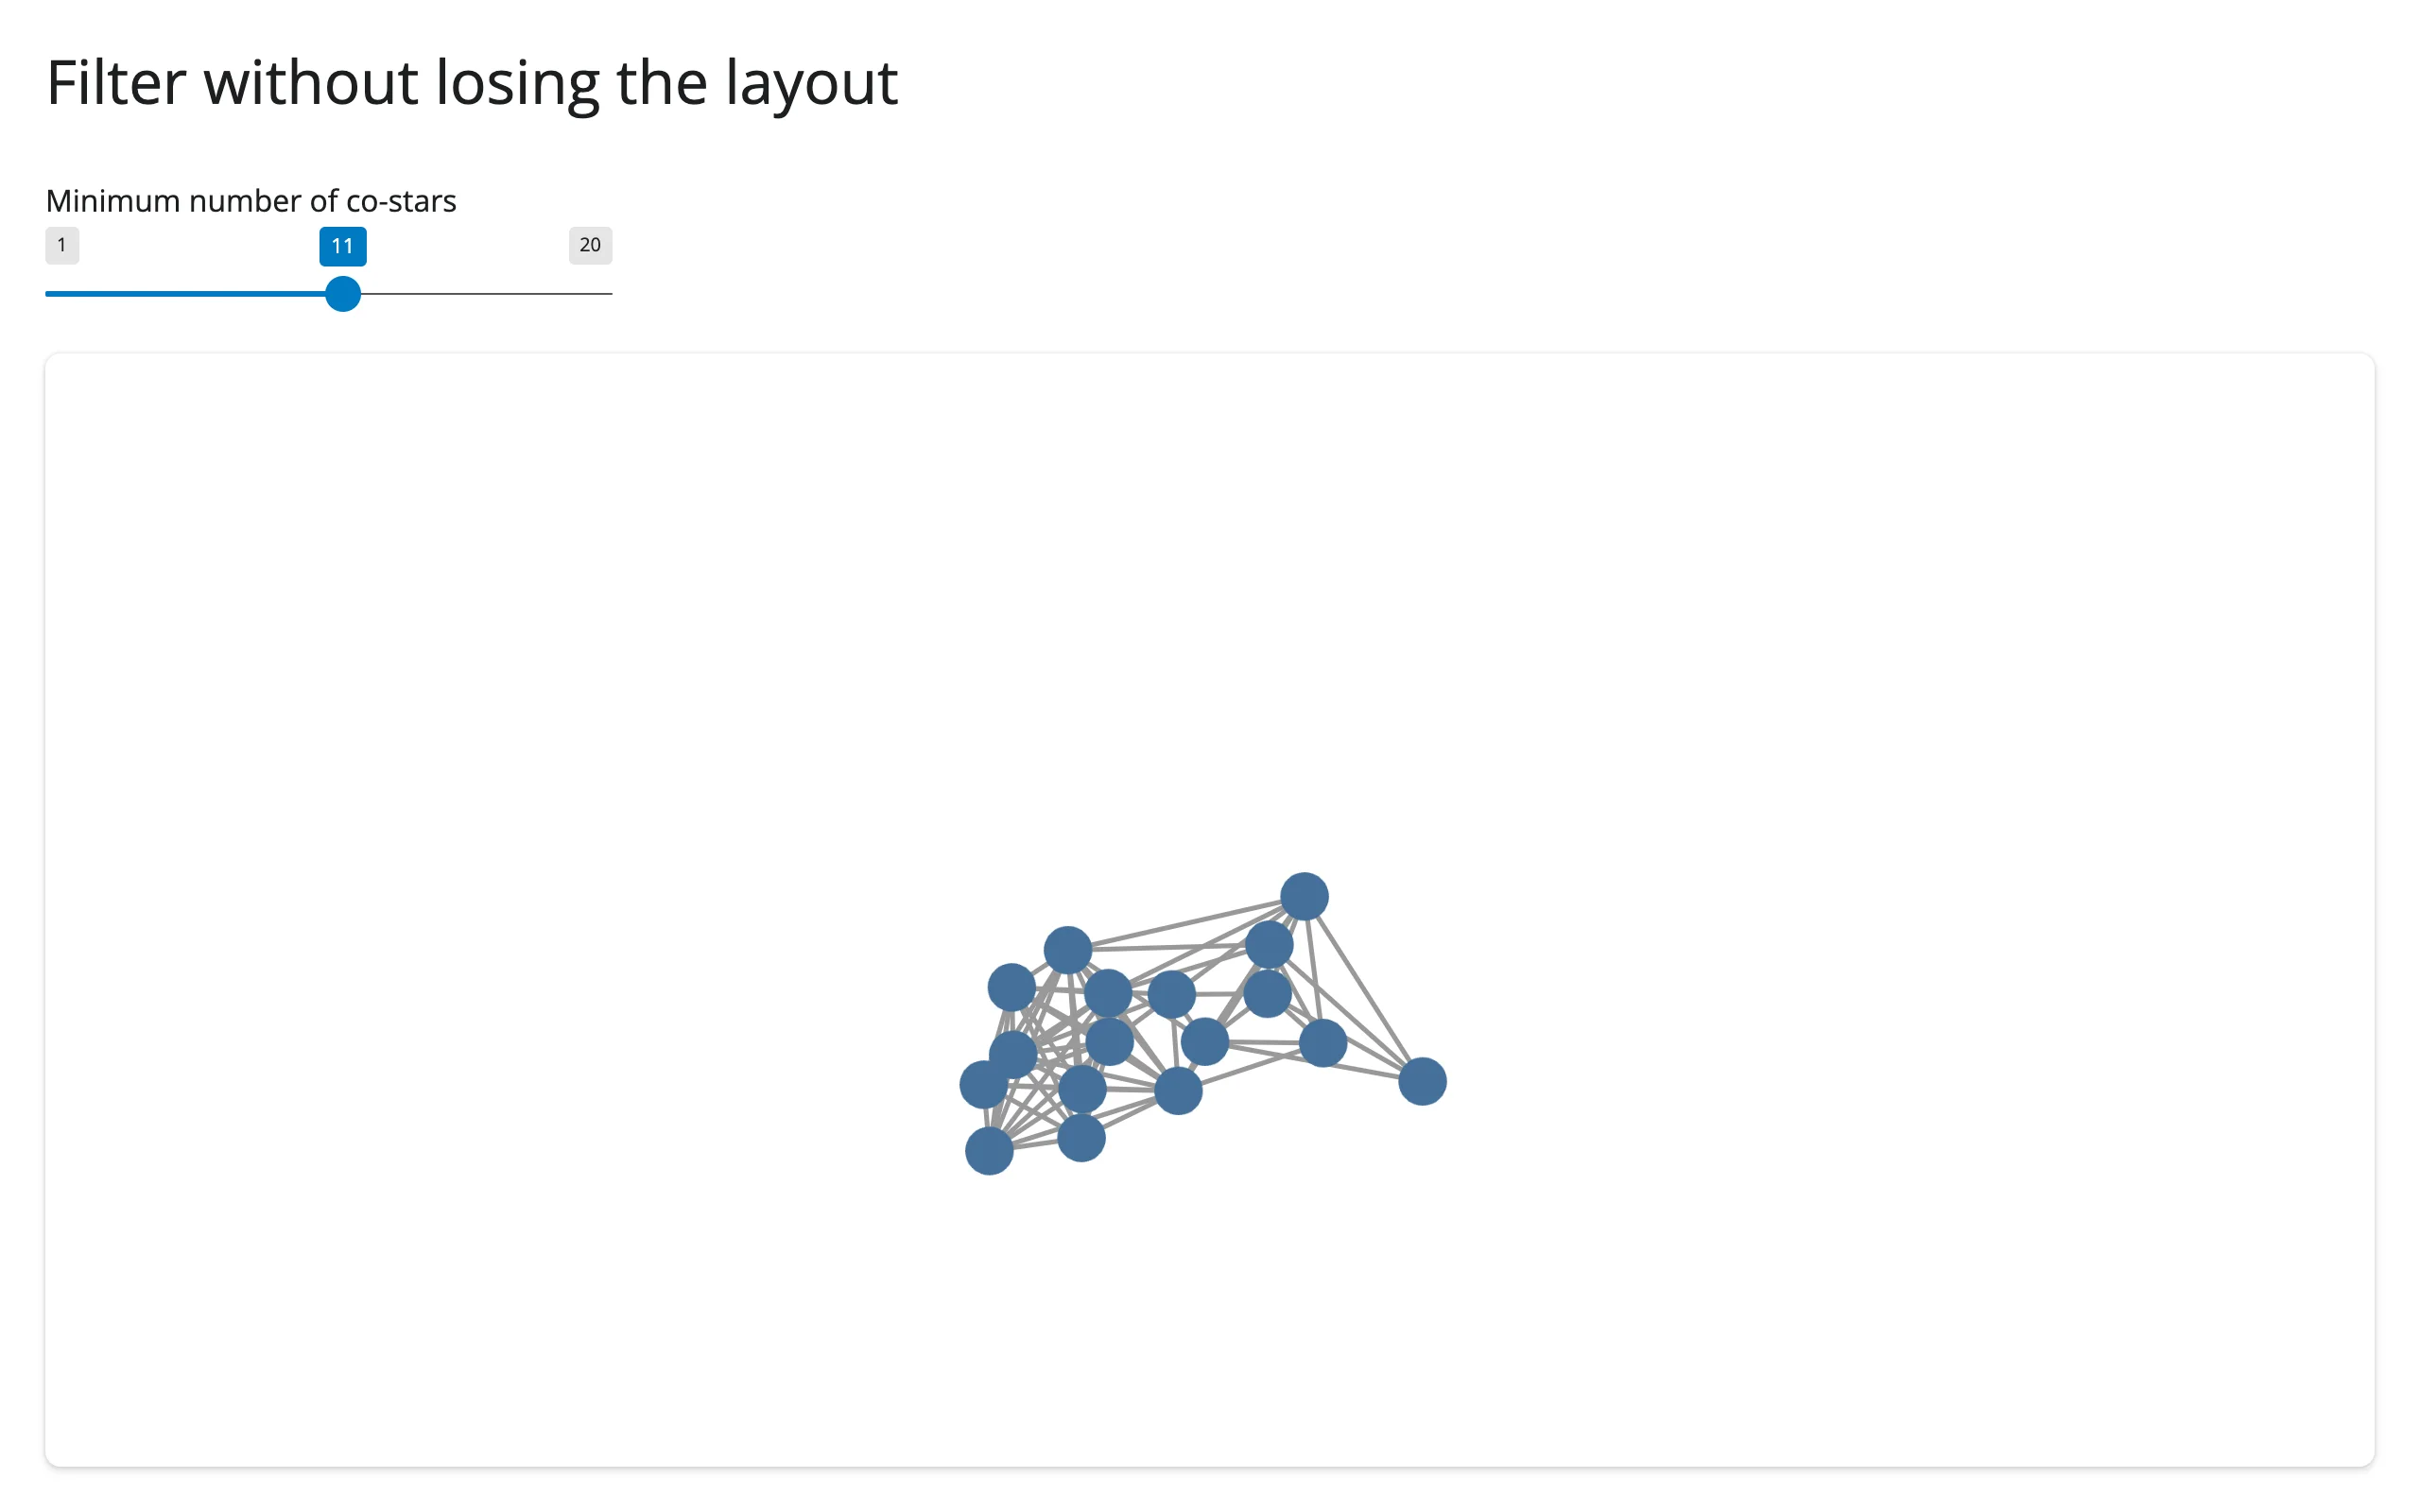 |
Verified directly: comparing every node’s renderedPosition() before and after moving the slider shows zero pixels of movement across all 77 nodes (17 of them stay visible at the >= 11 threshold shown above). Removing nodes instead (remove_node_by_id()) is a structural edit covered in “Gotchas and limitations” – it doesn’t preserve positions and has its own bug; prefer hiding for anything you expect the user to toggle back and forth.
Large data
ipycytoscape doesn’t have a large-data mode: every node and edge is its own ipywidget (see “Gotchas and limitations”), so render time scales with element count – comfortable into the low thousands of nodes, slow well past that, verified on current main. For graphs in the tens of thousands of nodes or more, reach for ipysigma instead, which draws with the GPU (WebGL) rather than one widget per element – the “draw it with the GPU in the browser” approach in Large data & performance’s three approaches.
Layout and sizing
render_ipycytoscape’s height/fill/fillable kwargs (and output_widget()’s) work the way every shinywidgets renderer’s do: the graph fills its card or parent container unless you give it an explicit height, and it tracks sidebar collapses, full-screen toggles, and window resizes. A few things specific to this widget:
- Prefer the decorator’s or
output_widget()’sheight=overwidget.layout.height: the latter sets the ipywidgetsLayouttrait directly, and the graph’s internal layout algorithm can run before that CSS applies, clipping the result to the default 400px rather than your requested height. - The graph does not re-fit itself on a container resize; pan and zoom are preserved through resizes exactly as they are through in-place updates (see above), which means part of the graph can end up outside the visible area after a big resize. Call
widget.relayout()(re-runs the layout with a fresh fit) if you want to recover from that. output_widget(height="auto")(or"fit-content") keeps ipycytoscape’s intrinsic 400px default instead of collapsing to 0px – this was a real shinywidgets regression in an earlier development branch, fixed on current main and covered by a Playwright test (tests/playwright/render_ipycytoscape_fill).
Gotchas and limitations
All verified on ipycytoscape 1.3.3 against shinywidgets main:
- Removing a node from Python corrupts the rest of the graph.
graph.remove_node_by_id(...)can take a 35-node graph down to 16 nodes in the browser, with console errors about duplicate/missing elements. This is an upstream bug in howViewListdiffs removals; adding nodes is fine. Prefer re-rendering (or hiding, as in the filter pattern above) over removing nodes at runtime. - Don’t set
node.selectedfrom Python. It maps to the element’s selectability in the frontend, not its selection state – the opposite of what the name suggests. Use classes to drive highlighting from Python instead. - Positions, zoom, and pan don’t sync from the browser to Python.
node.positionstays empty after a layout runs or after the user drags a node (though setting it from Python does move the node); the top-levelzoomtrait has no browser-side listener at all. You can’t persist a user’s manual arrangement or read the current viewport. - Setting
CytoscapeWidget.zoomfrom Python has no effect in the browser, the opposite direction of the gap above – there’s no way to drive the viewport’s zoom level from Python either way. Only node/edge-level traits (position, classes, style) sync Python -> browser. - An invalid event name passed to
widget.on()corrupts the widget’s callback registry, and every later.on()call then raises. Only use names fromipycytoscape.MONITORED_USER_INTERACTIONS(there’s nodblclick, for instance). Inside a Shiny effect, this is an unhandled exception that ends the session, so validate the event name once at import time if you’re taking it from user input. - Every node and edge is a separate ipywidget (three widget models per node: the node itself plus data/style bookkeeping), so render time scales with element count – comfortable into the low thousands of nodes, slow beyond that. For bigger graphs, use ipysigma.
- Upstream maintenance is light. The last PyPI release was April 2022; the points above are open upstream issues, not shinywidgets bugs, and nothing here has changed in the current release.
Gallery candidates
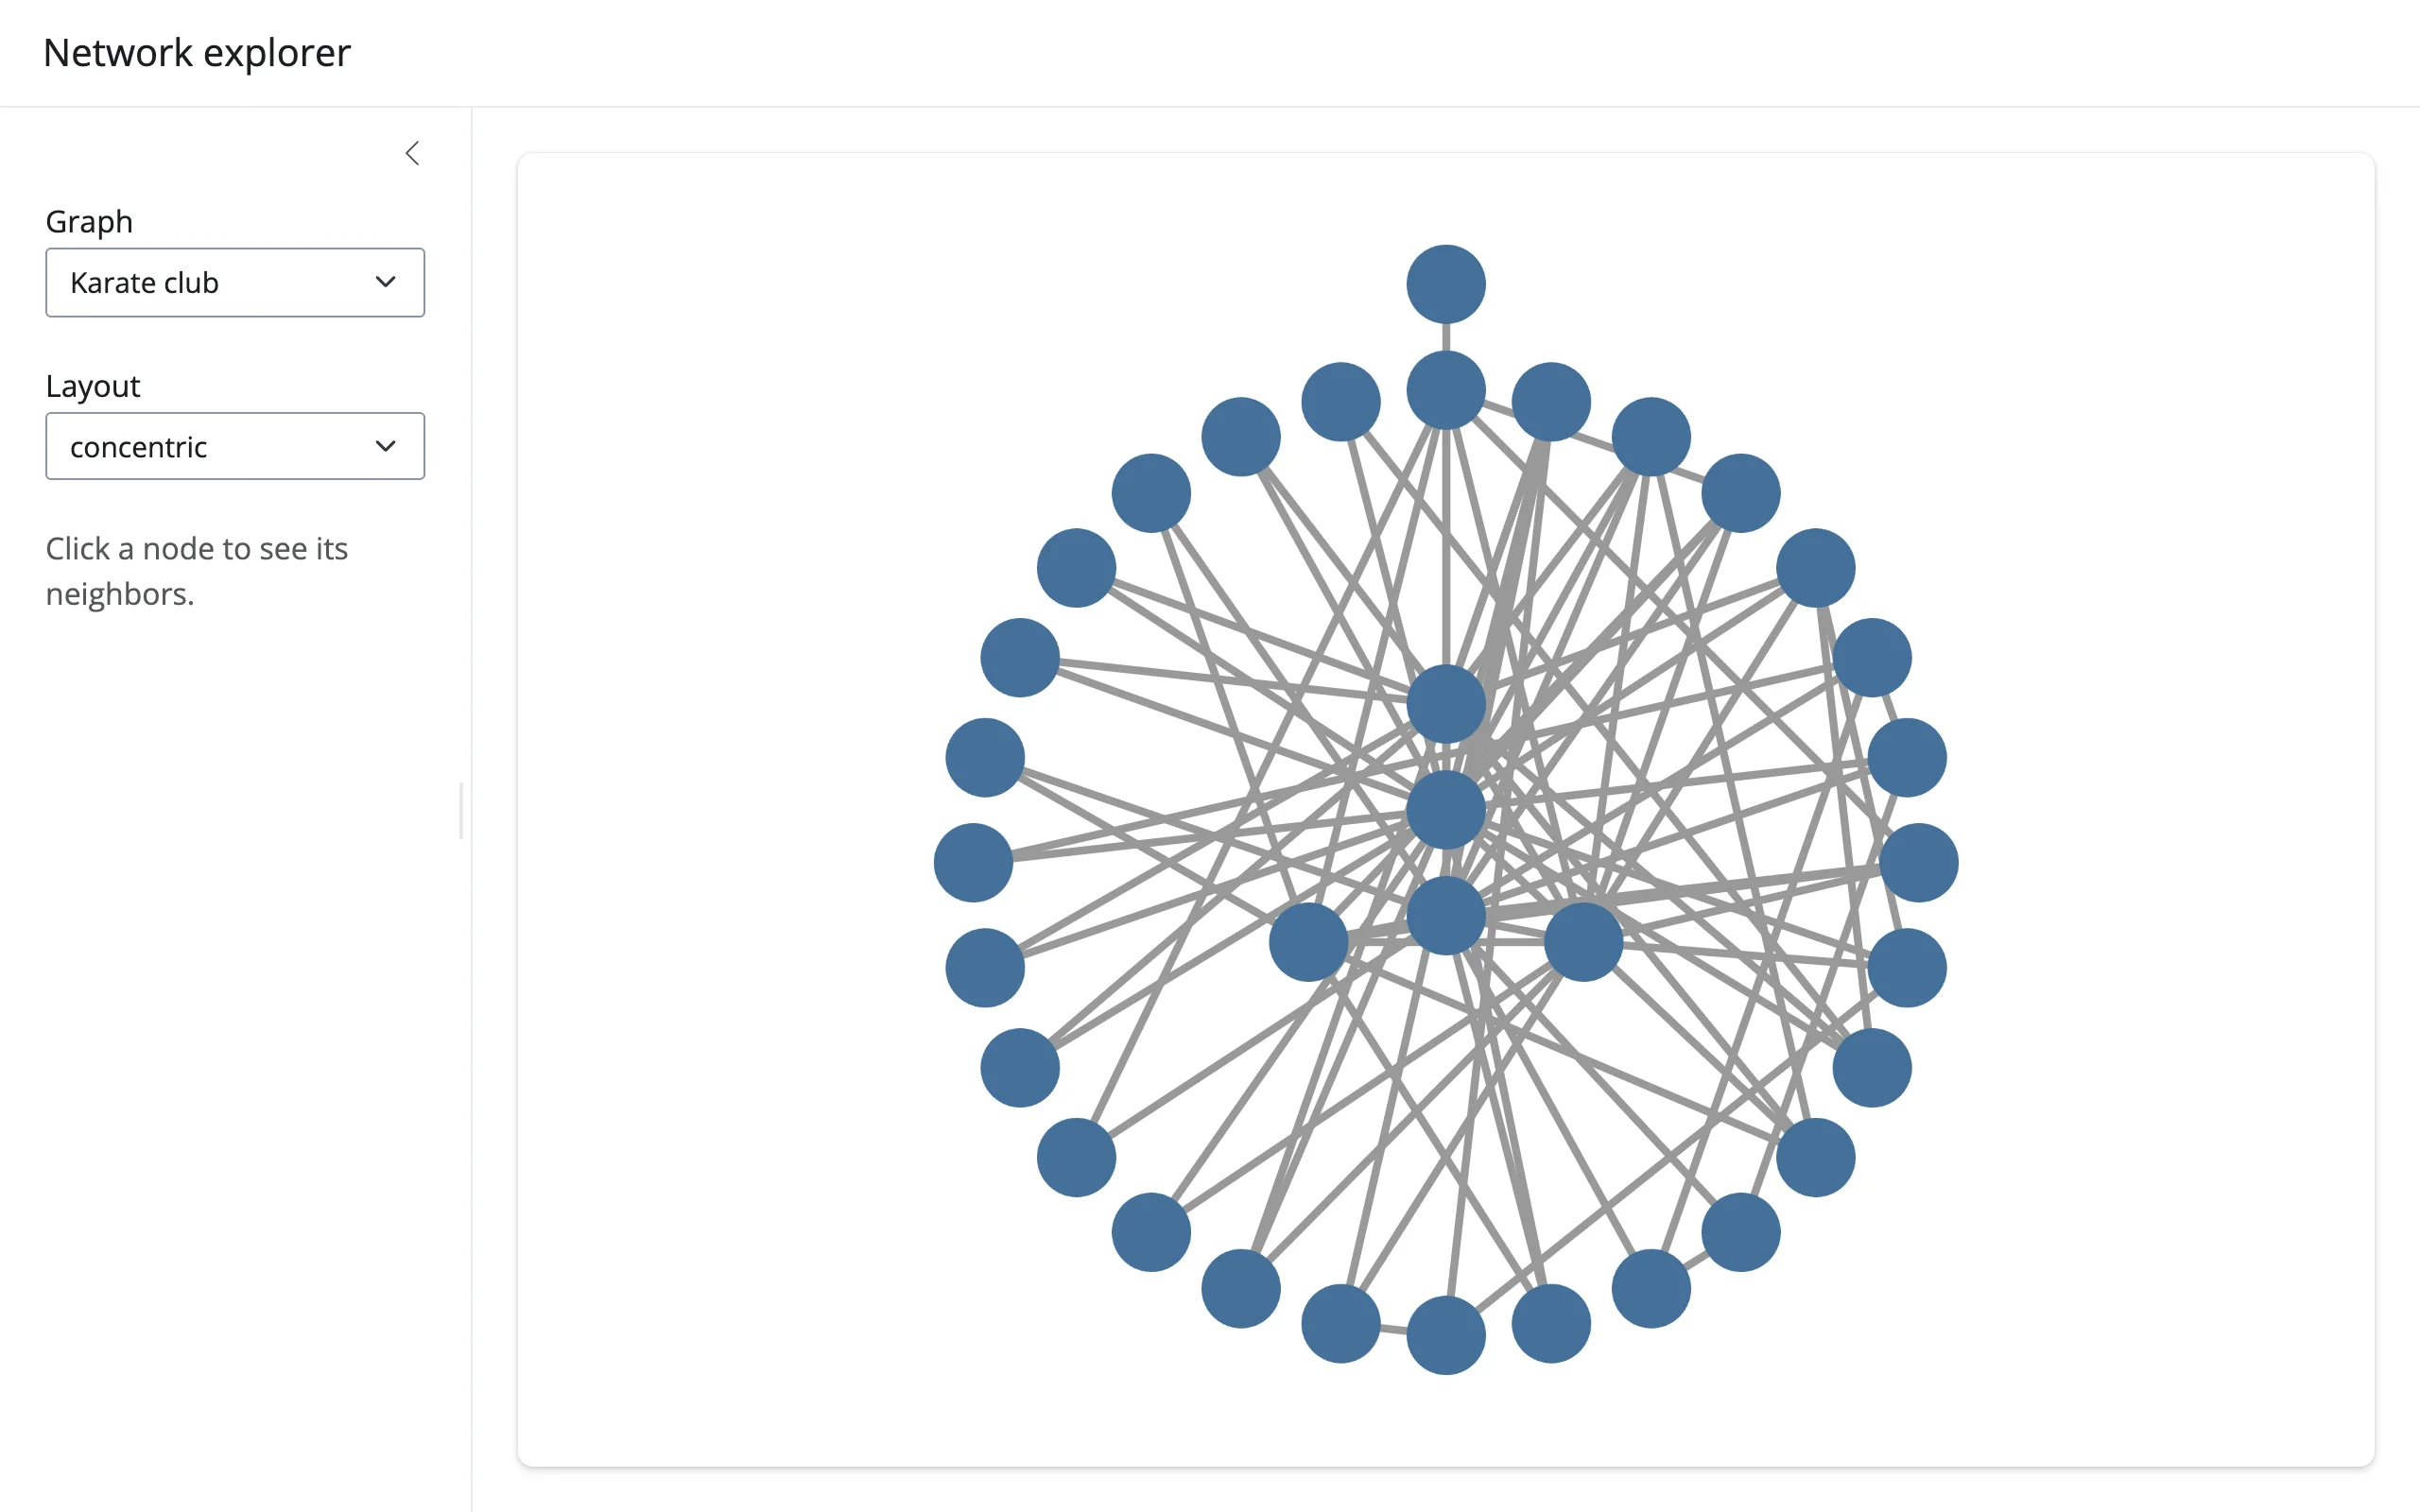
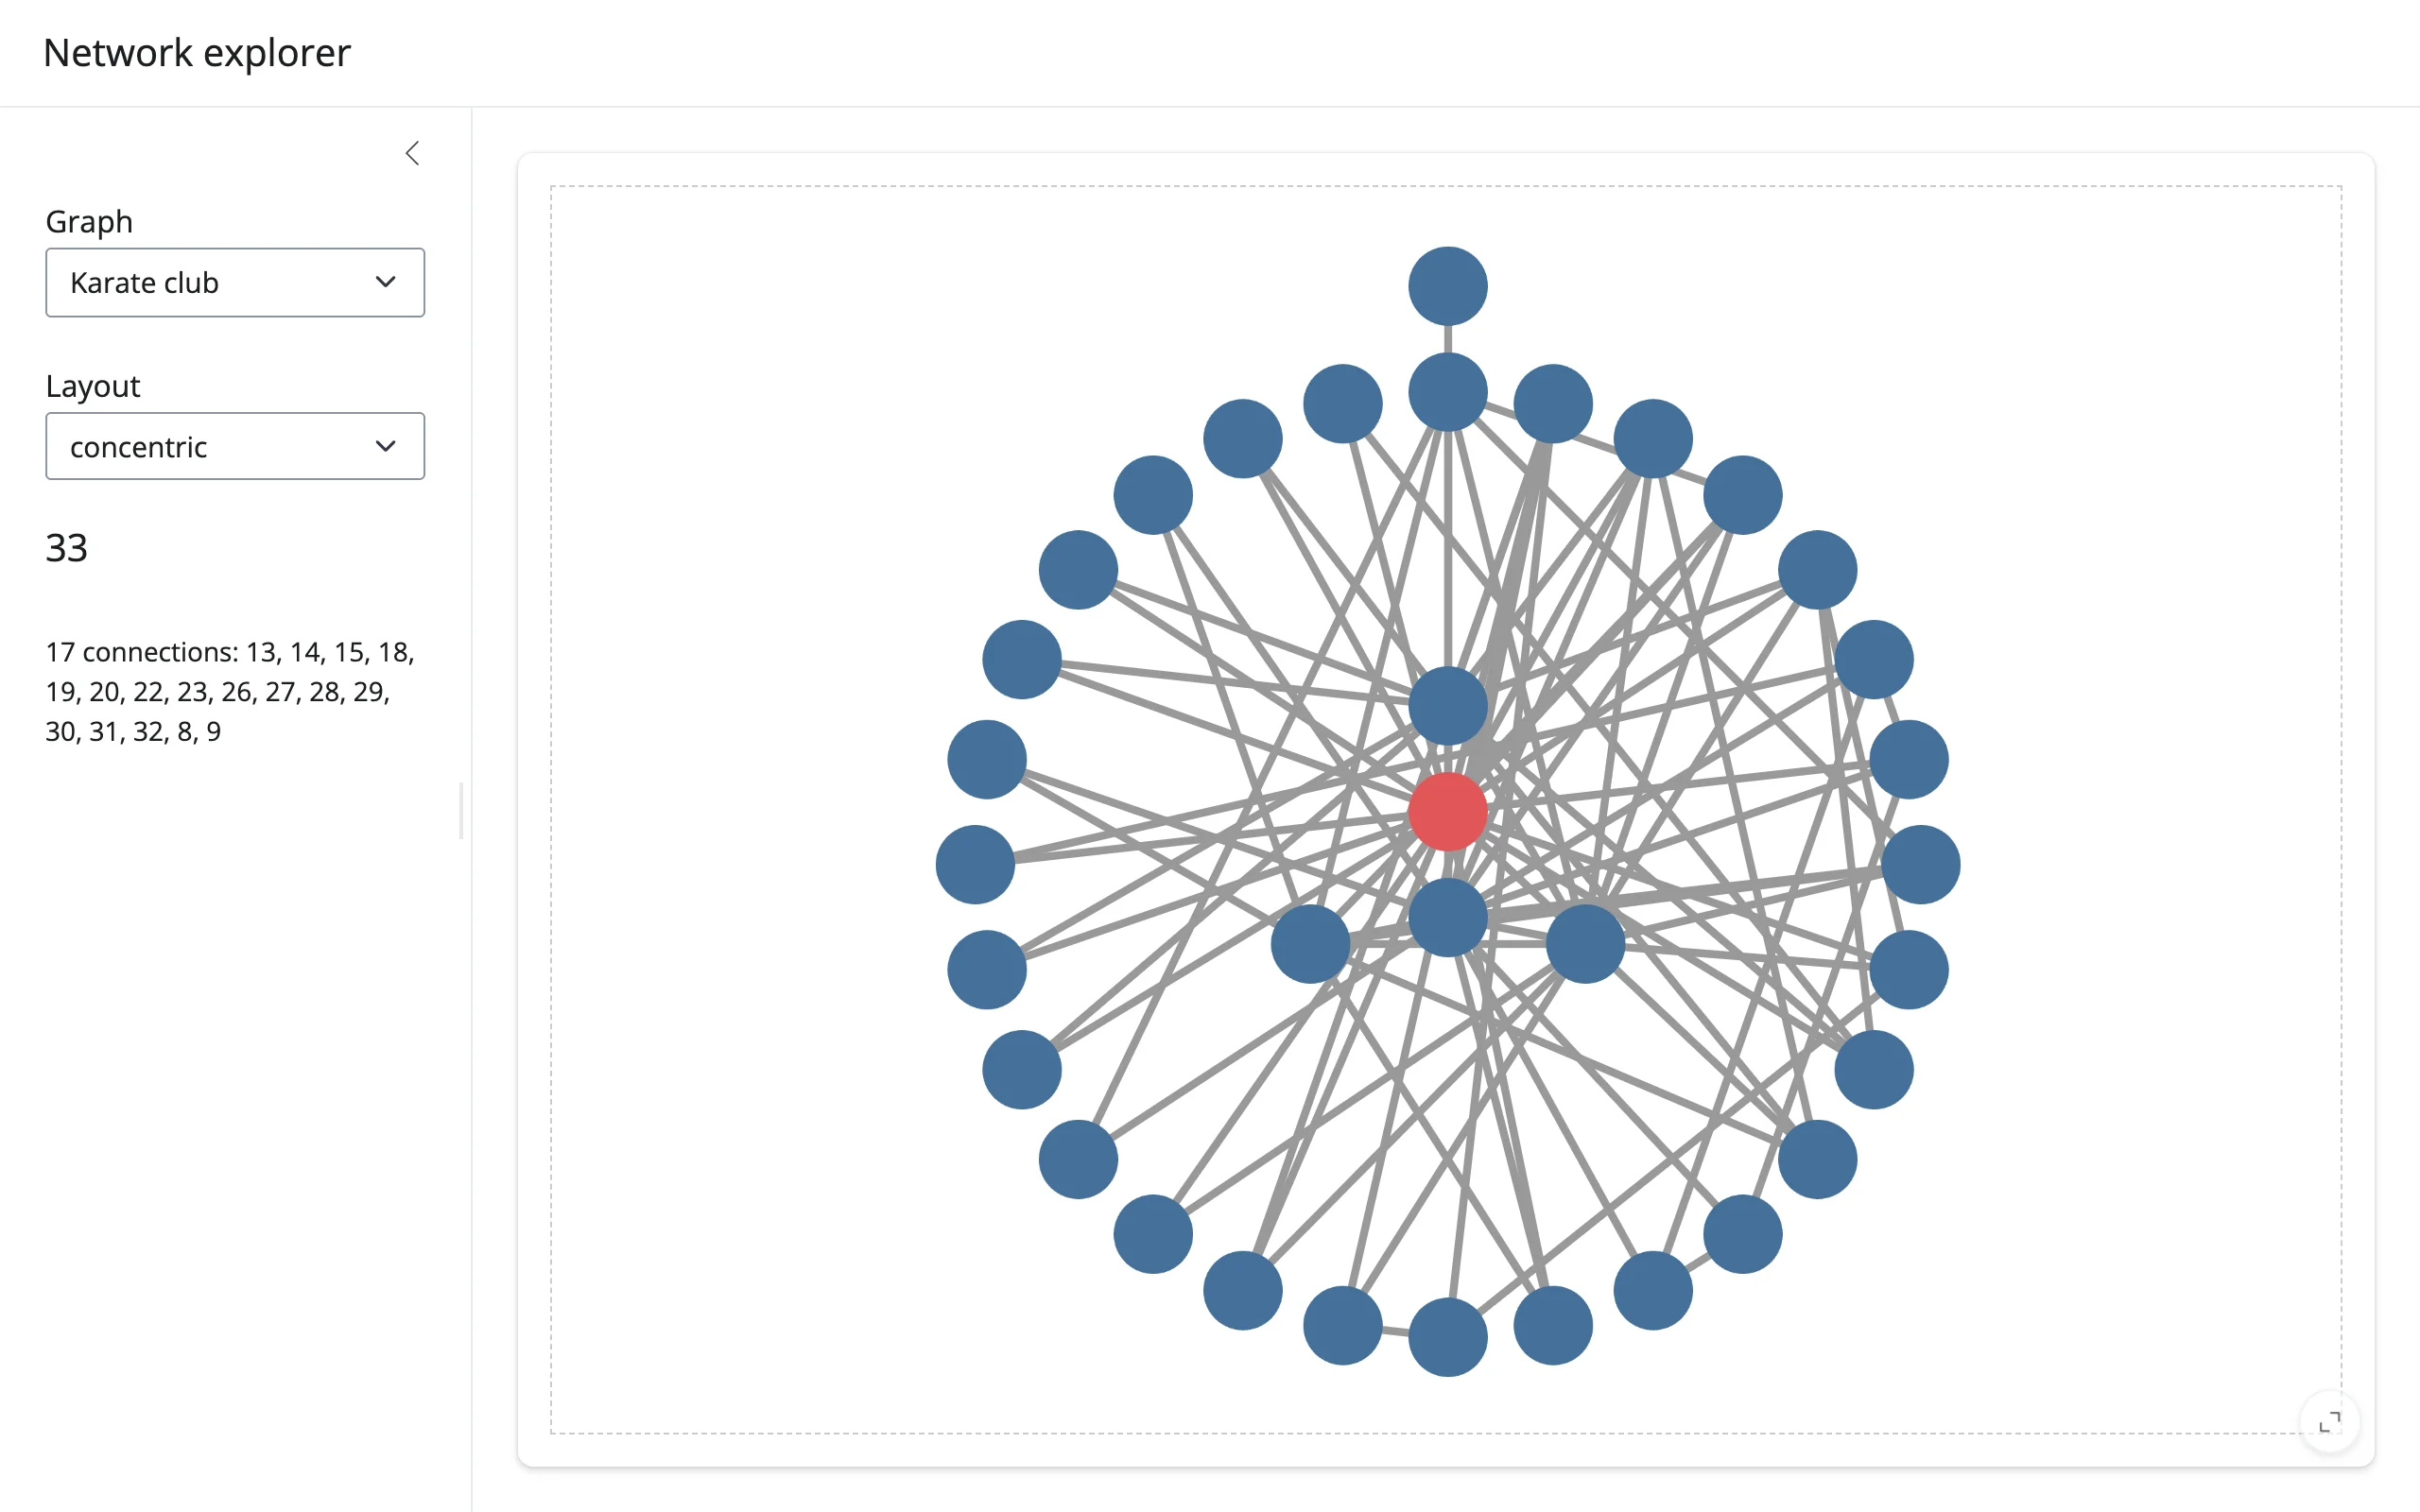
Network explorer (template)
gallery/template_network_explorer.py – pick a built-in graph and layout, click a node for its neighbor list. A small, adaptable starting point: swap in your own graph by replacing the GRAPHS dict.
| Before | After clicking member 33 |
|---|---|
 |
 |
Les Misérables network (showcase)
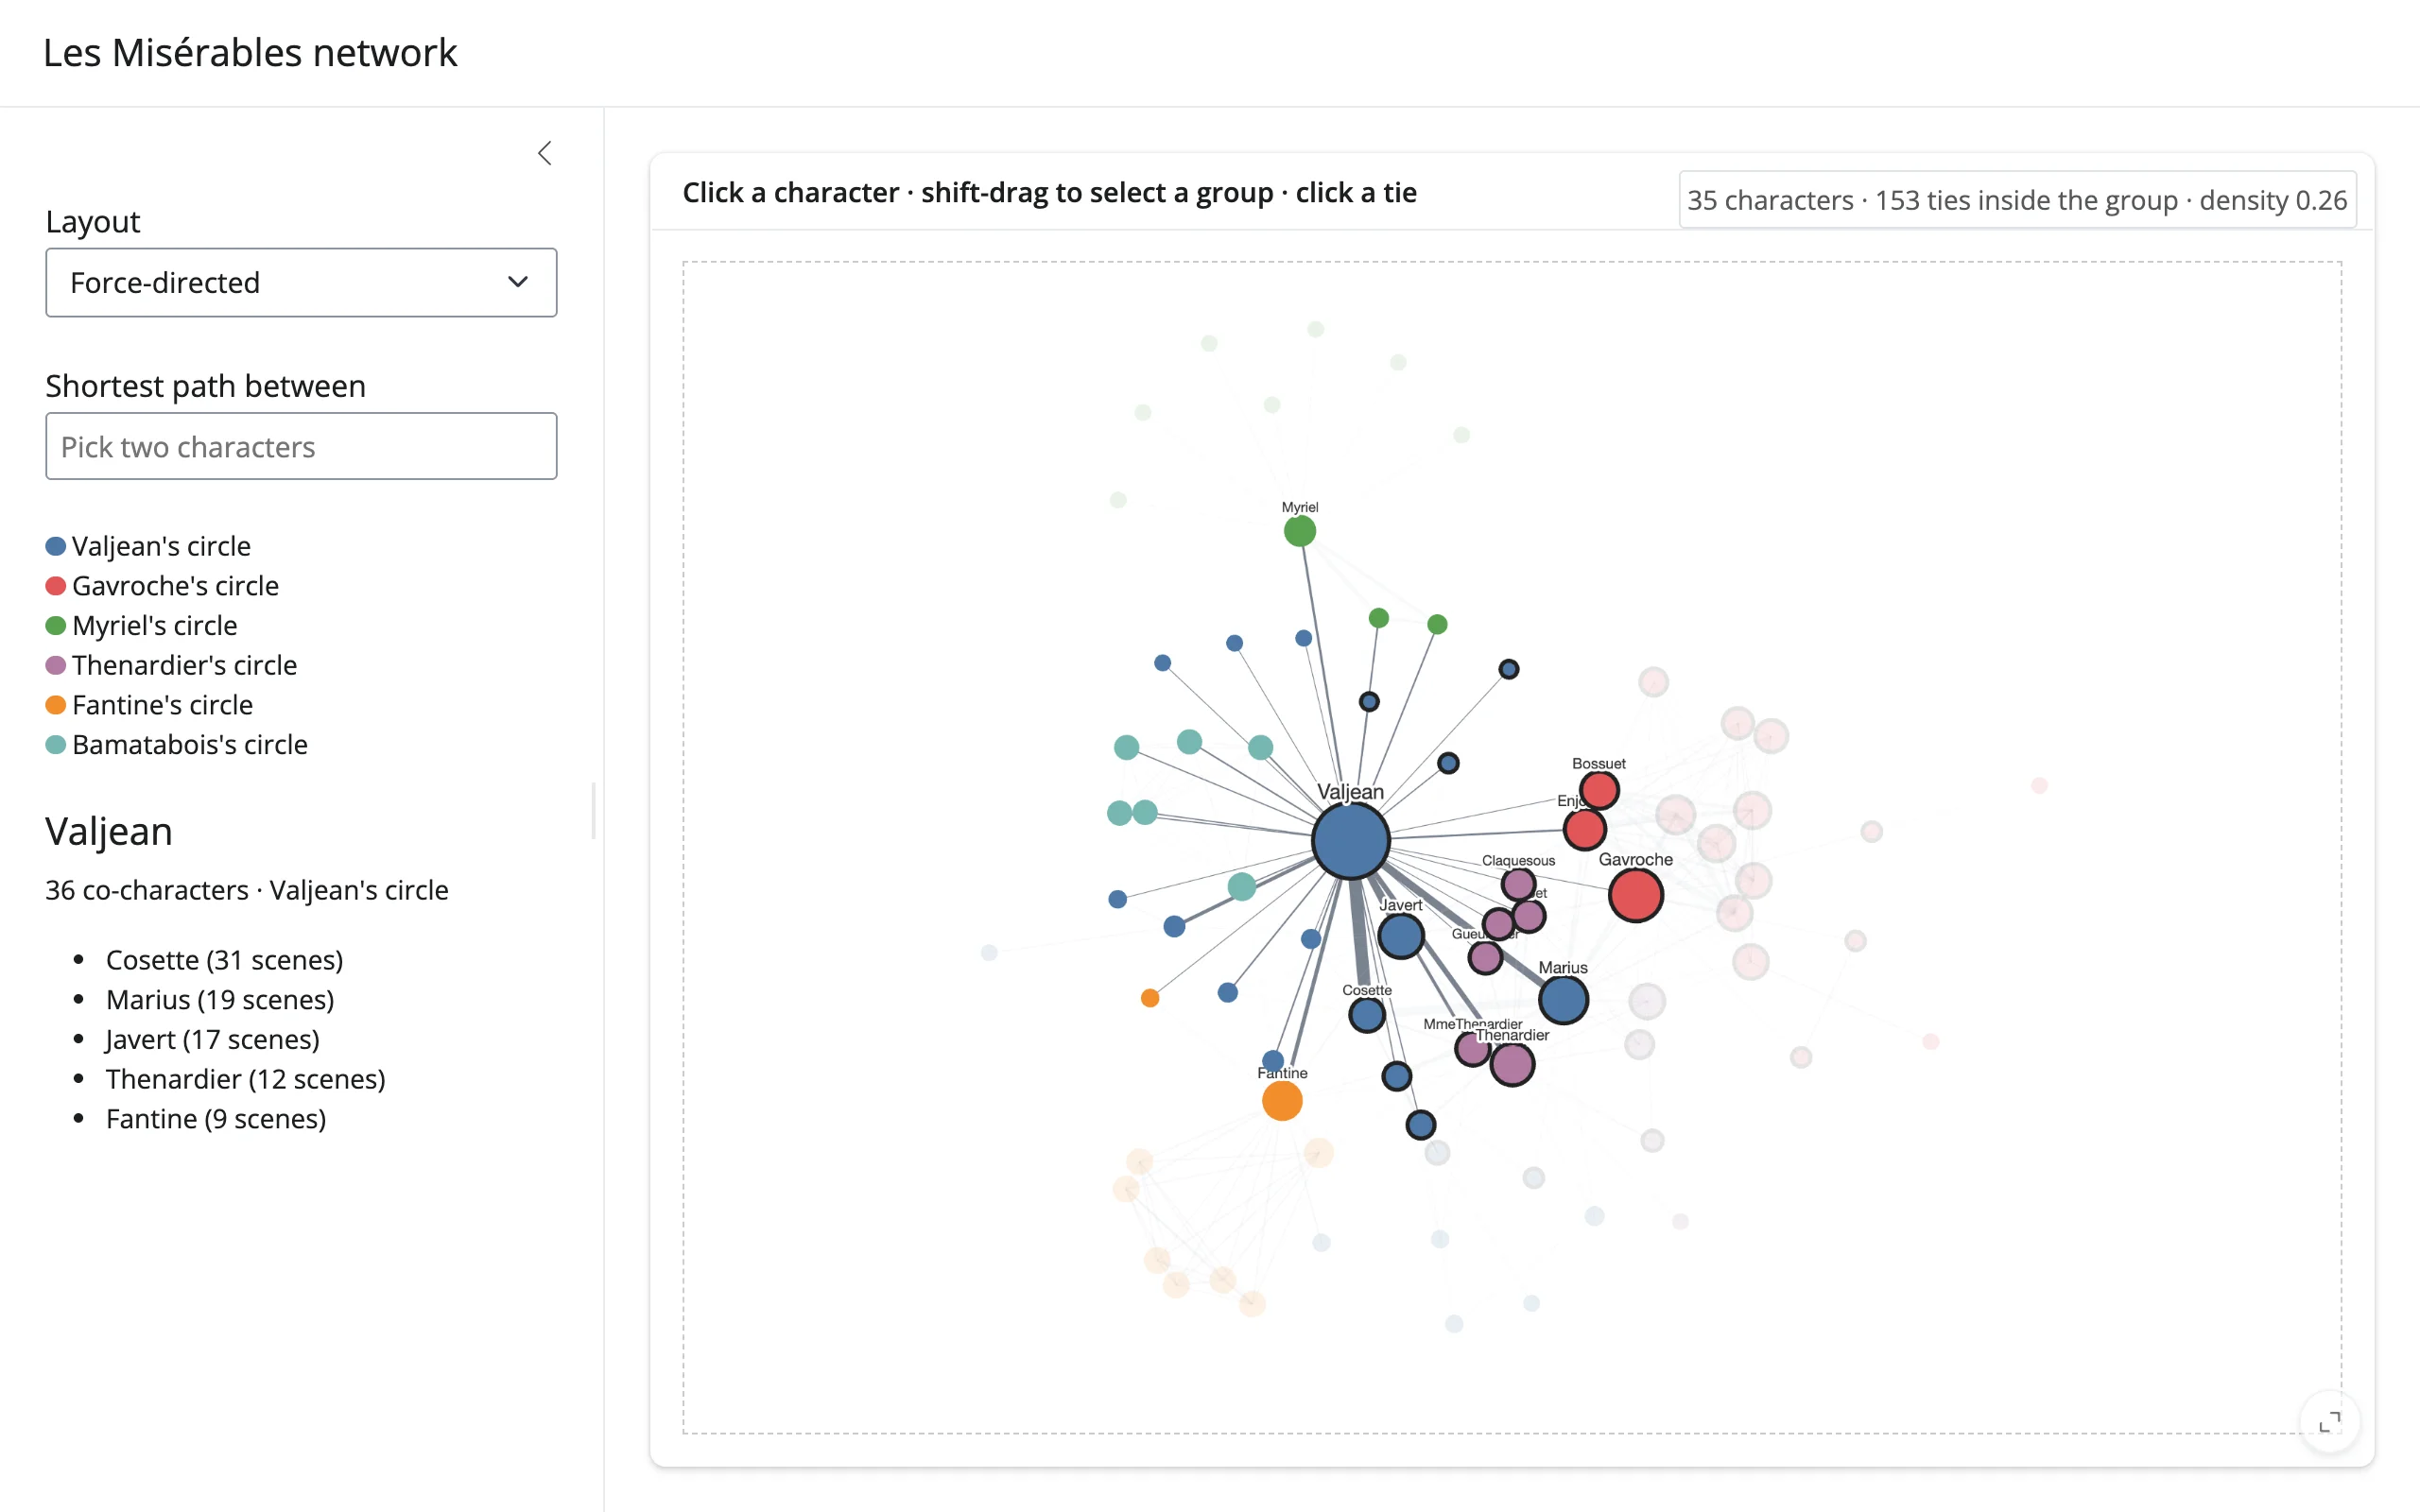
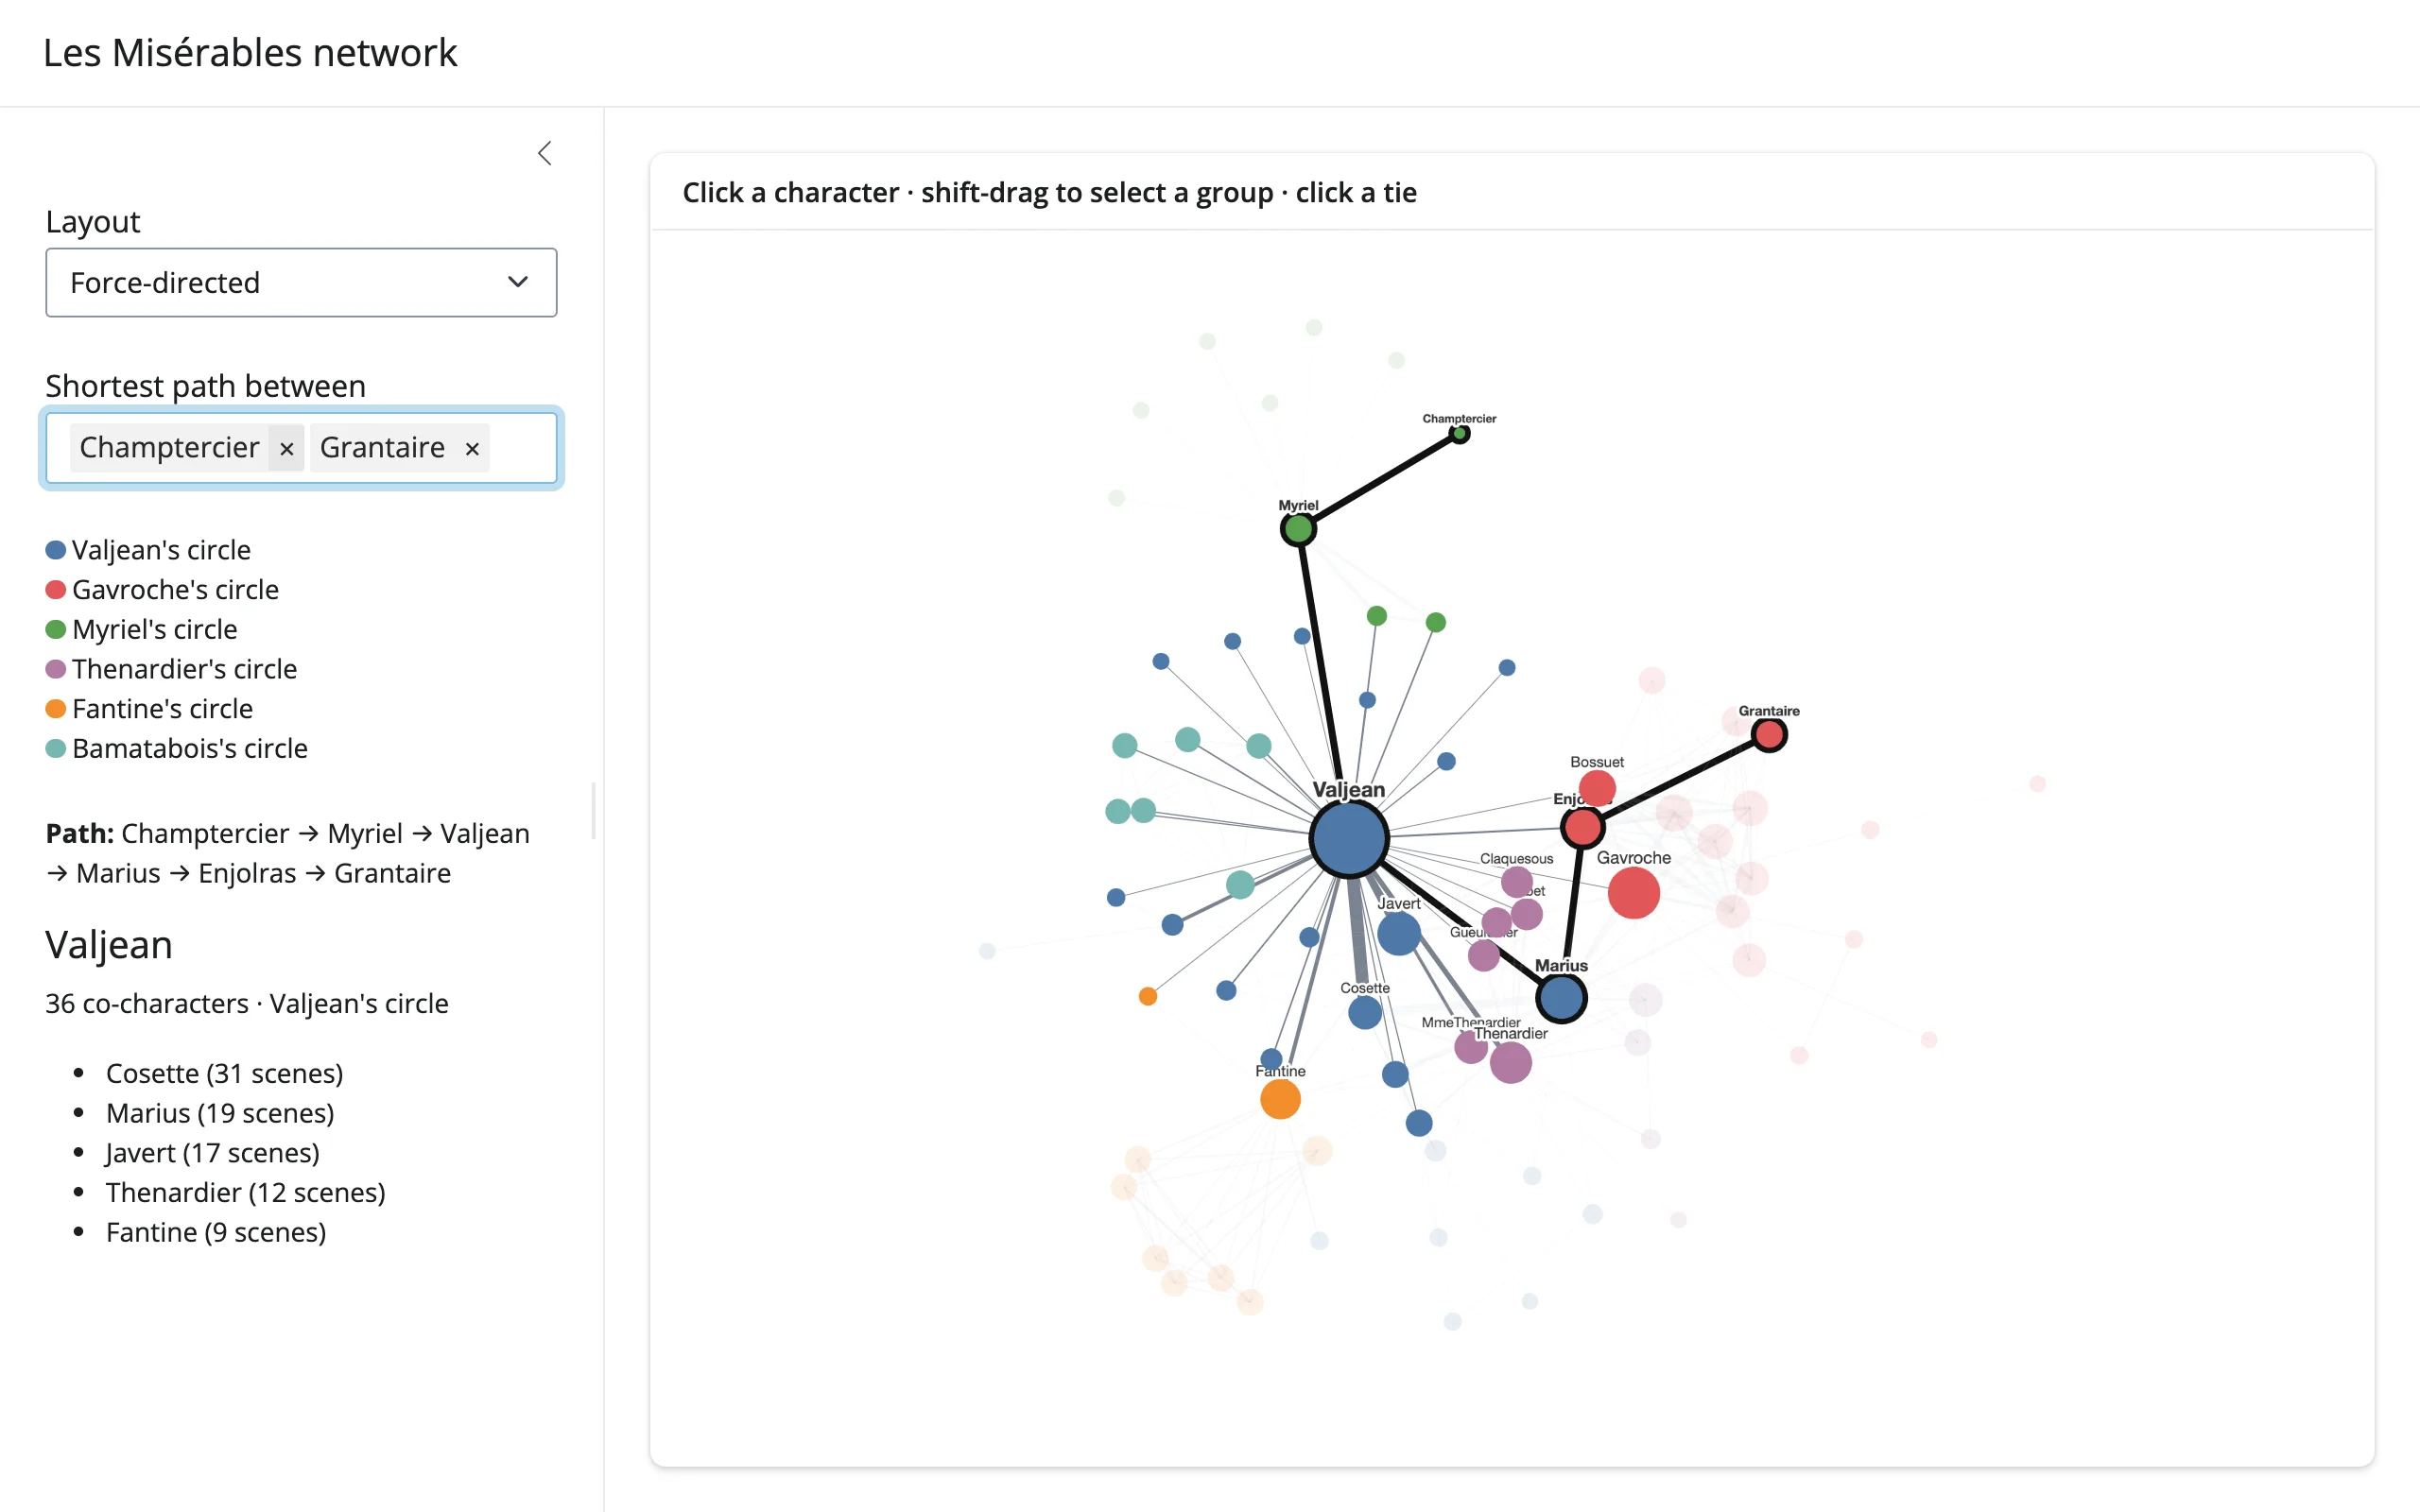
gallery/showcase_les_miserables.py – the full combination: Louvain communities drive node color, degree drives size, clicked_node() focuses a character’s circle with a detail card, shift-drag box selection (via selected_nodes()) reports group density, clicked_edge() reports a tie’s scene count, and a shortest-path picker traces the chain between any two characters. Everything restyles in place; the graph is rendered once.
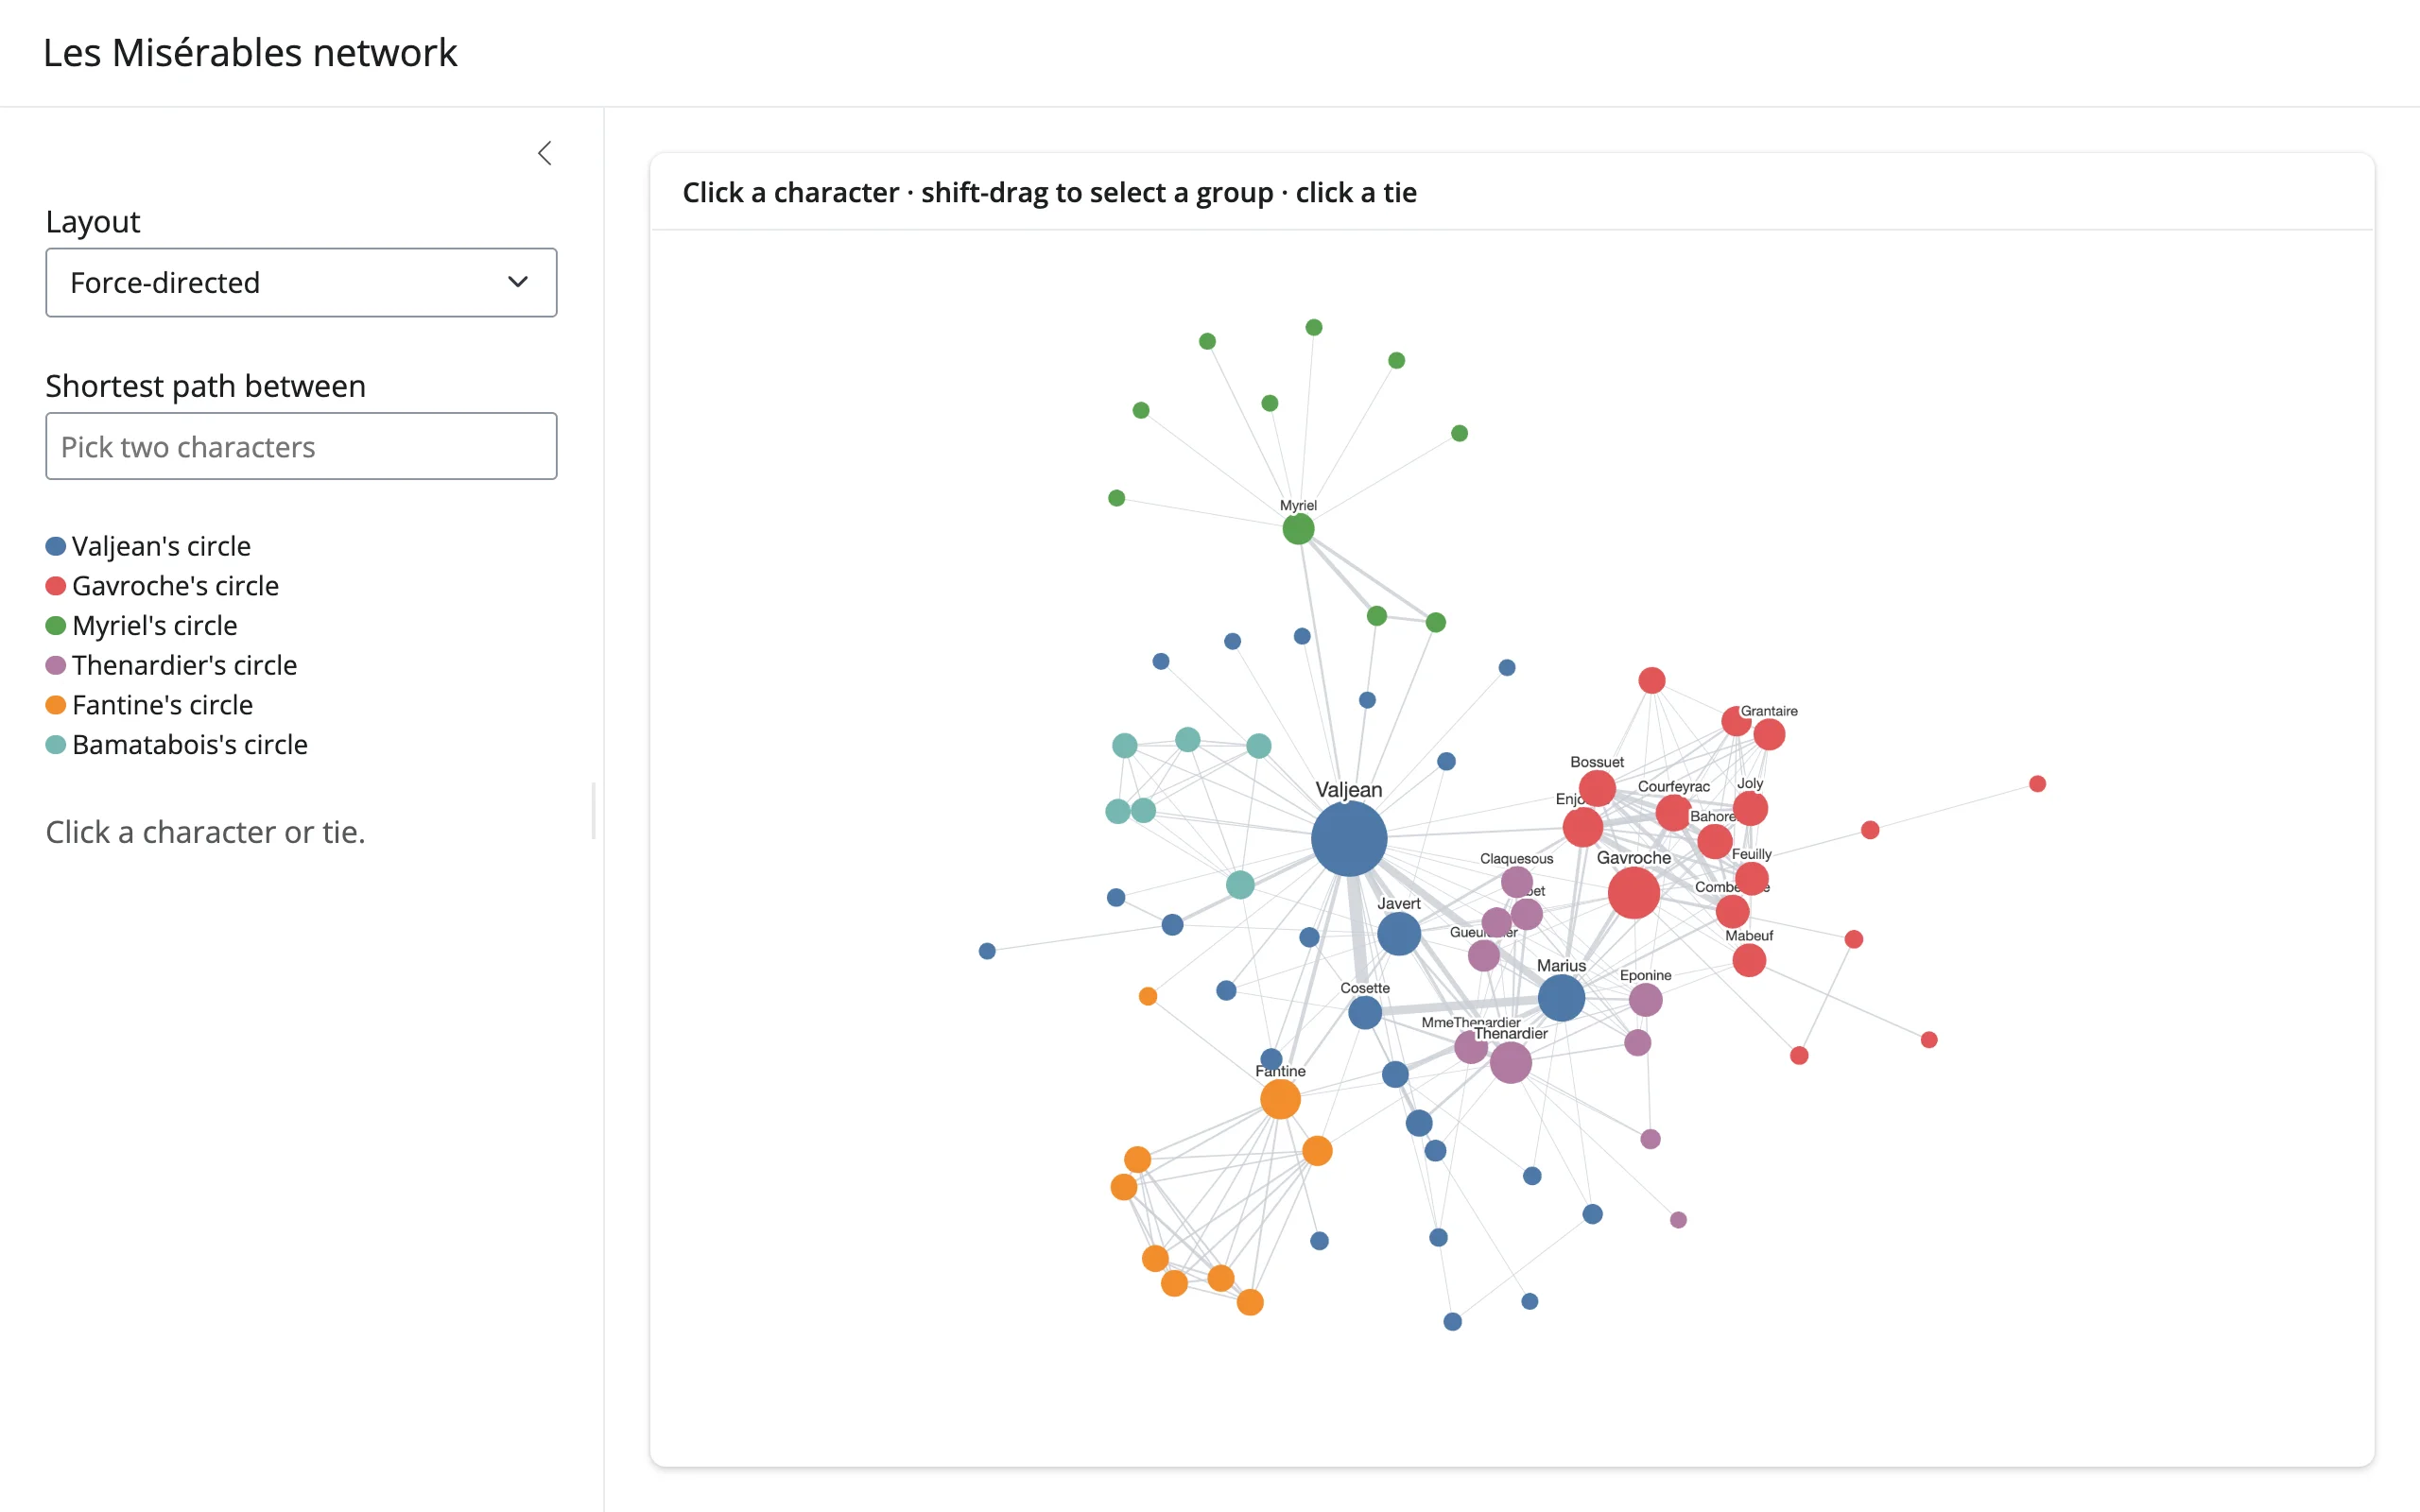
Clicking Valjean fades everyone outside his circle and lists his top co-stars:
Shift-dragging a box over a cluster reports its size and density:
Picking two characters traces the path between them, on top of whatever focus/selection is already active:
Learn more
- ipycytoscape on GitHub and its documentation
- Cytoscape.js documentation for the full stylesheet and layout reference (every layout name and style property ipycytoscape accepts comes straight from here)
- networkx documentation for graph construction and algorithms (communities, shortest paths, centrality)
- ipysigma for large graphs (tens of thousands of nodes and up)
- ipyleaflet and lonboard for geographic networks